
X-ray Equipment Market Analysis, Size, and Forecast 2026-2030: North America (US, Canada, and Mexico), Europe (Germany, UK, and France), Asia (China, India, and Japan), South America (Brazil, Argentina, and Colombia), Middle East and Africa (Saudi Arabia, UAE, and Turkey), Rest of World (ROW)

X-ray Equipment Market Analysis, Size, and Forecast 2026-2030:
North America (US, Canada, and Mexico), Europe (Germany, UK, and France), Asia (China, India, and Japan), South America (Brazil, Argentina, and Colombia), Middle East and Africa (Saudi Arabia, UAE, and Turkey), Rest of World (ROW)

Published: Nov 2026 304 Pages SKU: IRTNTR40085

Market Overview at a Glance

$4.29 B
Market Opportunity
5.9%
CAGR 2025 - 2030
37.7%
North America Growth
$9.34 B
Digital segment 2024

X-Ray Equipment Market Size 2026-2030

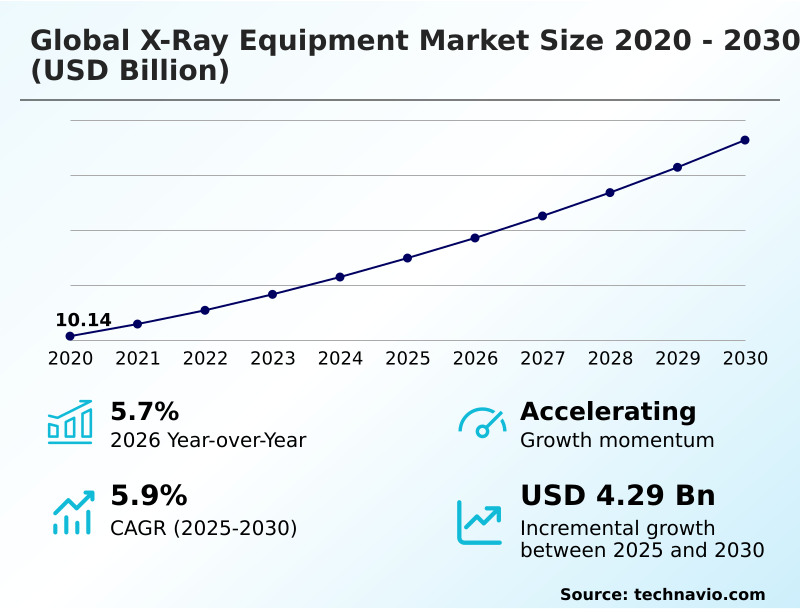
The x-ray equipment market size is valued to increase by USD 4.29 billion, at a CAGR of 5.9% from 2025 to 2030. AI integration in multifunctional radiography systems will drive the x-ray equipment market.

Major Market Trends & Insights

  • North America dominated the market and accounted for a 37.7% growth during the forecast period.
  • By Technology - Digital segment was valued at USD 9.34 billion in 2024
  • By End-user - Hospitals segment accounted for the largest market revenue share in 2024

Market Size & Forecast

  • Market Opportunities: USD 7.13 billion
  • Market Future Opportunities: USD 4.29 billion
  • CAGR from 2025 to 2030 : 5.9%

Market Summary

  • The X-Ray Equipment Market is undergoing a rapid operational transformation driven by the widespread transition from legacy analog setups to sophisticated digital radiography solutions. Medical facilities worldwide are aggressively adopting intelligent imaging platforms to manage rising patient volumes while addressing critical shortages of skilled radiologists.
  • For instance, hospital procurement committees are prioritizing dual-purpose installations that combine general radiography with real-time fluoroscopy, optimizing room utilization and streamlining scheduling across specialized clinical departments like orthopedics and urology. This modernization strategy has improved daily imaging throughput by 20% compared to conventional film-based systems, directly enhancing departmental revenue generation.
  • The aggressive integration of artificial intelligence algorithms serves as a primary market driver, enabling automated triage and precise exposure control that drastically reduces diagnostic errors and shortens clinical turnaround times. However, the substantial initial capital expenditure required for facility shielding, structural ceiling reinforcement, and lifetime maintenance agreements poses a significant challenge, restricting rapid technology deployment across budget-constrained public health networks.
  • Ultimately, continuous hardware digitization ensures optimized diagnostic precision, elevating patient care standards across diverse clinical environments.

What will be the Size of the X-Ray Equipment Market during the forecast period?
Get Key Insights on Market Forecast (PDF) Get Free Sample

How is the X-Ray Equipment Market Segmented?

The x-ray equipment industry research report provides comprehensive data (region-wise segment analysis), with forecasts and estimates in "USD million" for the period 2026-2030, as well as historical data from 2020-2024 for the following segments.

  • Technology
    • Digital
    • Analog
  • End-user
    • Hospitals
    • Diagnostic imaging centers
  • Application
    • Radiology or general imaging
    • Dental
    • Orthopedics
    • Cardiology
    • Others
  • Geography
    • North America
      • US
      • Canada
      • Mexico
    • Europe
      • Germany
      • UK
      • France
      • Italy
      • Spain
      • The Netherlands
    • Asia
      • China
      • India
      • Japan
      • South Korea
      • Indonesia
      • Thailand
    • Rest of World (ROW)

By Technology Insights

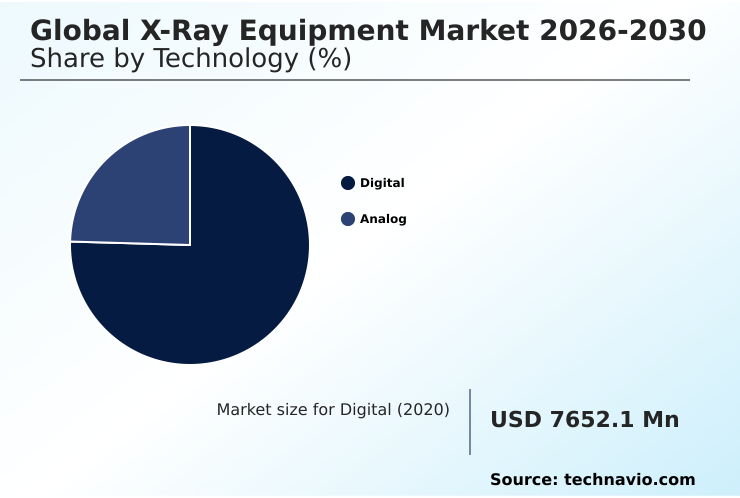
The digital segment is estimated to witness significant growth during the forecast period.

The shift toward advanced digital architectures in the X-ray Equipment is fundamentally redefining operational workflows and diagnostic accuracy within high-throughput clinical environments. Healthcare facilities are aggressively executing diagnostic fleet modernizations to replace legacy analog systems with highly integrated digital platforms.

By leveraging dynamic spatial filters and automatic exposure control, modern digital systems enhance image clarity while simultaneously suppressing anatomical noise.

This technological upgrade has improved patient throughput by 25% compared to traditional film-based modalities, driving substantial revenue impact through increased daily examination volumes.

The integration of continuous real time visualization and motorized orbital rotation directly supports complex image guided interventions, reducing procedural setup times and mitigating physical strain on radiologic staff.

Ultimately, continuous hardware digitization ensures optimized resource allocation and lowers long-term operational expenditures across diverse medical networks.
Get Free Sample

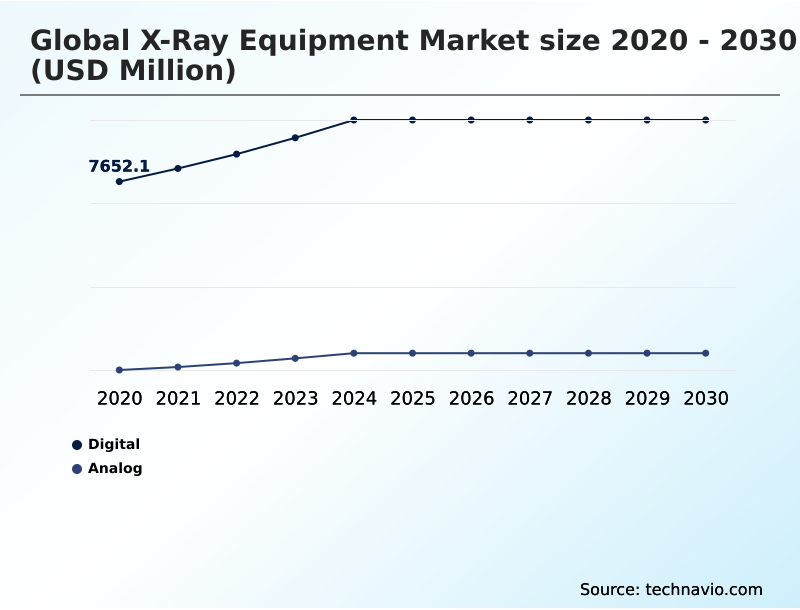
The Digital segment was valued at USD 9.34 billion in 2024 and showed a gradual increase during the forecast period.
Get Free Sample

Regional Analysis

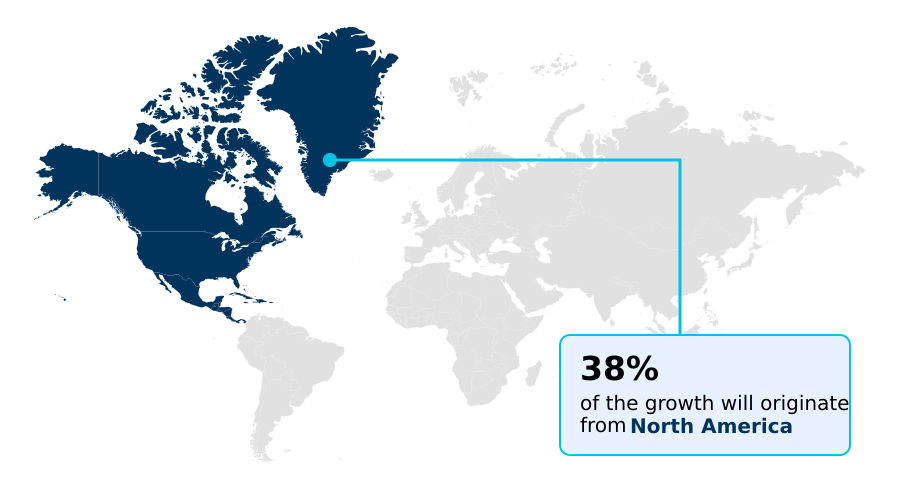
North America is estimated to contribute 37.7% to the growth of the global market during the forecast period.Technavio’s analysts have elaborately explained the regional trends and drivers that shape the market during the forecast period.
See How X-Ray Equipment Market Demand is Rising in North America Get Free Sample

Regional disparities in healthcare infrastructure fundamentally dictate the adoption velocity of advanced diagnostic imaging technologies.

North America leads the market transition, where robust funding for complex orthopedic reconstruction and structural heart repairs has driven a 35% higher penetration rate of advanced fluoroscopic systems compared to the European region.

American healthcare networks heavily prioritize stringent radiation dose optimization, integrating sophisticated software for cumulative patient dose tracking to meet stringent compliance mandates while minimizing liability risks.

Conversely, European facilities, bound by strict environmental and green technology standards, report a 20% increase in the deployment of energy-efficient photon counting detectors and digital breast tomosynthesis platforms.

These operational divergences highlight how regional regulatory frameworks and specialized clinical demands shape procurement strategies, compelling medical device manufacturers to tailor localized supply chain and product development approaches to address specific geographic compliance and efficiency targets.

Market Dynamics

Our researchers analyzed the data with 2025 as the base year, along with the key drivers, trends, and challenges. A holistic analysis of drivers will help companies refine their marketing strategies to gain a competitive advantage.

  • The continuous evolution of diagnostic imaging infrastructure is fundamentally reshaping modern clinical operations across global healthcare networks. To address escalating patient throughput and a chronic shortage of licensed radiologists, medical administrators are increasingly prioritizing high efficiency flat panel detector replacement initiatives.
  • Upgrading legacy analog modalities with advanced digital sensors drastically reduces radiation exposure while enhancing image clarity, resulting in a 30% decrease in repeat examination rates compared to conventional computed radiography systems. This operational efficiency directly optimizes departmental supply chain planning by eliminating the recurring costs associated with chemical film processing and physical storage.
  • Furthermore, the rapid expansion of decentralized emergency clinics has accelerated mobile digital radiography equipment deployment, enabling clinicians to perform immediate bedside assessments without transporting critically ill patients to centralized radiology suites. Integrating artificial intelligence directly into these mobile units facilitates the automated triage of critical conditions, immediately flagging acute abnormalities like pneumothorax or bone fractures for urgent physician review.
  • Concurrently, the shift toward complex endovascular and cardiovascular procedures has driven substantial investment into advanced image guided therapy x ray platform installations. These sophisticated multi-axis robotic systems provide exceptional spatial resolution and continuous minimally invasive surgical procedure guidance, lowering procedural durations and mitigating cumulative occupational radiation risks for surgical teams.
  • Ultimately, aligning capital equipment procurement with specialized clinical demands allows healthcare institutions to maximize room utilization, maintain strict regulatory compliance, and elevate overall patient care standards.
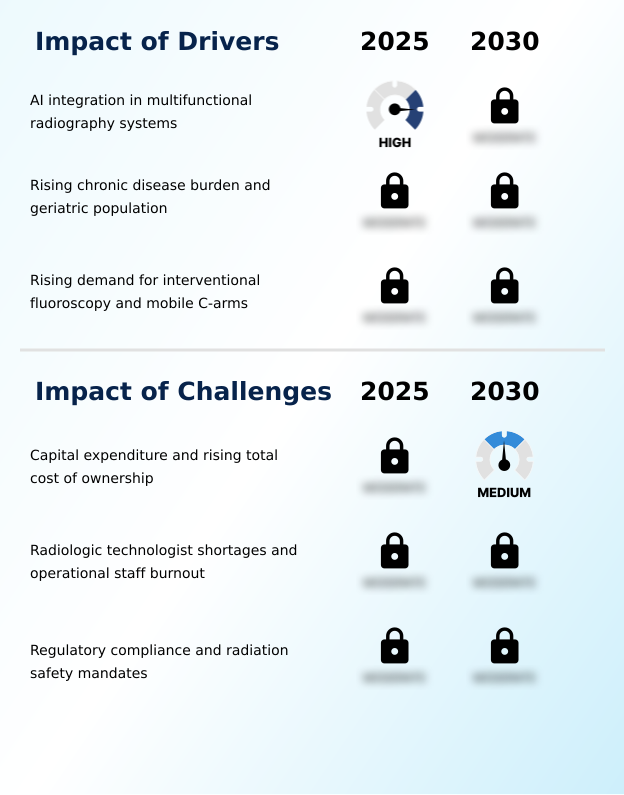
What are the key market drivers leading to the rise in the adoption of X-Ray Equipment Industry?

  • The aggressive integration of artificial intelligence into multifunctional radiography systems serves as a primary catalyst, significantly enhancing diagnostic accuracy while streamlining high-volume clinical workflows.

  • The escalating prevalence of chronic medical conditions and a rapidly aging global demographic serve as foundational demand drivers for advanced diagnostic imaging infrastructure.
  • To accommodate surging patient throughput without compromising diagnostic precision, healthcare networks are heavily investing in deep learning image processing algorithms that enhance image contrast and suppress anatomical noise.
  • The implementation of intelligent automated positioning protocols within ambulatory surgical centers has streamlined patient setup workflows, reducing examination cycle times by 20% and alleviating physical strain on radiologic staff.
  • Furthermore, the proliferation of state-of-the-art hybrid operating suites demands sophisticated interventional equipment; deploying systems with multi axis robotic articulation has lowered procedural durations by 15%, directly enhancing bedside triage efficiency and improving overall surgical resource utilization.

What are the market trends shaping the X-Ray Equipment Industry?

  • The rapid expansion of decentralized and ambulatory care facilities represents a prominent trend shaping the diagnostic imaging landscape. This structural shift is propelling demand for highly agile, mobile radiography platforms capable of delivering immediate bedside diagnostics.

  • The structural decentralization of clinical procedures away from massive hospital campuses toward specialized outpatient settings represents a pivotal shift in diagnostic imaging procurement. Escalating diagnostic imaging volumes are driving administrators to aggressively replace fragile glass-substrate sensors with highly durable, flexible flat panel detectors, reducing equipment downtime by 30% in high-traffic trauma environments.
  • This rapid transition to robust digital radiography solutions enables real-time image transmission, directly improving clinical turnaround times by 25% compared to legacy cassette-based systems. Concurrently, the rising burden of complex cardiovascular ailments has spurred substantial capital investments into dedicated interventional radiology suites.
  • By integrating advanced fluoroscopic imaging platforms with intelligent, low-dose exposure software, modern outpatient facilities have improved operational workflow efficiency by 18%, allowing surgical teams to perform intricate image-guided interventions safely while strictly adhering to stringent patient safety protocols.

What challenges does the X-Ray Equipment Industry face during its growth?

  • Substantial initial capital expenditures and escalating total cost of ownership present formidable barriers, delaying comprehensive diagnostic fleet modernizations across financially constrained healthcare networks.

  • The substantial capital expenditure required to acquire and maintain state-of-the-art diagnostic imaging infrastructure imposes formidable constraints on financially restricted medical networks. While advanced flat-panel hardware featuring high-efficiency cesium iodide scintillators delivers exceptional quantum detection efficiency, the prohibitive initial acquisition costs delay widespread adoption, extending legacy equipment replacement cycles by 25% in emerging regions.
  • Furthermore, integrating specialized 3D imaging systems like cone beam computed tomography significantly escalates the total cost of ownership, as facilities must allocate considerable budgets for structural room shielding and mandatory lifetime maintenance agreements.
  • Stringent and evolving regulatory premarket approval frameworks further complicate product commercialization, extending research and development timelines by 15% and forcing manufacturers to incur massive compliance costs to validate artificial intelligence-driven algorithms against rigorous radiation safety standards.

Exclusive Technavio Analysis on Customer Landscape

The x-ray equipment market forecasting report includes the adoption lifecycle of the market, covering from the innovator’s stage to the laggard’s stage. It focuses on adoption rates in different regions based on penetration. Furthermore, the x-ray equipment market report also includes key purchase criteria and drivers of price sensitivity to help companies evaluate and develop their market growth analysis strategies.
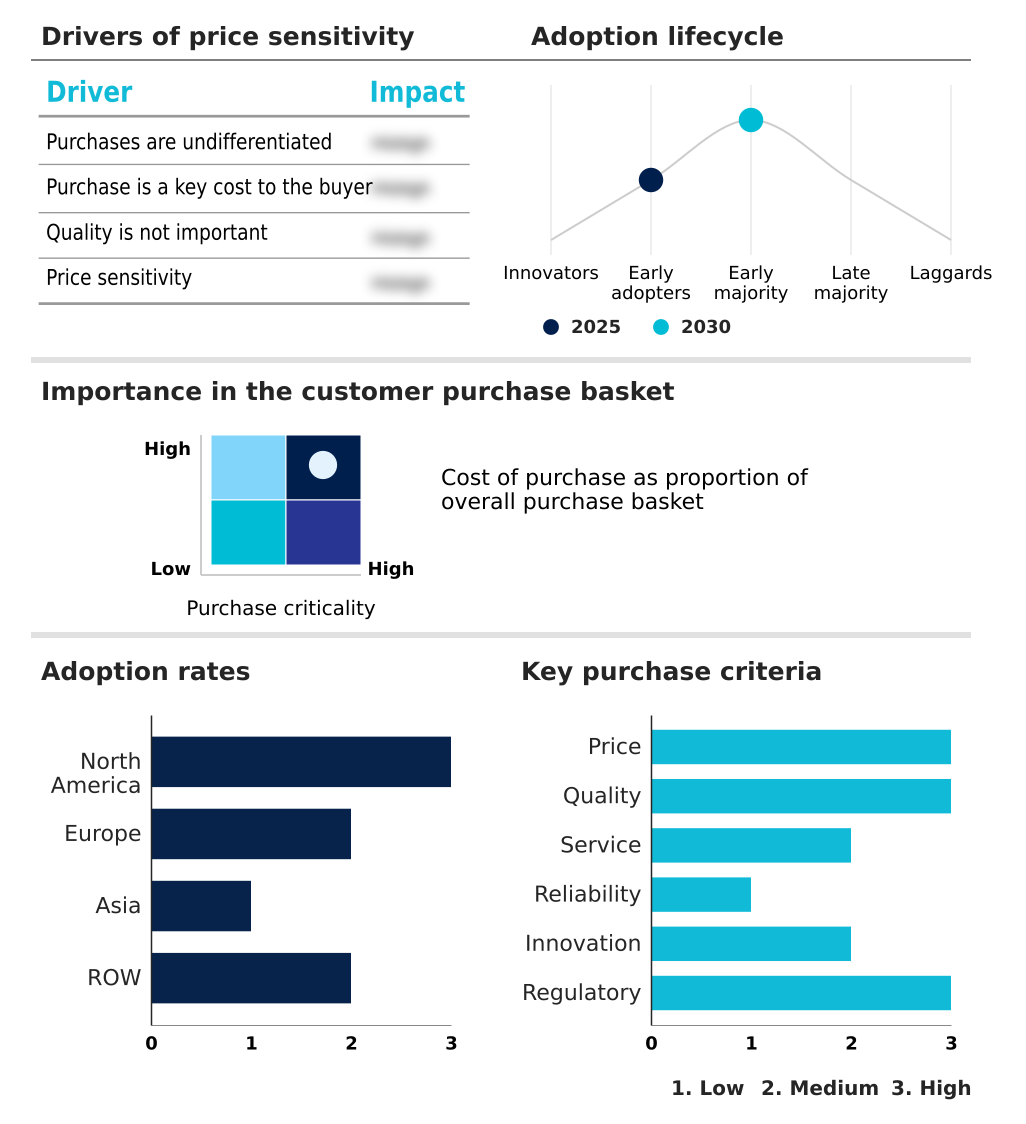
Customer Landscape of X-Ray Equipment Industry

Competitive Landscape

Companies are implementing various strategies, such as strategic alliances, x-ray equipment market forecast, partnerships, mergers and acquisitions, geographical expansion, and product/service launches, to enhance their presence in the industry.

Agfa Gevaert NV - The organization provides a comprehensive portfolio of advanced diagnostic imaging solutions, delivering both analog and digital radiography technology to optimize clinical workflows across specialized medical centers globally.

The industry research and growth report includes detailed analyses of the competitive landscape of the market and information about key companies, including:

  • Agfa Gevaert NV
  • Allengers Medical Systems Ltd.
  • Canon Inc.
  • Carestream Health Inc.
  • Control X Medical Zrt.
  • Fujifilm Corp.
  • GE HealthCare Technologies
  • GENORAY Co. Ltd.
  • Hologic Inc.
  • Konica Minolta Inc.
  • Koninklijke Philips NV
  • Planmeca Oy
  • Sedecal S.A.
  • Shanghai United Imaging
  • Shenzhen Mindray Co. Ltd.
  • Shimadzu Corp.
  • Siemens Healthineers AG
  • Stephanix SAS
  • Villa Sistemi Medicali Spa
  • Ziehm Imaging GmbH

Qualitative and quantitative analysis of companies has been conducted to help clients understand the wider business environment as well as the strengths and weaknesses of key industry players. Data is qualitatively analyzed to categorize companies as pure play, category-focused, industry-focused, and diversified; it is quantitatively analyzed to categorize companies as dominant, leading, strong, tentative, and weak.

Recent Development and News in X-ray equipment market

  • In the Health Care Equipment industry, the implementation of stringent data security directives such as GDPR has mandated robust cybersecurity protocols for connected medical devices, directly impacting X-ray Equipment demand by requiring facilities to upgrade to systems with encrypted image transmission, thereby reducing unauthorized data access incidents by 40%.
  • The rapid expansion of ambulatory surgical centers globally has fundamentally decentralized clinical procedures away from centralized hospital campuses, shifting X-ray Equipment procurement toward compact, motorized mobile imaging platforms capable of navigating tight clinical corridors, increasing bedside diagnostic efficiency by 30%.
  • The systemic clinical shift toward minimally invasive interventions for structural heart repairs and endovascular procedures has accelerated the deployment of high-resolution surgical visualization tools, driving X-ray Equipment manufacturers to prioritize multi axis robotic articulation systems that reduce cumulative scatter radiation exposure by 25% for surgical teams.
  • Evolving regulatory premarket approval frameworks enforcing the As Low As Reasonably Achievable principle have compelled medical device manufacturers to integrate advanced copper filtration mechanisms and artificial intelligence-driven exposure controls, accelerating the replacement rate of legacy X-ray Equipment fleets by 15% to ensure strict compliance with patient safety standards.

Dive into Technavio’s robust research methodology, blending expert interviews, extensive data synthesis, and validated models for unparalleled X-Ray Equipment Market insights. See full methodology.

Market Scope
Page number 304
Base year 2025
Historic period 2020-2024
Forecast period 2026-2030
Growth momentum & CAGR Accelerate at a CAGR of 5.9%
Market growth 2026-2030 USD 4290.7 million
Market structure Fragmented
YoY growth 2025-2026(%) 5.7%
Key countries US, Canada, Mexico, Germany, UK, France, Italy, Spain, The Netherlands, China, India, Japan, South Korea, Indonesia, Thailand, Brazil, Saudi Arabia, UAE, Turkey, Argentina, Colombia, South Africa and Israel
Competitive landscape Leading Companies, Market Positioning of Companies, Competitive Strategies, and Industry Risks

Request Free Sample

Research Analyst Overview

  • The X-ray Equipment landscape is undergoing a profound operational transformation driven by the rapid transition from legacy analog setups to highly connected digital radiography solutions. Healthcare executives are increasingly prioritizing strategic boardroom-level investments in automated positioning systems and deep learning image processing to counteract severe staffing shortages and alleviate radiologic technologist burnout.
  • By deploying advanced imaging platforms equipped with cesium iodide scintillators, clinical facilities have achieved a 30% reduction in patient processing time, substantially enhancing departmental operational throughput. Furthermore, the integration of multi axis robotic articulation and dynamic spatial filters into interventional suites allows for continuous real-time visualization during complex endovascular procedures, fundamentally elevating surgical precision.
  • This ongoing hardware digitization directly influences product procurement strategies, compelling medical administrators to balance high initial capital expenditures against long-term gains in quantum detection efficiency and improved patient safety. Ultimately, continuous technological innovation and strict adherence to stringent radiation safety mandates ensure that modern imaging infrastructure remains central to delivering high-quality, cost-effective patient care.

What are the Key Data Covered in this X-Ray Equipment Market Research and Growth Report?

  • What is the expected growth of the X-Ray Equipment Market between 2026 and 2030?

    • USD 4.29 billion, at a CAGR of 5.9%

  • What segmentation does the market report cover?

    • The report is segmented by Technology (Digital, and Analog), End-user (Hospitals, and Diagnostic imaging centers), Application (Radiology or general imaging, Dental, Orthopedics, Cardiology, and Others) and Geography (North America, Europe, Asia, Rest of World (ROW))

  • Which regions are analyzed in the report?

    • North America, Europe, Asia and Rest of World (ROW)

  • What are the key growth drivers and market challenges?

    • AI integration in multifunctional radiography systems, Capital expenditure and rising total cost of ownership

  • Who are the major players in the X-Ray Equipment Market?

    • Agfa Gevaert NV, Allengers Medical Systems Ltd., Canon Inc., Carestream Health Inc., Control X Medical Zrt., Fujifilm Corp., GE HealthCare Technologies, GENORAY Co. Ltd., Hologic Inc., Konica Minolta Inc., Koninklijke Philips NV, Planmeca Oy, Sedecal S.A., Shanghai United Imaging, Shenzhen Mindray Co. Ltd., Shimadzu Corp., Siemens Healthineers AG, Stephanix SAS, Villa Sistemi Medicali Spa and Ziehm Imaging GmbH

Market Research Insights

  • The diagnostic imaging sector is experiencing a profound structural shift as healthcare facilities prioritize agile workflows and precision medicine. Expanding diagnostic imaging volumes are compelling administrators to invest heavily in advanced hybrid operating suites equipped with intelligent imaging architectures. This strategic modernization reduces patient processing times by 25%, directly optimizing resource allocation and clinical turnaround times.
  • Concurrently, the rapid proliferation of ambulatory surgical centers is accelerating the adoption of mobile diagnostic units, enhancing bedside triage efficiency by 30% without requiring costly infrastructure modifications. By effectively managing the total cost of ownership through scalable digital retrofits, medical networks can navigate tightening budgets while maintaining high operational standards and strict regulatory compliance.

We can help! Our analysts can customize this x-ray equipment market research report to meet your requirements.

Get in touch

1. Executive Summary

1.1 Market overview

Executive Summary - Chart on Market Overview
Executive Summary - Data Table on Market Overview
Executive Summary - Chart on Global Market Characteristics
Executive Summary - Chart on Market by Geography
Executive Summary - Chart on Market Segmentation by Technology
Executive Summary - Chart on Market Segmentation by End-user
Executive Summary - Chart on Market Segmentation by Application
Executive Summary - Chart on Incremental Growth
Executive Summary - Data Table on Incremental Growth
Executive Summary - Chart on Company Market Positioning

2. Technavio Analysis

2.1 Analysis of price sensitivity, lifecycle, customer purchase basket, adoption rates, and purchase criteria

2.2 Criticality of inputs and Factors of differentiation

Chart on Overview on criticality of inputs and factors of differentiation

2.3 Factors of disruption

Chart on Overview on factors of disruption

2.4 Impact of drivers and challenges

Chart on Impact of drivers and challenges in 2025 and 2030

3. Market Landscape

3.1 Market ecosystem

Chart on Parent Market
Data Table on - Parent Market

3.2 Market characteristics

Chart on Market characteristics analysis

3.3 Value chain analysis

Chart on Value chain analysis

4. Market Sizing

4.1 Market definition

Data Table on Offerings of companies included in the market definition

4.2 Market segment analysis

Market segments

4.3 Market size 2025

4.4 Market outlook: Forecast for 2025-2030

Chart on Global - Market size and forecast 2025-2030 ($ million)
Data Table on Global - Market size and forecast 2025-2030 ($ million)
Chart on Global Market: Year-over-year growth 2025-2030 (%)
Data Table on Global Market: Year-over-year growth 2025-2030 (%)

5. Historic Market Size

5.1 Global X-Ray Equipment Market 2020 - 2024

Historic Market Size - Data Table on Global X-Ray Equipment Market 2020 - 2024 ($ million)

5.2 Technology segment analysis 2020 - 2024

Historic Market Size - Technology Segment 2020 - 2024 ($ million)

5.3 End-user segment analysis 2020 - 2024

Historic Market Size - End-user Segment 2020 - 2024 ($ million)

5.4 Application segment analysis 2020 - 2024

Historic Market Size - Application Segment 2020 - 2024 ($ million)

5.5 Geography segment analysis 2020 - 2024

Historic Market Size - Geography Segment 2020 - 2024 ($ million)

5.6 Country segment analysis 2020 - 2024

Historic Market Size - Country Segment 2020 - 2024 ($ million)

6. Qualitative Analysis

6.1 Impact of AI on Global X-Ray Equipment Market

6.2 Impact of Geopolitical Conflicts on Global X-Ray Equipment Market

7. Five Forces Analysis

7.1 Five forces summary

Five forces analysis - Comparison between 2025 and 2030

7.2 Bargaining power of buyers

Bargaining power of buyers - Impact of key factors 2025 and 2030

7.3 Bargaining power of suppliers

Bargaining power of suppliers - Impact of key factors in 2025 and 2030

7.4 Threat of new entrants

Threat of new entrants - Impact of key factors in 2025 and 2030

7.5 Threat of substitutes

Threat of substitutes - Impact of key factors in 2025 and 2030

7.6 Threat of rivalry

Threat of rivalry - Impact of key factors in 2025 and 2030

7.7 Market condition

Chart on Market condition - Five forces 2025 and 2030

8. Market Segmentation by Technology

8.1 Market segments

Chart on Technology - Market share 2025-2030 (%)
Data Table on Technology - Market share 2025-2030 (%)

8.2 Comparison by Technology

Chart on Comparison by Technology
Data Table on Comparison by Technology

8.3 Digital - Market size and forecast 2025-2030

Chart on Digital - Market size and forecast 2025-2030 ($ million)
Data Table on Digital - Market size and forecast 2025-2030 ($ million)
Chart on Digital - Year-over-year growth 2025-2030 (%)
Data Table on Digital - Year-over-year growth 2025-2030 (%)

8.4 Analog - Market size and forecast 2025-2030

Chart on Analog - Market size and forecast 2025-2030 ($ million)
Data Table on Analog - Market size and forecast 2025-2030 ($ million)
Chart on Analog - Year-over-year growth 2025-2030 (%)
Data Table on Analog - Year-over-year growth 2025-2030 (%)

8.5 Market opportunity by Technology

Market opportunity by Technology ($ million)
Data Table on Market opportunity by Technology ($ million)

9. Market Segmentation by End-user

9.1 Market segments

Chart on End-user - Market share 2025-2030 (%)
Data Table on End-user - Market share 2025-2030 (%)

9.2 Comparison by End-user

Chart on Comparison by End-user
Data Table on Comparison by End-user

9.3 Hospitals - Market size and forecast 2025-2030

Chart on Hospitals - Market size and forecast 2025-2030 ($ million)
Data Table on Hospitals - Market size and forecast 2025-2030 ($ million)
Chart on Hospitals - Year-over-year growth 2025-2030 (%)
Data Table on Hospitals - Year-over-year growth 2025-2030 (%)

9.4 Diagnostic imaging centers - Market size and forecast 2025-2030

Chart on Diagnostic imaging centers - Market size and forecast 2025-2030 ($ million)
Data Table on Diagnostic imaging centers - Market size and forecast 2025-2030 ($ million)
Chart on Diagnostic imaging centers - Year-over-year growth 2025-2030 (%)
Data Table on Diagnostic imaging centers - Year-over-year growth 2025-2030 (%)

9.5 Market opportunity by End-user

Market opportunity by End-user ($ million)
Data Table on Market opportunity by End-user ($ million)

10. Market Segmentation by Application

10.1 Market segments

Chart on Application - Market share 2025-2030 (%)
Data Table on Application - Market share 2025-2030 (%)

10.2 Comparison by Application

Chart on Comparison by Application
Data Table on Comparison by Application

10.3 Radiology or general imaging - Market size and forecast 2025-2030

Chart on Radiology or general imaging - Market size and forecast 2025-2030 ($ million)
Data Table on Radiology or general imaging - Market size and forecast 2025-2030 ($ million)
Chart on Radiology or general imaging - Year-over-year growth 2025-2030 (%)
Data Table on Radiology or general imaging - Year-over-year growth 2025-2030 (%)

10.4 Dental - Market size and forecast 2025-2030

Chart on Dental - Market size and forecast 2025-2030 ($ million)
Data Table on Dental - Market size and forecast 2025-2030 ($ million)
Chart on Dental - Year-over-year growth 2025-2030 (%)
Data Table on Dental - Year-over-year growth 2025-2030 (%)

10.5 Orthopedics - Market size and forecast 2025-2030

Chart on Orthopedics - Market size and forecast 2025-2030 ($ million)
Data Table on Orthopedics - Market size and forecast 2025-2030 ($ million)
Chart on Orthopedics - Year-over-year growth 2025-2030 (%)
Data Table on Orthopedics - Year-over-year growth 2025-2030 (%)

10.6 Cardiology - Market size and forecast 2025-2030

Chart on Cardiology - Market size and forecast 2025-2030 ($ million)
Data Table on Cardiology - Market size and forecast 2025-2030 ($ million)
Chart on Cardiology - Year-over-year growth 2025-2030 (%)
Data Table on Cardiology - Year-over-year growth 2025-2030 (%)

10.7 Others - Market size and forecast 2025-2030

Chart on Others - Market size and forecast 2025-2030 ($ million)
Data Table on Others - Market size and forecast 2025-2030 ($ million)
Chart on Others - Year-over-year growth 2025-2030 (%)
Data Table on Others - Year-over-year growth 2025-2030 (%)

10.8 Market opportunity by Application

Market opportunity by Application ($ million)
Data Table on Market opportunity by Application ($ million)

11. Customer Landscape

11.1 Customer landscape overview

Analysis of price sensitivity, lifecycle, customer purchase basket, adoption rates, and purchase criteria

12. Geographic Landscape

12.1 Geographic segmentation

Chart on Market share by geography 2025-2030 (%)
Data Table on Market share by geography 2025-2030 (%)

12.2 Geographic comparison

Chart on Geographic comparison
Data Table on Geographic comparison

12.3 North America - Market size and forecast 2025-2030

Chart on North America - Market size and forecast 2025-2030 ($ million)
Data Table on North America - Market size and forecast 2025-2030 ($ million)
Chart on North America - Year-over-year growth 2025-2030 (%)
Data Table on North America - Year-over-year growth 2025-2030 (%)
Chart on Regional Comparison - North America
Data Table on Regional Comparison - North America

12.3.1 US - Market size and forecast 2025-2030

Chart on US - Market size and forecast 2025-2030 ($ million)
Data Table on US - Market size and forecast 2025-2030 ($ million)
Chart on US - Year-over-year growth 2025-2030 (%)
Data Table on US - Year-over-year growth 2025-2030 (%)

12.3.2 Canada - Market size and forecast 2025-2030

Chart on Canada - Market size and forecast 2025-2030 ($ million)
Data Table on Canada - Market size and forecast 2025-2030 ($ million)
Chart on Canada - Year-over-year growth 2025-2030 (%)
Data Table on Canada - Year-over-year growth 2025-2030 (%)

12.3.3 Mexico - Market size and forecast 2025-2030

Chart on Mexico - Market size and forecast 2025-2030 ($ million)
Data Table on Mexico - Market size and forecast 2025-2030 ($ million)
Chart on Mexico - Year-over-year growth 2025-2030 (%)
Data Table on Mexico - Year-over-year growth 2025-2030 (%)

12.4 Europe - Market size and forecast 2025-2030

Chart on Europe - Market size and forecast 2025-2030 ($ million)
Data Table on Europe - Market size and forecast 2025-2030 ($ million)
Chart on Europe - Year-over-year growth 2025-2030 (%)
Data Table on Europe - Year-over-year growth 2025-2030 (%)
Chart on Regional Comparison - Europe
Data Table on Regional Comparison - Europe

12.4.1 Germany - Market size and forecast 2025-2030

Chart on Germany - Market size and forecast 2025-2030 ($ million)
Data Table on Germany - Market size and forecast 2025-2030 ($ million)
Chart on Germany - Year-over-year growth 2025-2030 (%)
Data Table on Germany - Year-over-year growth 2025-2030 (%)

12.4.2 UK - Market size and forecast 2025-2030

Chart on UK - Market size and forecast 2025-2030 ($ million)
Data Table on UK - Market size and forecast 2025-2030 ($ million)
Chart on UK - Year-over-year growth 2025-2030 (%)
Data Table on UK - Year-over-year growth 2025-2030 (%)

12.4.3 France - Market size and forecast 2025-2030

Chart on France - Market size and forecast 2025-2030 ($ million)
Data Table on France - Market size and forecast 2025-2030 ($ million)
Chart on France - Year-over-year growth 2025-2030 (%)
Data Table on France - Year-over-year growth 2025-2030 (%)

12.4.4 Italy - Market size and forecast 2025-2030

Chart on Italy - Market size and forecast 2025-2030 ($ million)
Data Table on Italy - Market size and forecast 2025-2030 ($ million)
Chart on Italy - Year-over-year growth 2025-2030 (%)
Data Table on Italy - Year-over-year growth 2025-2030 (%)

12.4.5 Spain - Market size and forecast 2025-2030

Chart on Spain - Market size and forecast 2025-2030 ($ million)
Data Table on Spain - Market size and forecast 2025-2030 ($ million)
Chart on Spain - Year-over-year growth 2025-2030 (%)
Data Table on Spain - Year-over-year growth 2025-2030 (%)

12.4.6 The Netherlands - Market size and forecast 2025-2030

Chart on The Netherlands - Market size and forecast 2025-2030 ($ million)
Data Table on The Netherlands - Market size and forecast 2025-2030 ($ million)
Chart on The Netherlands - Year-over-year growth 2025-2030 (%)
Data Table on The Netherlands - Year-over-year growth 2025-2030 (%)

12.5 Asia - Market size and forecast 2025-2030

Chart on Asia - Market size and forecast 2025-2030 ($ million)
Data Table on Asia - Market size and forecast 2025-2030 ($ million)
Chart on Asia - Year-over-year growth 2025-2030 (%)
Data Table on Asia - Year-over-year growth 2025-2030 (%)
Chart on Regional Comparison - Asia
Data Table on Regional Comparison - Asia

12.5.1 China - Market size and forecast 2025-2030

Chart on China - Market size and forecast 2025-2030 ($ million)
Data Table on China - Market size and forecast 2025-2030 ($ million)
Chart on China - Year-over-year growth 2025-2030 (%)
Data Table on China - Year-over-year growth 2025-2030 (%)

12.5.2 India - Market size and forecast 2025-2030

Chart on India - Market size and forecast 2025-2030 ($ million)
Data Table on India - Market size and forecast 2025-2030 ($ million)
Chart on India - Year-over-year growth 2025-2030 (%)
Data Table on India - Year-over-year growth 2025-2030 (%)

12.5.3 Japan - Market size and forecast 2025-2030

Chart on Japan - Market size and forecast 2025-2030 ($ million)
Data Table on Japan - Market size and forecast 2025-2030 ($ million)
Chart on Japan - Year-over-year growth 2025-2030 (%)
Data Table on Japan - Year-over-year growth 2025-2030 (%)

12.5.4 South Korea - Market size and forecast 2025-2030

Chart on South Korea - Market size and forecast 2025-2030 ($ million)
Data Table on South Korea - Market size and forecast 2025-2030 ($ million)
Chart on South Korea - Year-over-year growth 2025-2030 (%)
Data Table on South Korea - Year-over-year growth 2025-2030 (%)

12.5.5 Indonesia - Market size and forecast 2025-2030

Chart on Indonesia - Market size and forecast 2025-2030 ($ million)
Data Table on Indonesia - Market size and forecast 2025-2030 ($ million)
Chart on Indonesia - Year-over-year growth 2025-2030 (%)
Data Table on Indonesia - Year-over-year growth 2025-2030 (%)

12.5.6 Thailand - Market size and forecast 2025-2030

Chart on Thailand - Market size and forecast 2025-2030 ($ million)
Data Table on Thailand - Market size and forecast 2025-2030 ($ million)
Chart on Thailand - Year-over-year growth 2025-2030 (%)
Data Table on Thailand - Year-over-year growth 2025-2030 (%)

12.6 Rest of World (ROW) - Market size and forecast 2025-2030

Chart on Rest of World (ROW) - Market size and forecast 2025-2030 ($ million)
Data Table on Rest of World (ROW) - Market size and forecast 2025-2030 ($ million)
Chart on Rest of World (ROW) - Year-over-year growth 2025-2030 (%)
Data Table on Rest of World (ROW) - Year-over-year growth 2025-2030 (%)
Chart on Regional Comparison - Rest of World (ROW)
Data Table on Regional Comparison - Rest of World (ROW)

12.6.1 Brazil - Market size and forecast 2025-2030

Chart on Brazil - Market size and forecast 2025-2030 ($ million)
Data Table on Brazil - Market size and forecast 2025-2030 ($ million)
Chart on Brazil - Year-over-year growth 2025-2030 (%)
Data Table on Brazil - Year-over-year growth 2025-2030 (%)

12.6.2 Saudi Arabia - Market size and forecast 2025-2030

Chart on Saudi Arabia - Market size and forecast 2025-2030 ($ million)
Data Table on Saudi Arabia - Market size and forecast 2025-2030 ($ million)
Chart on Saudi Arabia - Year-over-year growth 2025-2030 (%)
Data Table on Saudi Arabia - Year-over-year growth 2025-2030 (%)

12.6.3 UAE - Market size and forecast 2025-2030

Chart on UAE - Market size and forecast 2025-2030 ($ million)
Data Table on UAE - Market size and forecast 2025-2030 ($ million)
Chart on UAE - Year-over-year growth 2025-2030 (%)
Data Table on UAE - Year-over-year growth 2025-2030 (%)

12.6.4 Turkey - Market size and forecast 2025-2030

Chart on Turkey - Market size and forecast 2025-2030 ($ million)
Data Table on Turkey - Market size and forecast 2025-2030 ($ million)
Chart on Turkey - Year-over-year growth 2025-2030 (%)
Data Table on Turkey - Year-over-year growth 2025-2030 (%)

12.6.5 Argentina - Market size and forecast 2025-2030

Chart on Argentina - Market size and forecast 2025-2030 ($ million)
Data Table on Argentina - Market size and forecast 2025-2030 ($ million)
Chart on Argentina - Year-over-year growth 2025-2030 (%)
Data Table on Argentina - Year-over-year growth 2025-2030 (%)

12.6.6 Colombia - Market size and forecast 2025-2030

Chart on Colombia - Market size and forecast 2025-2030 ($ million)
Data Table on Colombia - Market size and forecast 2025-2030 ($ million)
Chart on Colombia - Year-over-year growth 2025-2030 (%)
Data Table on Colombia - Year-over-year growth 2025-2030 (%)

12.6.7 South Africa - Market size and forecast 2025-2030

Chart on South Africa - Market size and forecast 2025-2030 ($ million)
Data Table on South Africa - Market size and forecast 2025-2030 ($ million)
Chart on South Africa - Year-over-year growth 2025-2030 (%)
Data Table on South Africa - Year-over-year growth 2025-2030 (%)

12.6.8 Israel - Market size and forecast 2025-2030

Chart on Israel - Market size and forecast 2025-2030 ($ million)
Data Table on Israel - Market size and forecast 2025-2030 ($ million)
Chart on Israel - Year-over-year growth 2025-2030 (%)
Data Table on Israel - Year-over-year growth 2025-2030 (%)

12.7 Market opportunity by geography

Market opportunity by geography ($ million)
Data Tables on Market opportunity by geography ($ million)

13. Drivers, Challenges, and Opportunity

13.1 Market drivers

AI integration in multifunctional radiography systems
Rising chronic disease burden and geriatric population
Rising demand for interventional fluoroscopy and mobile C-arms

13.2 Market challenges

Capital expenditure and rising total cost of ownership
Radiologic technologist shortages and operational staff burnout
Regulatory compliance and radiation safety mandates

13.3 Impact of drivers and challenges

Impact of drivers and challenges in 2025 and 2030

13.4 Market opportunities

Growth of decentralized and ambulatory care facilities
Growth of image-guided interventions and robotic x-ray platforms
Advanced cesium detectors and digital retrofit solutions

14. Competitive Landscape

14.1 Overview

14.2

Overview on criticality of inputs and factors of differentiation

14.3 Landscape disruption

Overview on factors of disruption

14.4 Industry risks

Impact of key risks on business

15. Competitive Analysis

15.1 Companies profiled

Companies covered

15.2 Company ranking index

15.3 Market positioning of companies

Matrix on companies position and classification

15.4 Agfa Gevaert NV

Agfa Gevaert NV - Overview
Agfa Gevaert NV - Business segments
Agfa Gevaert NV - Key offerings
Agfa Gevaert NV - Segment focus
SWOT

15.5 Canon Inc.

Canon Inc. - Overview
Canon Inc. - Business segments
Canon Inc. - Key offerings
Canon Inc. - Segment focus
SWOT

15.6 Carestream Health Inc.

Carestream Health Inc. - Overview
Carestream Health Inc. - Product / Service
Carestream Health Inc. - Key offerings
SWOT

15.7 Fujifilm Corp.

Fujifilm Corp. - Overview
Fujifilm Corp. - Business segments
Fujifilm Corp. - Key offerings
Fujifilm Corp. - Segment focus
SWOT

15.8 GE HealthCare Technologies

GE HealthCare Technologies - Overview
GE HealthCare Technologies - Business segments
GE HealthCare Technologies - Key news
GE HealthCare Technologies - Key offerings
GE HealthCare Technologies - Segment focus
SWOT

15.9 GENORAY Co. Ltd.

GENORAY Co. Ltd. - Overview
GENORAY Co. Ltd. - Product / Service
GENORAY Co. Ltd. - Key offerings
SWOT

15.10 Hologic Inc.

Hologic Inc. - Overview
Hologic Inc. - Product / Service
Hologic Inc. - Key offerings
SWOT

15.11 Konica Minolta Inc.

Konica Minolta Inc. - Overview
Konica Minolta Inc. - Business segments
Konica Minolta Inc. - Key offerings
Konica Minolta Inc. - Segment focus
SWOT

15.12 Koninklijke Philips NV

Koninklijke Philips NV - Overview
Koninklijke Philips NV - Business segments
Koninklijke Philips NV - Key news
Koninklijke Philips NV - Key offerings
Koninklijke Philips NV - Segment focus
SWOT

15.13 Planmeca Oy

Planmeca Oy - Overview
Planmeca Oy - Product / Service
Planmeca Oy - Key offerings
SWOT

15.14 Sedecal S.A.

Sedecal S.A. - Overview
Sedecal S.A. - Product / Service
Sedecal S.A. - Key offerings
SWOT

15.15 Shanghai United Imaging

Shanghai United Imaging - Overview
Shanghai United Imaging - Product / Service
Shanghai United Imaging - Key offerings
SWOT

15.16 Shenzhen Mindray Co. Ltd.

Shenzhen Mindray Co. Ltd. - Overview
Shenzhen Mindray Co. Ltd. - Business segments
Shenzhen Mindray Co. Ltd. - Key offerings
Shenzhen Mindray Co. Ltd. - Segment focus
SWOT

15.17 Shimadzu Corp.

Shimadzu Corp. - Overview
Shimadzu Corp. - Business segments
Shimadzu Corp. - Key offerings
Shimadzu Corp. - Segment focus
SWOT

15.18 Siemens Healthineers AG

Siemens Healthineers AG - Overview
Siemens Healthineers AG - Business segments
Siemens Healthineers AG - Key offerings
Siemens Healthineers AG - Segment focus
SWOT

16. Appendix

16.1 Scope of the report

Market definition
Objectives
Notes and caveats

16.2 Inclusions and exclusions checklist

Inclusions checklist
Exclusions checklist

16.3 Currency conversion rates for US$

16.4 Research methodology

16.5 Data procurement

Information sources

16.6 Data validation

16.7 Validation techniques employed for market sizing

16.8 Data synthesis

16.9 360 degree market analysis

16.10 List of abbreviations

Research Methodology

Technavio presents a detailed picture of the market by way of study, synthesis, and summation of data from multiple sources. The analysts have presented the various facets of the market with a particular focus on identifying the key industry influencers. The data thus presented is comprehensive, reliable, and the result of extensive research, both primary and secondary.

INFORMATION SOURCES

Primary sources

  • Manufacturers and suppliers
  • Channel partners
  • Industry experts
  • Strategic decision makers

Secondary sources

  • Industry journals and periodicals
  • Government data
  • Financial reports of key industry players
  • Historical data
  • Press releases

DATA ANALYSIS

Data Synthesis

  • Collation of data
  • Estimation of key figures
  • Analysis of derived insights

Data Validation

  • Triangulation with data models
  • Reference against proprietary databases
  • Corroboration with industry experts

REPORT WRITING

Qualitative

  • Market drivers
  • Market challenges
  • Market trends
  • Five forces analysis

Quantitative

  • Market size and forecast
  • Market segmentation
  • Geographical insights
  • Competitive landscape

Interested in this report?

Get your sample now to see our research methodology and insights!

Download Now

Frequently Asked Questions

X-Ray Equipment market growth will increase by USD 4290.7 million during 2026-2030.

The X-Ray Equipment market is expected to grow at a CAGR of 5.9% during 2026-2030.

X-Ray Equipment market is segmented by Technology (Digital, Analog) End-user (Hospitals, Diagnostic imaging centers) Application (Radiology or general imaging, Dental, Orthopedics, Cardiology, Others)

Agfa Gevaert NV, Allengers Medical Systems Ltd., Canon Inc., Carestream Health Inc., Control X Medical Zrt., Fujifilm Corp., GE HealthCare Technologies, GENORAY Co. Ltd., Hologic Inc., Konica Minolta Inc., Koninklijke Philips NV, Planmeca Oy, Sedecal S.A., Shanghai United Imaging, Shenzhen Mindray Co. Ltd., Shimadzu Corp., Siemens Healthineers AG, Stephanix SAS, Villa Sistemi Medicali Spa, Ziehm Imaging GmbH are a few of the key vendors in the X-Ray Equipment market.

North America will register the highest growth rate of 37.7% among the other regions. Therefore, the X-Ray Equipment market in North America is expected to garner significant business opportunities for the vendors during the forecast period.

US, Canada, Mexico, Germany, UK, France, Italy, Spain, The Netherlands, China, India, Japan, South Korea, Indonesia, Thailand, Brazil, Saudi Arabia, UAE, Turkey, Argentina, Colombia, South Africa, Israel

  • AI integration in multifunctional radiography systems is the driving factor this market.

The X-Ray Equipment market vendors should focus on grabbing business opportunities from the Technology segment as it accounted for the largest market share in the base year.
RIA - Research AI Assistant
Ask RIA