Workforce Management Software Market Analysis, Size, and Forecast 2026-2030: North America (US, Canada, and Mexico), Europe (Germany, UK, and France), APAC (China, Japan, and India), Middle East and Africa (Saudi Arabia, UAE, and South Africa), South America (Brazil, Argentina, and Colombia), and Rest of World (ROW)

Workforce Management Software Market Analysis, Size, and Forecast 2026-2030:
North America (US, Canada, and Mexico), Europe (Germany, UK, and France), APAC (China, Japan, and India), Middle East and Africa (Saudi Arabia, UAE, and South Africa), South America (Brazil, Argentina, and Colombia), and Rest of World (ROW)

Published: May 2026 300 Pages SKU: IRTNTR44428

Market Overview at a Glance

$4.03 B
Market Opportunity
8.5%
CAGR 2025 - 2030
38.1%
North America Growth
$1.74 B
IT and telecom segment 2024

Workforce Management Software Market Size 2026-2030

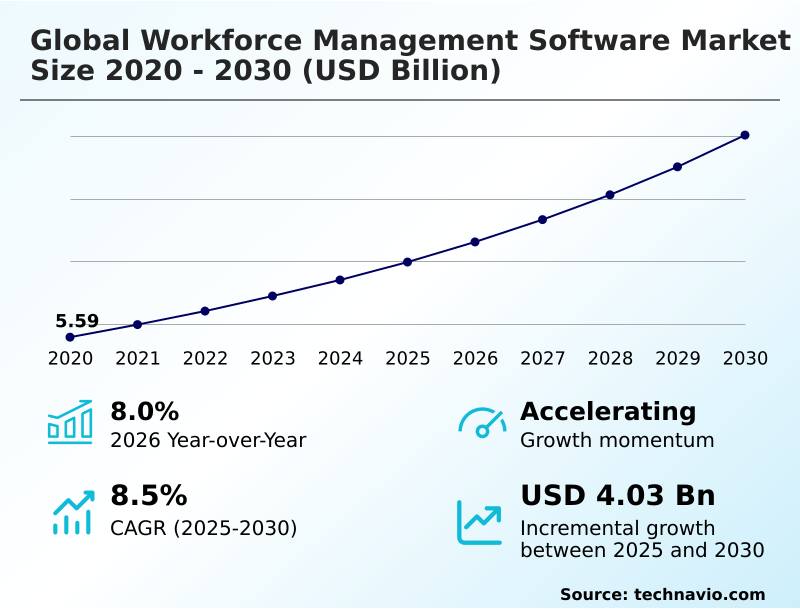
The workforce management software market size is valued to increase by USD 4.03 billion, at a CAGR of 8.5% from 2025 to 2030. Strategic imperative of labor cost optimization and regulatory compliance will drive the workforce management software market.

Major Market Trends & Insights

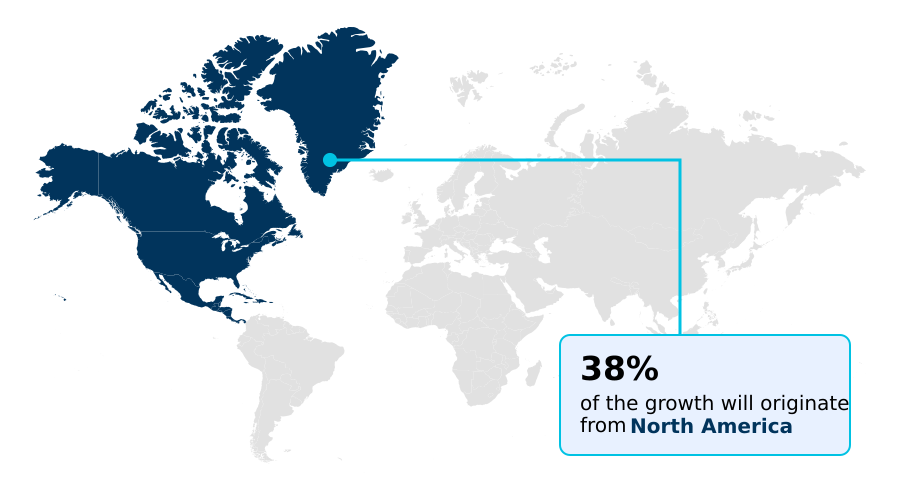
  • North America dominated the market and accounted for a 38.1% growth during the forecast period.
  • By End-user - IT and telecom segment was valued at USD 1.74 billion in 2024
  • By Deployment - Cloud based segment accounted for the largest market revenue share in 2024

Market Size & Forecast

  • Market Opportunities: USD 6.43 billion
  • Market Future Opportunities: USD 4.03 billion
  • CAGR from 2025 to 2030 : 8.5%

Market Summary

  • The workforce management software market is fundamentally shifting from a transactional toolset to a strategic business asset, driven by the dual needs for enhanced operational efficiency and complex labor compliance. Modern platforms are integrating AI-powered forecasting tools and predictive analytics for labor to align staffing precisely with operational demands, moving beyond simple time and attendance tracking.
  • For instance, a global logistics firm can leverage demand-driven scheduling to optimize routes and staffing across multiple distribution centers, achieving a 15% reduction in overtime costs while ensuring adherence to fair workweek ordinances. This evolution is accelerated by the widespread adoption of hybrid work, demanding robust mobile accessibility and tools for project-based time tracking.
  • Consequently, organizations are investing in unified cloud-based workforce management solutions that provide a single source of unified workforce data, turning strategic human capital management into a significant competitive differentiator in a dynamic global economy.

What will be the Size of the Workforce Management Software Market during the forecast period?

Get Key Insights on Market Forecast (PDF) Get Free Sample

How is the Workforce Management Software Market Segmented?

The workforce management software industry research report provides comprehensive data (region-wise segment analysis), with forecasts and estimates in "USD million" for the period 2026-2030, as well as historical data from 2020-2024 for the following segments.

  • End-user
    • IT and telecom
    • BFSI
    • Healthcare
    • Manufacturing
    • Others
  • Deployment
    • Cloud based
    • On-premises
  • Component
    • Software
    • Services
  • Geography
    • North America
      • US
      • Canada
      • Mexico
    • Europe
      • Germany
      • UK
      • France
    • APAC
      • China
      • Japan
      • India
    • Middle East and Africa
      • Saudi Arabia
      • UAE
      • South Africa
    • South America
      • Brazil
      • Argentina
      • Colombia
    • Rest of World (ROW)

By End-user Insights

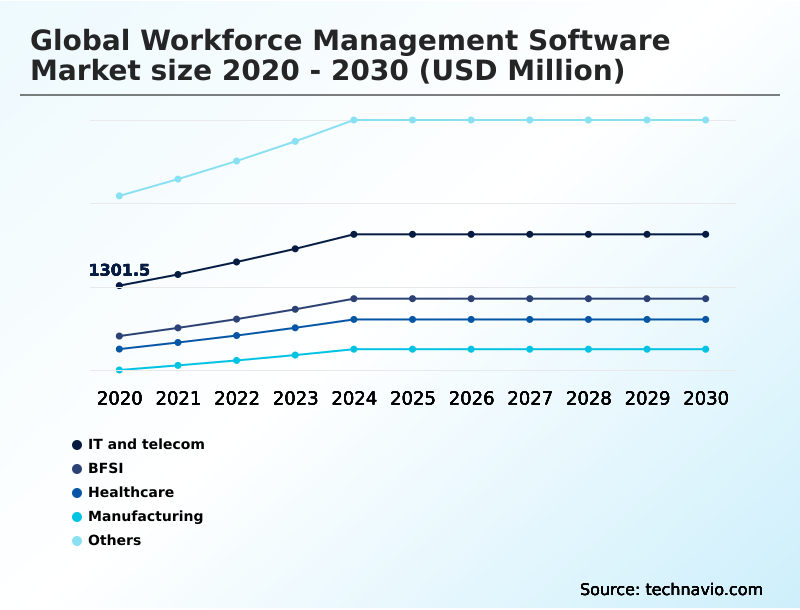
The it and telecom segment is estimated to witness significant growth during the forecast period.

The IT and telecom sector requires workforce management solutions focused on optimizing resource allocation and managing agile project timelines.

Effective project-based time tracking is essential for this project-based environment, where platforms must support skills matrices and certification tracking to align specialized personnel with complex tasks.

The drive towards a human-centric approach and digital transformation in HR is fueling demand for industry-specific solutions that facilitate seamless collaboration among remote teams.

Agile workforce management depends on mobile accessibility and robust integration with existing project management tools and integrated enterprise ecosystems.

These systems provide real-time visibility into productivity, with analytics showing a 20% improvement in task completion rates for teams using specialized platforms.

Get Free Sample

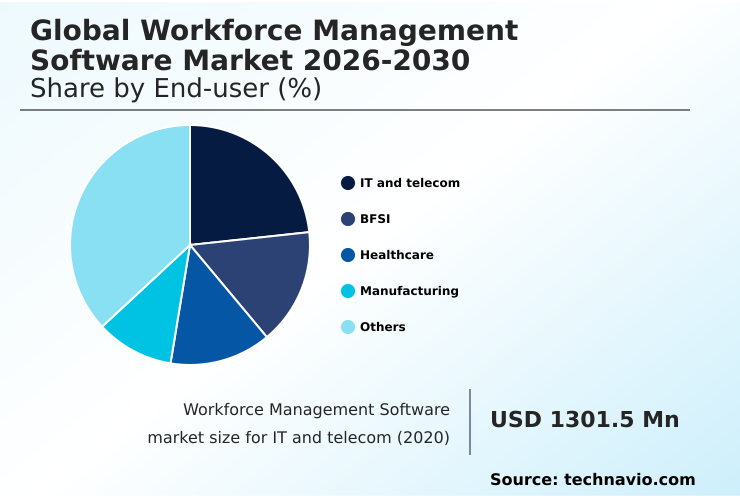
The IT and telecom segment was valued at USD 1.74 billion in 2024 and showed a gradual increase during the forecast period.

Get Free Sample

Regional Analysis

North America is estimated to contribute 38.1% to the growth of the global market during the forecast period.Technavio’s analysts have elaborately explained the regional trends and drivers that shape the market during the forecast period.

See How Workforce Management Software Market Demand is Rising in North America Get Free Sample

The workforce management software market exhibits distinct regional dynamics, with North America leading in incremental growth, contributing 38.1% of the market's expansion.

This maturity is driven by a focus on integrating AI-powered forecasting tools and advanced workforce optimization tools to manage complex labor laws.

Europe follows, with a strong emphasis on data sovereignty and compliance, necessitating sophisticated employee scheduling and time and attendance tracking capabilities.

The APAC region is the fastest-growing, fueled by widespread digitalization and a mobile-first workforce, which increases demand for accessible task management and labor forecasting solutions.

Across all regions, predictive analytics for labor is becoming essential, as businesses using such tools report a 15% improvement in staffing accuracy. The need for a unified workforce data view to support employee sentiment monitoring is a global constant.

Market Dynamics

Our researchers analyzed the data with 2025 as the base year, along with the key drivers, trends, and challenges. A holistic analysis of drivers will help companies refine their marketing strategies to gain a competitive advantage.

  • Organizations are increasingly adopting software for managing hybrid work models to navigate the complexities of a distributed workforce, demanding robust time tracking software for remote employees. In the retail sector, the use of AI in workforce management for retail is becoming standard practice for optimizing staffing based on real-time foot traffic, significantly reducing labor costs with scheduling software.
  • Similarly, the healthcare industry relies on compliance automation for healthcare scheduling to manage intricate staffing rules and credentials. A key challenge remains the workforce management integration with ERP systems, as seamless data flow is critical for accurate reporting and planning. Businesses are exploring wfm software for manufacturing shift patterns and managing contingent workers with a wfm platform to enhance flexibility.
  • Furthermore, improving employee engagement with wfm tools through features like an employee self service portal benefits both workers and employers. The integration of earned wage access integration in payroll is also a powerful retention tool. Effective mobile workforce management for field services and insightful workforce analytics for productivity insights provide a competitive edge.
  • Adhering to best practices for workforce optimization, including implementing role based access control implementation and robust biometric time clock security features, is paramount. Platforms must handle automating overtime calculation rules and skills tracking for project resource allocation, especially for a wfm platform for multi-location businesses, which report up to a 25% greater scheduling efficiency than those using disparate systems.

What are the key market drivers leading to the rise in the adoption of Workforce Management Software Industry?

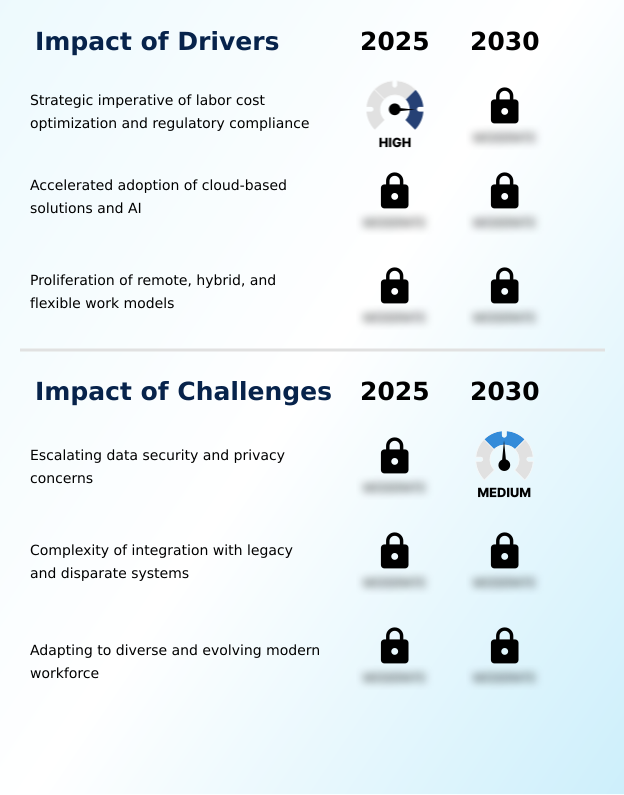
  • A primary market driver is the strategic imperative for organizations to optimize labor costs while navigating increasingly complex regulatory compliance requirements globally.

  • The strategic imperative of labor cost optimization remains a primary driver, compelling organizations to adopt systems capable of sophisticated demand-driven scheduling and precise overtime calculations.
  • AI-powered forecasting tools are central to this, improving forecast accuracy by over 30% in volatile sectors like retail. Simultaneously, navigating complex regulations, including fair workweek ordinances, necessitates solutions with robust automated compliance monitoring.
  • This focus on compliance management mitigates significant financial and reputational risks. The shift to flexible work models has made strategic human capital management a priority, with platforms that enhance workforce productivity showing higher adoption.
  • These systems deliver tangible operational efficiency gains, turning workforce management from a cost center into a strategic enabler of business agility.

What are the market trends shaping the Workforce Management Software Industry?

  • A defining market trend is the deep integration of embedded AI and hyper-automation. This transforms platforms into proactive, intelligent decision-making engines.

  • A defining market trend is the move toward hyper-automation, where generative AI copilot tools and intelligent self-service options are transforming user experiences. This shift prioritizes talent management by empowering employees with greater control through automated shift swapping and robust employee self-service tools.
  • The convergence with financial wellness is evident, with on-demand pay and earned wage access becoming key differentiators, improving retention by up to 20%. Workforce analytics are also becoming more predictive, with platforms leveraging machine learning for predictive scheduling and leave management forecasting.
  • This evolution allows managers to move from reactive administration to strategic workforce planning, with some systems demonstrating a 25% reduction in manual scheduling adjustments.

What challenges does the Workforce Management Software Industry face during its growth?

  • A primary challenge affecting market growth is the escalating complexity of data security and privacy concerns amid a stringent and fragmented global regulatory landscape.

  • A significant challenge is the complexity of integrating new cloud-based workforce management software with legacy enterprise systems, which can hinder the creation of a unified human capital management platform. Ensuring data security for sensitive information, such as biometric data for time clocks, and maintaining role-based access controls across disparate applications is a primary concern.
  • The demand for real-time demand forecasts requires seamless payroll integration and activity logging from multiple sources. Furthermore, adapting to a diverse global workforce necessitates advanced global workforce planning and mobile-first interfaces that cater to various roles and regulations.
  • The difficulty in synchronizing data for absence management can lead to inaccuracies, with studies showing integration issues cause up to a 10% error rate in initial payroll runs.

Exclusive Technavio Analysis on Customer Landscape

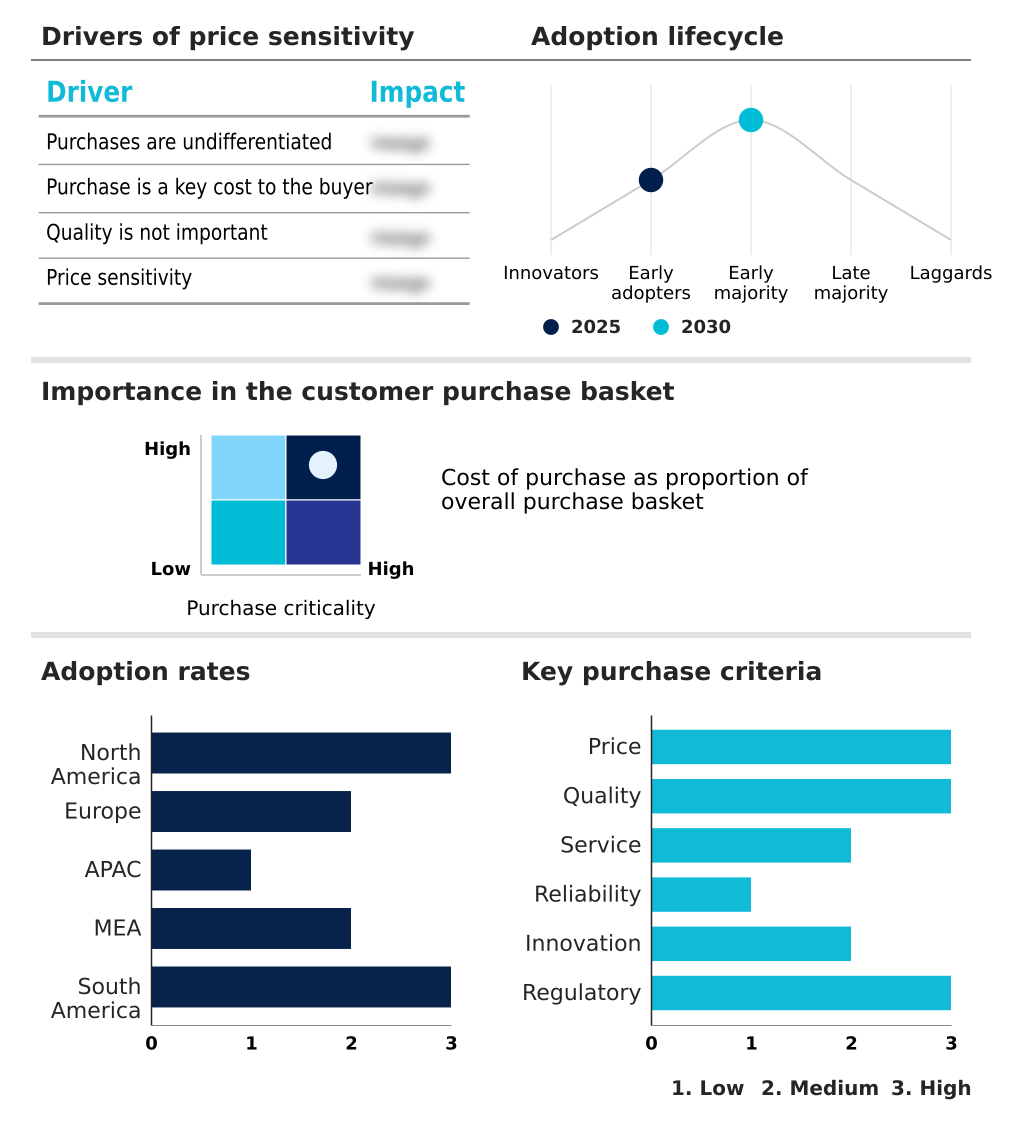
The workforce management software market forecasting report includes the adoption lifecycle of the market, covering from the innovator’s stage to the laggard’s stage. It focuses on adoption rates in different regions based on penetration. Furthermore, the workforce management software market report also includes key purchase criteria and drivers of price sensitivity to help companies evaluate and develop their market growth analysis strategies.

Customer Landscape of Workforce Management Software Industry

Competitive Landscape

Companies are implementing various strategies, such as strategic alliances, workforce management software market forecast, partnerships, mergers and acquisitions, geographical expansion, and product/service launches, to enhance their presence in the industry.

Automatic Data Processing Inc. - Solutions feature integrated time tracking, scheduling, payroll, and compliance management within comprehensive platforms like ADP Workforce Now, enhancing workforce analytics and efficiency.

The industry research and growth report includes detailed analyses of the competitive landscape of the market and information about key companies, including:

  • Automatic Data Processing Inc.
  • Blue Yonder Group Inc.
  • Cornerstone OnDemand Inc.
  • Dayforce Inc.
  • Deputechnologies Pty Ltd.
  • Infor Inc.
  • Legion Technologies Inc.
  • NICE Ltd.
  • Oracle Corp.
  • Papaya Global Ltd.
  • Paycor HCM Inc.
  • PTC Inc.
  • SAP SE
  • TimeClock Plus LLC
  • UKG Inc.
  • Verint Systems Inc.
  • Workday Inc.
  • WorkForce Software LLC
  • Zebra Technologies Corp.
  • Zoho Corp. Pvt. Ltd.

Qualitative and quantitative analysis of companies has been conducted to help clients understand the wider business environment as well as the strengths and weaknesses of key industry players. Data is qualitatively analyzed to categorize companies as pure play, category-focused, industry-focused, and diversified; it is quantitatively analyzed to categorize companies as dominant, leading, strong, tentative, and weak.

Recent Development and News in Workforce management software market

  • In May, 2025, the Canadian government enacted the Advanced Digital Privacy Act, which imposes stringent data residency and consent management requirements on companies handling citizen data.
  • In March, 2025, Dayforce's acquisition by the private equity firm Thoma Bravo was finalized, a move expected to accelerate the company's growth in AI-driven workforce management solutions.
  • In January, 2025, Workday announced the launch of its Workday EU Sovereign Cloud to meet the specific data residency and compliance needs of its European clients.
  • In November, 2024, UKG unveiled its UKG Pro Workforce Intelligence Hub, an AI-driven platform designed to provide a real-time, unified view of all workforce data.

Dive into Technavio’s robust research methodology, blending expert interviews, extensive data synthesis, and validated models for unparalleled Workforce Management Software Market insights. See full methodology.

Market Scope
Page number 300
Base year 2025
Historic period 2020-2024
Forecast period 2026-2030
Growth momentum & CAGR Accelerate at a CAGR of 8.5%
Market growth 2026-2030 USD 4032.6 million
Market structure Fragmented
YoY growth 2025-2026(%) 8.0%
Key countries US, Canada, Mexico, Germany, UK, France, Italy, Spain, The Netherlands, China, Japan, India, Australia, South Korea, Indonesia, Saudi Arabia, UAE, South Africa, Israel, Turkey, Brazil, Argentina and Colombia
Competitive landscape Leading Companies, Market Positioning of Companies, Competitive Strategies, and Industry Risks

Request Free Sample

Research Analyst Overview

  • The workforce management software market is defined by its deep integration into core business operations, moving beyond basic employee scheduling and time and attendance tracking. Advanced platforms now serve as central hubs for workforce analytics and labor forecasting, enabling data-driven resource allocation.
  • A key boardroom-level driver is compliance management, where automated systems mitigate risks associated with complex labor laws, incorporating overtime calculations, absence management, and leave management rules directly. The focus on workforce productivity is pushing innovation in demand-driven scheduling and real-time task management.
  • For instance, businesses leveraging integrated talent management and skills matrices within their WFM systems report a 15% faster deployment of qualified personnel to critical projects. The technology now includes sophisticated activity logging, role-based access controls, and support for biometric data for time clocks to enhance security.
  • Seamless payroll integration, project-based time tracking, and automated shift swapping are standard expectations, while certification tracking and mobile accessibility are critical for specialized and distributed workforces, ultimately achieving significant labor cost optimization.

What are the Key Data Covered in this Workforce Management Software Market Research and Growth Report?

  • What is the expected growth of the Workforce Management Software Market between 2026 and 2030?

    • USD 4.03 billion, at a CAGR of 8.5%

  • What segmentation does the market report cover?

    • The report is segmented by End-user (IT and telecom, BFSI, Healthcare, Manufacturing, and Others), Deployment (Cloud based, and On-premises), Component (Software, and Services) and Geography (North America, Europe, APAC, Middle East and Africa, South America)

  • Which regions are analyzed in the report?

    • North America, Europe, APAC, Middle East and Africa and South America

  • What are the key growth drivers and market challenges?

    • Strategic imperative of labor cost optimization and regulatory compliance, Escalating data security and privacy concerns

  • Who are the major players in the Workforce Management Software Market?

    • Automatic Data Processing Inc., Blue Yonder Group Inc., Cornerstone OnDemand Inc., Dayforce Inc., Deputechnologies Pty Ltd., Infor Inc., Legion Technologies Inc., NICE Ltd., Oracle Corp., Papaya Global Ltd., Paycor HCM Inc., PTC Inc., SAP SE, TimeClock Plus LLC, UKG Inc., Verint Systems Inc., Workday Inc., WorkForce Software LLC, Zebra Technologies Corp. and Zoho Corp. Pvt. Ltd.

Market Research Insights

  • The market's momentum is driven by operational efficiency gains, with organizations adopting human capital management platforms achieving up to a 30% reduction in payroll errors. The move toward a human-centric approach and agile workforce management is evident, as platforms offering intelligent self-service options see a 20% higher employee adoption rate compared to legacy systems.
  • Strategic human capital management is no longer a niche concept; integrating AI-powered forecasting tools improves demand prediction accuracy by over 25%. This digital transformation in HR is critical, as industry-specific solutions are necessary to navigate complex regulations like fair workweek ordinances and manage integrated enterprise ecosystems effectively, demonstrating a clear return on investment.

We can help! Our analysts can customize this workforce management software market research report to meet your requirements.

Get in touch

1. Executive Summary

1.1 Market overview

Executive Summary - Chart on Market Overview
Executive Summary - Data Table on Market Overview
Executive Summary - Chart on Global Market Characteristics
Executive Summary - Chart on Market by Geography
Executive Summary - Chart on Market Segmentation by End-user
Executive Summary - Chart on Market Segmentation by Deployment
Executive Summary - Chart on Market Segmentation by Component
Executive Summary - Chart on Incremental Growth
Executive Summary - Data Table on Incremental Growth
Executive Summary - Chart on Company Market Positioning

2. Technavio Analysis

2.1 Analysis of price sensitivity, lifecycle, customer purchase basket, adoption rates, and purchase criteria

2.2 Criticality of inputs and Factors of differentiation

Chart on Overview on criticality of inputs and factors of differentiation

2.3 Factors of disruption

Chart on Overview on factors of disruption

2.4 Impact of drivers and challenges

Chart on Impact of drivers and challenges in 2025 and 2030

3. Market Landscape

3.1 Market ecosystem

Chart on Parent Market
Data Table on - Parent Market

3.2 Market characteristics

Chart on Market characteristics analysis

3.3 Value chain analysis

Chart on Value chain analysis

4. Market Sizing

4.1 Market definition

Data Table on Offerings of companies included in the market definition

4.2 Market segment analysis

Market segments

4.3 Market size 2025

4.4 Market outlook: Forecast for 2025-2030

Chart on Global - Market size and forecast 2025-2030 ($ million)
Data Table on Global - Market size and forecast 2025-2030 ($ million)
Chart on Global Market: Year-over-year growth 2025-2030 (%)
Data Table on Global Market: Year-over-year growth 2025-2030 (%)

5. Historic Market Size

5.1 Global Workforce Management Software Market 2020 - 2024

Historic Market Size - Data Table on Global Workforce Management Software Market 2020 - 2024 ($ million)

5.2 End-user segment analysis 2020 - 2024

Historic Market Size - End-user Segment 2020 - 2024 ($ million)

5.3 Deployment segment analysis 2020 - 2024

Historic Market Size - Deployment Segment 2020 - 2024 ($ million)

5.4 Component segment analysis 2020 - 2024

Historic Market Size - Component Segment 2020 - 2024 ($ million)

5.5 Geography segment analysis 2020 - 2024

Historic Market Size - Geography Segment 2020 - 2024 ($ million)

5.6 Country segment analysis 2020 - 2024

Historic Market Size - Country Segment 2020 - 2024 ($ million)

6. Qualitative Analysis

6.1 Impact of AI on Global Workforce Management Software Market

6.2 Impact of Geopolitical Conflicts on Global Workforce Management Software Market

7. Five Forces Analysis

7.1 Five forces summary

Five forces analysis - Comparison between 2025 and 2030

7.2 Bargaining power of buyers

Bargaining power of buyers - Impact of key factors 2025 and 2030

7.3 Bargaining power of suppliers

Bargaining power of suppliers - Impact of key factors in 2025 and 2030

7.4 Threat of new entrants

Threat of new entrants - Impact of key factors in 2025 and 2030

7.5 Threat of substitutes

Threat of substitutes - Impact of key factors in 2025 and 2030

7.6 Threat of rivalry

Threat of rivalry - Impact of key factors in 2025 and 2030

7.7 Market condition

Chart on Market condition - Five forces 2025 and 2030

8. Market Segmentation by End-user

8.1 Market segments

Chart on End-user - Market share 2025-2030 (%)
Data Table on End-user - Market share 2025-2030 (%)

8.2 Comparison by End-user

Chart on Comparison by End-user
Data Table on Comparison by End-user

8.3 IT and telecom - Market size and forecast 2025-2030

Chart on IT and telecom - Market size and forecast 2025-2030 ($ million)
Data Table on IT and telecom - Market size and forecast 2025-2030 ($ million)
Chart on IT and telecom - Year-over-year growth 2025-2030 (%)
Data Table on IT and telecom - Year-over-year growth 2025-2030 (%)

8.4 BFSI - Market size and forecast 2025-2030

Chart on BFSI - Market size and forecast 2025-2030 ($ million)
Data Table on BFSI - Market size and forecast 2025-2030 ($ million)
Chart on BFSI - Year-over-year growth 2025-2030 (%)
Data Table on BFSI - Year-over-year growth 2025-2030 (%)

8.5 Healthcare - Market size and forecast 2025-2030

Chart on Healthcare - Market size and forecast 2025-2030 ($ million)
Data Table on Healthcare - Market size and forecast 2025-2030 ($ million)
Chart on Healthcare - Year-over-year growth 2025-2030 (%)
Data Table on Healthcare - Year-over-year growth 2025-2030 (%)

8.6 Manufacturing - Market size and forecast 2025-2030

Chart on Manufacturing - Market size and forecast 2025-2030 ($ million)
Data Table on Manufacturing - Market size and forecast 2025-2030 ($ million)
Chart on Manufacturing - Year-over-year growth 2025-2030 (%)
Data Table on Manufacturing - Year-over-year growth 2025-2030 (%)

8.7 Others - Market size and forecast 2025-2030

Chart on Others - Market size and forecast 2025-2030 ($ million)
Data Table on Others - Market size and forecast 2025-2030 ($ million)
Chart on Others - Year-over-year growth 2025-2030 (%)
Data Table on Others - Year-over-year growth 2025-2030 (%)

8.8 Market opportunity by End-user

Market opportunity by End-user ($ million)
Data Table on Market opportunity by End-user ($ million)

9. Market Segmentation by Deployment

9.1 Market segments

Chart on Deployment - Market share 2025-2030 (%)
Data Table on Deployment - Market share 2025-2030 (%)

9.2 Comparison by Deployment

Chart on Comparison by Deployment
Data Table on Comparison by Deployment

9.3 Cloud based - Market size and forecast 2025-2030

Chart on Cloud based - Market size and forecast 2025-2030 ($ million)
Data Table on Cloud based - Market size and forecast 2025-2030 ($ million)
Chart on Cloud based - Year-over-year growth 2025-2030 (%)
Data Table on Cloud based - Year-over-year growth 2025-2030 (%)

9.4 On-premises - Market size and forecast 2025-2030

Chart on On-premises - Market size and forecast 2025-2030 ($ million)
Data Table on On-premises - Market size and forecast 2025-2030 ($ million)
Chart on On-premises - Year-over-year growth 2025-2030 (%)
Data Table on On-premises - Year-over-year growth 2025-2030 (%)

9.5 Market opportunity by Deployment

Market opportunity by Deployment ($ million)
Data Table on Market opportunity by Deployment ($ million)

10. Market Segmentation by Component

10.1 Market segments

Chart on Component - Market share 2025-2030 (%)
Data Table on Component - Market share 2025-2030 (%)

10.2 Comparison by Component

Chart on Comparison by Component
Data Table on Comparison by Component

10.3 Software - Market size and forecast 2025-2030

Chart on Software - Market size and forecast 2025-2030 ($ million)
Data Table on Software - Market size and forecast 2025-2030 ($ million)
Chart on Software - Year-over-year growth 2025-2030 (%)
Data Table on Software - Year-over-year growth 2025-2030 (%)

10.4 Services - Market size and forecast 2025-2030

Chart on Services - Market size and forecast 2025-2030 ($ million)
Data Table on Services - Market size and forecast 2025-2030 ($ million)
Chart on Services - Year-over-year growth 2025-2030 (%)
Data Table on Services - Year-over-year growth 2025-2030 (%)

10.5 Market opportunity by Component

Market opportunity by Component ($ million)
Data Table on Market opportunity by Component ($ million)

11. Customer Landscape

11.1 Customer landscape overview

Analysis of price sensitivity, lifecycle, customer purchase basket, adoption rates, and purchase criteria

12. Geographic Landscape

12.1 Geographic segmentation

Chart on Market share by geography 2025-2030 (%)
Data Table on Market share by geography 2025-2030 (%)

12.2 Geographic comparison

Chart on Geographic comparison
Data Table on Geographic comparison

12.3 North America - Market size and forecast 2025-2030

Chart on North America - Market size and forecast 2025-2030 ($ million)
Data Table on North America - Market size and forecast 2025-2030 ($ million)
Chart on North America - Year-over-year growth 2025-2030 (%)
Data Table on North America - Year-over-year growth 2025-2030 (%)
Chart on Regional Comparison - North America
Data Table on Regional Comparison - North America

12.3.1 US - Market size and forecast 2025-2030

Chart on US - Market size and forecast 2025-2030 ($ million)
Data Table on US - Market size and forecast 2025-2030 ($ million)
Chart on US - Year-over-year growth 2025-2030 (%)
Data Table on US - Year-over-year growth 2025-2030 (%)

12.3.2 Canada - Market size and forecast 2025-2030

Chart on Canada - Market size and forecast 2025-2030 ($ million)
Data Table on Canada - Market size and forecast 2025-2030 ($ million)
Chart on Canada - Year-over-year growth 2025-2030 (%)
Data Table on Canada - Year-over-year growth 2025-2030 (%)

12.3.3 Mexico - Market size and forecast 2025-2030

Chart on Mexico - Market size and forecast 2025-2030 ($ million)
Data Table on Mexico - Market size and forecast 2025-2030 ($ million)
Chart on Mexico - Year-over-year growth 2025-2030 (%)
Data Table on Mexico - Year-over-year growth 2025-2030 (%)

12.4 Europe - Market size and forecast 2025-2030

Chart on Europe - Market size and forecast 2025-2030 ($ million)
Data Table on Europe - Market size and forecast 2025-2030 ($ million)
Chart on Europe - Year-over-year growth 2025-2030 (%)
Data Table on Europe - Year-over-year growth 2025-2030 (%)
Chart on Regional Comparison - Europe
Data Table on Regional Comparison - Europe

12.4.1 Germany - Market size and forecast 2025-2030

Chart on Germany - Market size and forecast 2025-2030 ($ million)
Data Table on Germany - Market size and forecast 2025-2030 ($ million)
Chart on Germany - Year-over-year growth 2025-2030 (%)
Data Table on Germany - Year-over-year growth 2025-2030 (%)

12.4.2 UK - Market size and forecast 2025-2030

Chart on UK - Market size and forecast 2025-2030 ($ million)
Data Table on UK - Market size and forecast 2025-2030 ($ million)
Chart on UK - Year-over-year growth 2025-2030 (%)
Data Table on UK - Year-over-year growth 2025-2030 (%)

12.4.3 France - Market size and forecast 2025-2030

Chart on France - Market size and forecast 2025-2030 ($ million)
Data Table on France - Market size and forecast 2025-2030 ($ million)
Chart on France - Year-over-year growth 2025-2030 (%)
Data Table on France - Year-over-year growth 2025-2030 (%)

12.4.4 Italy - Market size and forecast 2025-2030

Chart on Italy - Market size and forecast 2025-2030 ($ million)
Data Table on Italy - Market size and forecast 2025-2030 ($ million)
Chart on Italy - Year-over-year growth 2025-2030 (%)
Data Table on Italy - Year-over-year growth 2025-2030 (%)

12.4.5 Spain - Market size and forecast 2025-2030

Chart on Spain - Market size and forecast 2025-2030 ($ million)
Data Table on Spain - Market size and forecast 2025-2030 ($ million)
Chart on Spain - Year-over-year growth 2025-2030 (%)
Data Table on Spain - Year-over-year growth 2025-2030 (%)

12.4.6 The Netherlands - Market size and forecast 2025-2030

Chart on The Netherlands - Market size and forecast 2025-2030 ($ million)
Data Table on The Netherlands - Market size and forecast 2025-2030 ($ million)
Chart on The Netherlands - Year-over-year growth 2025-2030 (%)
Data Table on The Netherlands - Year-over-year growth 2025-2030 (%)

12.5 APAC - Market size and forecast 2025-2030

Chart on APAC - Market size and forecast 2025-2030 ($ million)
Data Table on APAC - Market size and forecast 2025-2030 ($ million)
Chart on APAC - Year-over-year growth 2025-2030 (%)
Data Table on APAC - Year-over-year growth 2025-2030 (%)
Chart on Regional Comparison - APAC
Data Table on Regional Comparison - APAC

12.5.1 China - Market size and forecast 2025-2030

Chart on China - Market size and forecast 2025-2030 ($ million)
Data Table on China - Market size and forecast 2025-2030 ($ million)
Chart on China - Year-over-year growth 2025-2030 (%)
Data Table on China - Year-over-year growth 2025-2030 (%)

12.5.2 Japan - Market size and forecast 2025-2030

Chart on Japan - Market size and forecast 2025-2030 ($ million)
Data Table on Japan - Market size and forecast 2025-2030 ($ million)
Chart on Japan - Year-over-year growth 2025-2030 (%)
Data Table on Japan - Year-over-year growth 2025-2030 (%)

12.5.3 India - Market size and forecast 2025-2030

Chart on India - Market size and forecast 2025-2030 ($ million)
Data Table on India - Market size and forecast 2025-2030 ($ million)
Chart on India - Year-over-year growth 2025-2030 (%)
Data Table on India - Year-over-year growth 2025-2030 (%)

12.5.4 Australia - Market size and forecast 2025-2030

Chart on Australia - Market size and forecast 2025-2030 ($ million)
Data Table on Australia - Market size and forecast 2025-2030 ($ million)
Chart on Australia - Year-over-year growth 2025-2030 (%)
Data Table on Australia - Year-over-year growth 2025-2030 (%)

12.5.5 South Korea - Market size and forecast 2025-2030

Chart on South Korea - Market size and forecast 2025-2030 ($ million)
Data Table on South Korea - Market size and forecast 2025-2030 ($ million)
Chart on South Korea - Year-over-year growth 2025-2030 (%)
Data Table on South Korea - Year-over-year growth 2025-2030 (%)

12.5.6 Indonesia - Market size and forecast 2025-2030

Chart on Indonesia - Market size and forecast 2025-2030 ($ million)
Data Table on Indonesia - Market size and forecast 2025-2030 ($ million)
Chart on Indonesia - Year-over-year growth 2025-2030 (%)
Data Table on Indonesia - Year-over-year growth 2025-2030 (%)

12.6 Middle East and Africa - Market size and forecast 2025-2030

Chart on Middle East and Africa - Market size and forecast 2025-2030 ($ million)
Data Table on Middle East and Africa - Market size and forecast 2025-2030 ($ million)
Chart on Middle East and Africa - Year-over-year growth 2025-2030 (%)
Data Table on Middle East and Africa - Year-over-year growth 2025-2030 (%)
Chart on Regional Comparison - Middle East and Africa
Data Table on Regional Comparison - Middle East and Africa

12.6.1 Saudi Arabia - Market size and forecast 2025-2030

Chart on Saudi Arabia - Market size and forecast 2025-2030 ($ million)
Data Table on Saudi Arabia - Market size and forecast 2025-2030 ($ million)
Chart on Saudi Arabia - Year-over-year growth 2025-2030 (%)
Data Table on Saudi Arabia - Year-over-year growth 2025-2030 (%)

12.6.2 UAE - Market size and forecast 2025-2030

Chart on UAE - Market size and forecast 2025-2030 ($ million)
Data Table on UAE - Market size and forecast 2025-2030 ($ million)
Chart on UAE - Year-over-year growth 2025-2030 (%)
Data Table on UAE - Year-over-year growth 2025-2030 (%)

12.6.3 South Africa - Market size and forecast 2025-2030

Chart on South Africa - Market size and forecast 2025-2030 ($ million)
Data Table on South Africa - Market size and forecast 2025-2030 ($ million)
Chart on South Africa - Year-over-year growth 2025-2030 (%)
Data Table on South Africa - Year-over-year growth 2025-2030 (%)

12.6.4 Israel - Market size and forecast 2025-2030

Chart on Israel - Market size and forecast 2025-2030 ($ million)
Data Table on Israel - Market size and forecast 2025-2030 ($ million)
Chart on Israel - Year-over-year growth 2025-2030 (%)
Data Table on Israel - Year-over-year growth 2025-2030 (%)

12.6.5 Turkey - Market size and forecast 2025-2030

Chart on Turkey - Market size and forecast 2025-2030 ($ million)
Data Table on Turkey - Market size and forecast 2025-2030 ($ million)
Chart on Turkey - Year-over-year growth 2025-2030 (%)
Data Table on Turkey - Year-over-year growth 2025-2030 (%)

12.7 South America - Market size and forecast 2025-2030

Chart on South America - Market size and forecast 2025-2030 ($ million)
Data Table on South America - Market size and forecast 2025-2030 ($ million)
Chart on South America - Year-over-year growth 2025-2030 (%)
Data Table on South America - Year-over-year growth 2025-2030 (%)
Chart on Regional Comparison - South America
Data Table on Regional Comparison - South America

12.7.1 Brazil - Market size and forecast 2025-2030

Chart on Brazil - Market size and forecast 2025-2030 ($ million)
Data Table on Brazil - Market size and forecast 2025-2030 ($ million)
Chart on Brazil - Year-over-year growth 2025-2030 (%)
Data Table on Brazil - Year-over-year growth 2025-2030 (%)

12.7.2 Argentina - Market size and forecast 2025-2030

Chart on Argentina - Market size and forecast 2025-2030 ($ million)
Data Table on Argentina - Market size and forecast 2025-2030 ($ million)
Chart on Argentina - Year-over-year growth 2025-2030 (%)
Data Table on Argentina - Year-over-year growth 2025-2030 (%)

12.7.3 Colombia - Market size and forecast 2025-2030

Chart on Colombia - Market size and forecast 2025-2030 ($ million)
Data Table on Colombia - Market size and forecast 2025-2030 ($ million)
Chart on Colombia - Year-over-year growth 2025-2030 (%)
Data Table on Colombia - Year-over-year growth 2025-2030 (%)

12.8 Market opportunity by geography

Market opportunity by geography ($ million)
Data Tables on Market opportunity by geography ($ million)

13. Drivers, Challenges, and Opportunity

13.1 Market drivers

Strategic imperative of labor cost optimization and regulatory compliance
Accelerated adoption of cloud-based solutions and AI
Proliferation of remote, hybrid, and flexible work models

13.2 Market challenges

Escalating data security and privacy concerns
Complexity of integration with legacy and disparate systems
Adapting to diverse and evolving modern workforce

13.3 Impact of drivers and challenges

Impact of drivers and challenges in 2025 and 2030

13.4 Market opportunities

Embedded AI and hyper-automation
Focus on employee experience and well-being
Convergence of workforce management with financial wellness

14. Competitive Landscape

14.1 Overview

14.2

Overview on criticality of inputs and factors of differentiation

14.3 Landscape disruption

Overview on factors of disruption

14.4 Industry risks

Impact of key risks on business

15. Competitive Analysis

15.1 Companies profiled

Companies covered

15.2 Company ranking index

15.3 Market positioning of companies

Matrix on companies position and classification

15.4 Automatic Data Processing Inc.

Automatic Data Processing Inc. - Overview
Automatic Data Processing Inc. - Business segments
Automatic Data Processing Inc. - Key offerings
Automatic Data Processing Inc. - Segment focus
SWOT

15.5 Dayforce Inc.

Dayforce Inc. - Overview
Dayforce Inc. - Product / Service
Dayforce Inc. - Key offerings
SWOT

15.6 Infor Inc.

Infor Inc. - Overview
Infor Inc. - Product / Service
Infor Inc. - Key offerings
SWOT

15.7 NICE Ltd.

NICE Ltd. - Overview
NICE Ltd. - Business segments
NICE Ltd. - Key offerings
NICE Ltd. - Segment focus
SWOT

15.8 Oracle Corp.

Oracle Corp. - Overview
Oracle Corp. - Business segments
Oracle Corp. - Key news
Oracle Corp. - Key offerings
Oracle Corp. - Segment focus
SWOT

15.9 Paycor HCM Inc.

Paycor HCM Inc. - Overview
Paycor HCM Inc. - Product / Service
Paycor HCM Inc. - Key offerings
SWOT

15.10 PTC Inc.

PTC Inc. - Overview
PTC Inc. - Business segments
PTC Inc. - Key offerings
PTC Inc. - Segment focus
SWOT

15.11 SAP SE

SAP SE - Overview
SAP SE - Business segments
SAP SE - Key news
SAP SE - Key offerings
SAP SE - Segment focus
SWOT

15.12 TimeClock Plus LLC

TimeClock Plus LLC - Overview
TimeClock Plus LLC - Product / Service
TimeClock Plus LLC - Key offerings
SWOT

15.13 UKG Inc.

UKG Inc. - Overview
UKG Inc. - Product / Service
UKG Inc. - Key offerings
SWOT

15.14 Verint Systems Inc.

Verint Systems Inc. - Overview
Verint Systems Inc. - Product / Service
Verint Systems Inc. - Key news
Verint Systems Inc. - Key offerings
SWOT

15.15 Workday Inc.

Workday Inc. - Overview
Workday Inc. - Product / Service
Workday Inc. - Key news
Workday Inc. - Key offerings
SWOT

15.16 WorkForce Software LLC

WorkForce Software LLC - Overview
WorkForce Software LLC - Product / Service
WorkForce Software LLC - Key offerings
SWOT

15.17 Zebra Technologies Corp.

Zebra Technologies Corp. - Overview
Zebra Technologies Corp. - Business segments
Zebra Technologies Corp. - Key news
Zebra Technologies Corp. - Key offerings
Zebra Technologies Corp. - Segment focus
SWOT

15.18 Zoho Corp. Pvt. Ltd.

Zoho Corp. Pvt. Ltd. - Overview
Zoho Corp. Pvt. Ltd. - Product / Service
Zoho Corp. Pvt. Ltd. - Key offerings
SWOT

16. Appendix

16.1 Scope of the report

Market definition
Objectives
Notes and caveats

16.2 Inclusions and exclusions checklist

Inclusions checklist
Exclusions checklist

16.3 Currency conversion rates for US$

16.4 Research methodology

16.5 Data procurement

Information sources

16.6 Data validation

16.7 Validation techniques employed for market sizing

16.8 Data synthesis

16.9 360 degree market analysis

16.10 List of abbreviations

Research Methodology

Technavio presents a detailed picture of the market by way of study, synthesis, and summation of data from multiple sources. The analysts have presented the various facets of the market with a particular focus on identifying the key industry influencers. The data thus presented is comprehensive, reliable, and the result of extensive research, both primary and secondary.

INFORMATION SOURCES

Primary sources

  • Manufacturers and suppliers
  • Channel partners
  • Industry experts
  • Strategic decision makers

Secondary sources

  • Industry journals and periodicals
  • Government data
  • Financial reports of key industry players
  • Historical data
  • Press releases

DATA ANALYSIS

Data Synthesis

  • Collation of data
  • Estimation of key figures
  • Analysis of derived insights

Data Validation

  • Triangulation with data models
  • Reference against proprietary databases
  • Corroboration with industry experts

REPORT WRITING

Qualitative

  • Market drivers
  • Market challenges
  • Market trends
  • Five forces analysis

Quantitative

  • Market size and forecast
  • Market segmentation
  • Geographical insights
  • Competitive landscape

Interested in this report?

Get your sample now to see our research methodology and insights!

Download Now

Frequently Asked Questions

Workforce Management Software market growth will increase by USD 4032.6 million during 2026-2030.

The Workforce Management Software market is expected to grow at a CAGR of 8.5% during 2026-2030.

Workforce Management Software market is segmented by End-user (IT and telecom, BFSI, Healthcare, Manufacturing, Others) Deployment (Cloud based, On-premises) Component (Software, Services)

Automatic Data Processing Inc., Blue Yonder Group Inc., Cornerstone OnDemand Inc., Dayforce Inc., Deputechnologies Pty Ltd., Infor Inc., Legion Technologies Inc., NICE Ltd., Oracle Corp., Papaya Global Ltd., Paycor HCM Inc., PTC Inc., SAP SE, TimeClock Plus LLC, UKG Inc., Verint Systems Inc., Workday Inc., WorkForce Software LLC, Zebra Technologies Corp., Zoho Corp. Pvt. Ltd. are a few of the key vendors in the Workforce Management Software market.

North America will register the highest growth rate of 38.1% among the other regions. Therefore, the Workforce Management Software market in North America is expected to garner significant business opportunities for the vendors during the forecast period.

US, Canada, Mexico, Germany, UK, France, Italy, Spain, The Netherlands, China, Japan, India, Australia, South Korea, Indonesia, Saudi Arabia, UAE, South Africa, Israel, Turkey, Brazil, Argentina, Colombia

  • Strategic imperative of labor cost optimization and regulatory compliance is the driving factor this market.

The Workforce Management Software market vendors should focus on grabbing business opportunities from the End-user segment as it accounted for the largest market share in the base year.
RIA - Research AI Assistant
Ask RIA