Virtual Labs For STEM Education Market Analysis, Size, and Forecast 2026-2030: North America (US, Canada, and Mexico), Europe (UK, Germany, and France), APAC (China, India, and Japan), Middle East and Africa (Saudi Arabia, UAE, and South Africa), South America (Brazil, Argentina, and Colombia), and Rest of World (ROW)

Virtual Labs For STEM Education Market Analysis, Size, and Forecast 2026-2030:
North America (US, Canada, and Mexico), Europe (UK, Germany, and France), APAC (China, India, and Japan), Middle East and Africa (Saudi Arabia, UAE, and South Africa), South America (Brazil, Argentina, and Colombia), and Rest of World (ROW)

Published: May 2026 296 Pages SKU: IRTNTR81311

Market Overview at a Glance

$2.84 B
Market Opportunity
15.3%
CAGR 2025 - 2030
37.1%
North America Growth
$1.02 B
Simulation tools segment 2024

Virtual Labs For Stem Education Market Size and Growth Forecast 2026-2030

The Virtual Labs For Stem Education Market size was valued at USD 2.73 billion in 2025 growing at a CAGR of 15.3% during the forecast period 2026-2030.

North America accounts for 37.1% of incremental growth during the forecast period. The Simulation tools segment by Type was valued at USD 1.02 billion in 2024, while the Higher education segment holds the largest revenue share by Application.

The market is projected to grow by USD 4.15 billion from 2020 to 2030, with USD 2.84 billion of the growth expected during the forecast period of 2025 to 2030.

Get Key Insights on Market Forecast (PDF) Request Free Sample

Virtual Labs For Stem Education Market Overview

The virtual labs for STEM education market is expanding as educational institutions prioritize scalable solutions that offer practical scientific exposure without the logistical and financial burdens of physical facilities. This evolution is driven by the demand for STEM competencies, addressed by experiential learning technology. Platforms provide high-fidelity simulation of complex experiments, with immersive learning environments enhancing comprehension. North America is a significant contributor to this expansion, accounting for over 37% of the market's incremental growth, fueled by investment in digital infrastructure. For instance, a multi-campus university system implementing a biology simulation platform and virtual chemistry labs for its introductory science courses can effectively manage high enrollment and provide consistent remote laboratory access. This approach improves student engagement metrics and allows for better pedagogical integration by using analytics to track student progress, ensuring a standardized, high-quality learning experience across all locations and overcoming the physical constraints of traditional labs. The adoption of such solutions is critical for modern STEM curriculum development.

Drivers, Trends, and Challenges in the Virtual Labs For Stem Education Market

The strategic cost-benefit analysis of virtual vs physical labs is a central consideration for procurement decision-makers. While physical labs incur high recurring costs for materials and maintenance, virtual lab platforms for corporate technical training and higher education offer a scalable alternative.

A key debate involves comparing open-source vs commercial virtual lab software; open-source options offer flexibility, but commercial platforms often provide better support for integrating virtual labs with existing LMS platforms and ensuring compliance with digital accessibility standards in virtual labs.

For institutions focusing on virtual lab solutions for higher education STEM, assessing student performance in virtual lab environments through embedded analytics is a critical feature. The impact of AI on personalized STEM education is profound, with generative AI for creating dynamic lab scenarios offering tailored learning paths.

In K-12, AR and VR applications in K-12 science labs are being explored, though there are challenges in deploying virtual labs in developing regions due to infrastructure gaps. The role of cloud computing in scalable virtual labs cannot be overstated, though it introduces cybersecurity considerations for cloud-based virtual labs.

Advanced applications include haptic technology integration in engineering simulations and digital twin technology for advanced engineering labs, enabling virtual reality training for industrial applications and using virtual labs for remote scientific collaboration. Developing gamified content for virtual chemistry labs enhances engagement, while measuring learning outcomes in immersive VR labs provides data on efficacy.

Ultimately, adopting best practices for hybrid learning with virtual labs is essential for successful implementation, supported by initiatives like Germany's DigitalPakt Schule.

Primary Growth Driver: The rising demand for remote and hybrid learning environments serves as a key driver for market growth, compelling institutions to adopt flexible, location-independent instructional formats.

The primary market driver is the global educational shift toward flexible hybrid learning models, which necessitates solutions providing remote laboratory access.

This is particularly evident in North America, which accounts for over 37% of the market's incremental growth, as institutions seek to accommodate diverse student populations.

A second major driver is educational resource optimization; virtual labs offer significant cost savings over physical labs by eliminating the need for expensive equipment.

Technological innovation further fuels growth, with advancements in high-fidelity simulation, VR, AR, and haptic feedback interfaces making the digital experience more realistic and pedagogically effective, bridging the gap between virtual and physical experimentation with tools like virtual scientific instruments.

Emerging Market Trend: The integration of generative AI and intelligent tutoring systems is an emerging market trend, transforming static simulations into dynamic, interactive mentoring environments.

Market trends are shifting from static simulations to dynamic, intelligent platforms. The integration of generative AI tutoring systems is a primary development, offering students real-time, personalized guidance that enhances critical thinking. Another key trend is the move toward spatial computing platforms and interactive 3D environments, which use VR and AR to improve retention of complex spatial information.

In regions like South America, which shows a steady growth rate of 14.3%, there is a notable shift toward gamification and competency-based assessment. This approach uses interactive challenges and digital credentialing to measure proficiency, directly boosting student engagement metrics and transforming how learners perceive STEM subjects by making them more interactive and accessible for hands-on simulation training.

Key Industry Challenge: High initial implementation costs and significant infrastructure barriers present a key challenge, hindering widespread market adoption and affecting industry growth.

Significant challenges restrain market growth, led by high initial implementation costs and infrastructure barriers. Many institutions lack the funding for high-end hardware or a robust technical support infrastructure. A second major challenge is pedagogical resistance and difficulties with curriculum alignment, particularly in regions like Europe.

Many educators remain skeptical about the ability of virtual labs to replace the tactile experience of physical labs, slowing pedagogical integration. Furthermore, disparities in digital literacy standards among instructors and students can lead to underutilization of advanced features.

Ensuring data privacy in education on cloud-based platforms also presents a complex compliance hurdle for institutions worldwide, adding another layer of difficulty to widespread virtual lab accessibility.

Explore Full Market Dynamics Analysis Request Free Sample

Virtual Labs For Stem Education Market Segmentation

The virtual labs for stem education industry research report provides comprehensive data including region-wise segment analysis, with forecasts and analysis for the period 2026-2030, as well as historical data from 2020-2024 for the following segments.

Market Segment by Type
  • Simulation tools
  • VR and AR based labs
  • AI based STEM education
  • Others
Market Segment by Application
  • Higher education
  • K-12 education
  • Online STEM learning platforms
  • Corporate training
Market Segment by Deployment
  • Cloud based
  • On premises
Market Segment by Geography
North America
US, Canada, Mexico
Europe
UK, Germany, France, Italy, Spain, The Netherlands
APAC
China, India, Japan, Australia, South Korea, Indonesia
Middle East and Africa
Saudi Arabia, UAE, South Africa, Israel, Turkey
South America
Brazil, Argentina, Colombia

Type Segment Analysis

The simulation tools segment is estimated to witness significant growth during the forecast period.

Simulation tools represent the largest and most foundational segment in the virtual labs for STEM education market.

These platforms provide mathematical replicas of physical systems, operating on computational models that allow students to manipulate variables and observe outcomes in a controlled digital setting.

The high accessibility of these browser-based cloud-based simulations is a key adoption driver, enabling institutions to provide remote laboratory access without significant hardware investment.

In disciplines like physics and engineering, physics simulation software and engineering simulation tools are critical for visualizing abstract concepts. The integration of real-time data processing allows for immediate feedback, reinforcing learning loops.

As hybrid learning models become standard, these simulation tools serve as a vital bridge between theoretical instruction and practical application for STEM workforce development.

The Simulation tools segment was valued at USD 1.02 billion in 2024 and showed a gradual increase during the forecast period.

Virtual Labs For Stem Education Market by Region: North America Leads with 37.1% Growth Share

North America is estimated to contribute 37.1% to the growth of the global market during the forecast period.

North America represents the most mature market, driven by heavy investment in hybrid learning models and a robust ed-tech infrastructure.

The region contributes over 37% of the market's incremental growth, with the US alone representing a significant portion of market value.

In contrast, the APAC region is projected to exhibit the fastest growth, with a CAGR of 16.4%, fueled by government initiatives aimed at STEM workforce development and overcoming a lack of physical lab infrastructure.

In this region, scalable educational technology like mobile-first cloud-based virtual labs is crucial.

The adoption of advanced tools like augmented reality overlays is also gaining momentum in APAC's technical training sectors, preparing students for advanced manufacturing roles and closing the skills gap with more developed economies.

Customer Landscape Analysis for the Virtual Labs For Stem Education Market

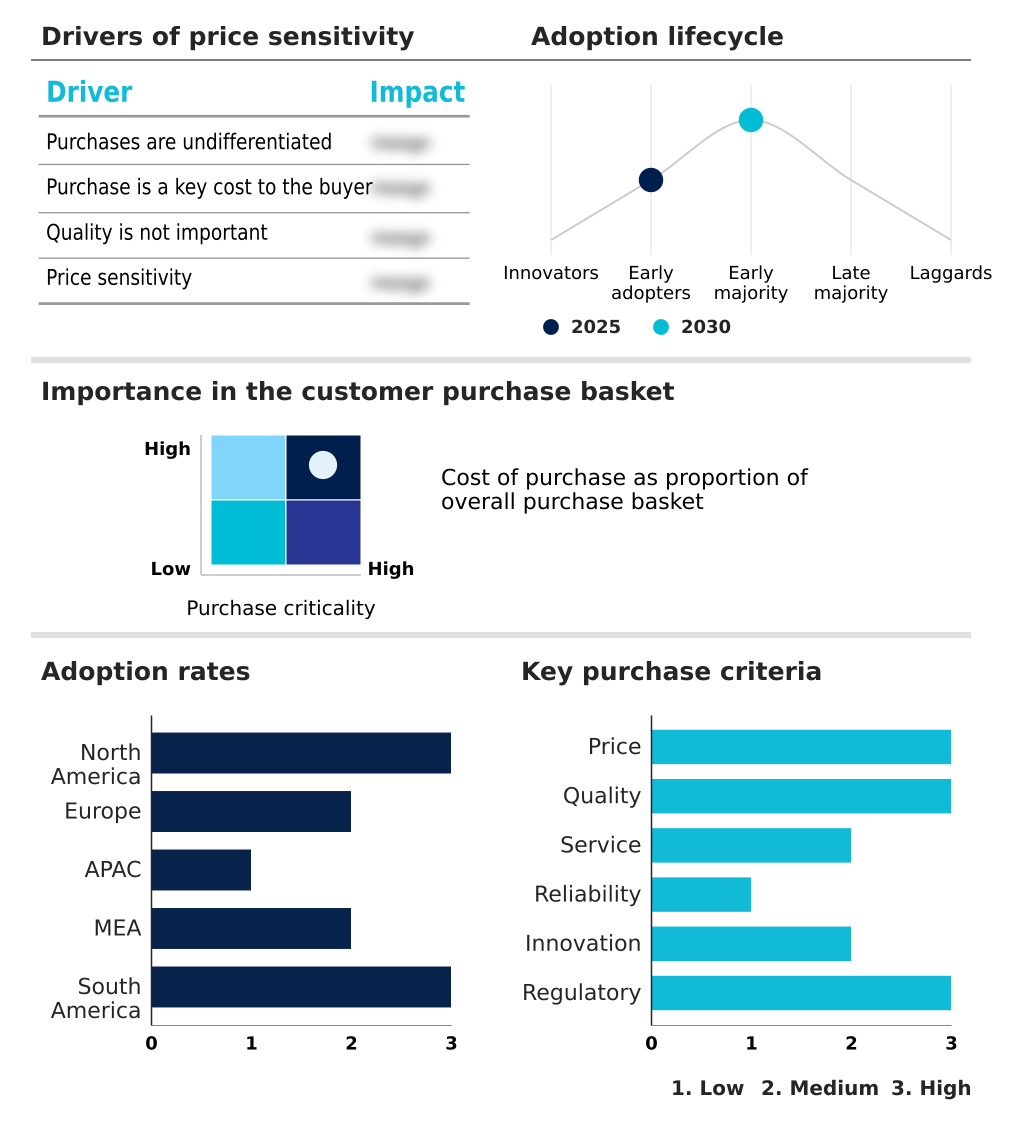
The virtual labs for stem education market forecasting report includes the adoption lifecycle of the market, covering from the innovator’s stage to the laggard’s stage. It focuses on adoption rates in different regions based on penetration. Furthermore, the virtual labs for stem education market report also includes key purchase criteria and drivers of price sensitivity to help companies evaluate and develop their market growth analysis strategies.

Competitive Landscape of the Virtual Labs For Stem Education Market

Companies are implementing various strategies, such as strategic alliances, partnerships, mergers and acquisitions, geographical expansion, and product/service launches, to enhance their presence in the virtual labs for stem education market industry.

Beyond Labz Inc. - Beyond Labz Inc. offers immersive, open-ended virtual lab simulations, featuring realistic environments and curriculum-aligned activities for chemistry, physics, and biology.

The industry research and growth report includes detailed analyses of the competitive landscape of the market and information about key companies, including:

  • Beyond Labz Inc.
  • Carolina Biological Supply Co.
  • Cengage Learning Inc.
  • CloudLabs
  • Flinn Scientific Inc.
  • GIGXR Inc.
  • HoloPundits
  • Kognity AB
  • Labster Group ApS
  • McGraw Hill LLC
  • MyJoVE Corp.
  • Nanome Inc.
  • PASCO Scientific Inc.
  • Pearson Plc
  • PraxiLabs
  • Science Interactive Group LLC
  • Vernier Science Education
  • VictoryXR Inc.
  • VRLAB ACADEMY LTD.
  • Wards Science.

Qualitative and quantitative analysis of companies has been conducted to help clients understand the wider business environment as well as the strengths and weaknesses of key industry players. Data is qualitatively analyzed to categorize companies as pure play, category-focused, industry-focused, and diversified; it is quantitatively analyzed to categorize companies as dominant, leading, strong, tentative, and weak.

Recent Developments in the Virtual Labs For Stem Education Market

  • In March, 2025, a prominent public university system in California integrated a comprehensive virtual laboratory framework into its distance learning curriculum for life sciences, allowing thousands of students to complete practical requirements remotely.
  • In May, 2025, a major state university system in the United States introduced a generative AI assistant within its virtual biology laboratories to help students troubleshoot complex genetic sequencing experiments, providing tailored methodological suggestions.
  • In August, 2025, a major technology corporation based in Seoul introduced a new haptic-feedback interface designed to work with engineering simulations, allowing students to feel the resistance of virtual materials and tools.
  • In September, 2025, a leading technical college in South Korea inaugurated a spatial computing center for virtual aeronautical engineering labs, enabling students to collaboratively examine and disassemble virtual jet engines in a shared digital space.

Research Analyst Overview: Virtual Labs For Stem Education Market

Boardroom-level decisions on educational technology investment are increasingly focused on the total cost of ownership and pedagogical integration of virtual labs. The market is moving beyond basic physics simulation software toward immersive learning environments that incorporate virtual reality headsets and haptic feedback interfaces.

For institutions, the choice between deploying a dedicated biology simulation platform or a broad-spectrum suite with virtual chemistry labs and engineering simulation tools hinges on strategic curriculum goals. A critical consideration, governed by regulations like GDPR, is how cloud-based virtual labs manage student data from adaptive learning pathways.

The adoption of hybrid learning models makes remote laboratory access a necessity, driving demand for platforms offering high-fidelity simulation. Technologies such as 3D molecular modeling, augmented reality overlays, virtual microscopy, and digital twin simulations are no longer niche but are becoming key differentiators.

The rise of gamified learning modules and generative AI tutoring systems for online STEM learning requires platforms with robust real-time data processing capabilities to provide competency-based assessment while ensuring a secure experience on spatial computing platforms.

Dive into Technavio’s robust research methodology, blending expert interviews, extensive data synthesis, and validated models for unparalleled Virtual Labs For Stem Education Market insights. See full methodology.

Request Free Sample

Market Scope
Page number 296
Base year 2025
Historic period 2020-2024
Forecast period 2026-2030
Growth momentum & CAGR Accelerate at a CAGR of 15.3%
Market growth 2026-2030 USD 2839.3 million
Market structure Fragmented
YoY growth 2025-2026(%) 14.6%
Key countries US, Canada, Mexico, UK, Germany, France, Italy, Spain, The Netherlands, China, India, Japan, Australia, South Korea, Indonesia, Saudi Arabia, UAE, South Africa, Israel, Turkey, Brazil, Argentina and Colombia
Competitive landscape Leading Companies, Market Positioning of Companies, Competitive Strategies, and Industry Risks

Virtual Labs For Stem Education Market: Key Questions Answered in This Report

  • What is the expected growth of the Virtual Labs For Stem Education Market between 2026 and 2030?

    • The Virtual Labs For Stem Education Market is expected to grow by USD 2.84 billion during 2026-2030, registering a CAGR of 15.3%. Year-over-year growth in 2026 is estimated at 14.6%%. This acceleration is shaped by rising demand for remote and hybrid learning environments, which is intensifying demand across multiple end-use verticals covered in the report.

  • What segmentation does the market report cover?

    • The report is segmented by Type (Simulation tools, VR and AR based labs, AI based STEM education, and Others), Application (Higher education, K-12 education, Online STEM learning platforms, and Corporate training), Deployment (Cloud based, and On premises) and Geography (North America, Europe, APAC, Middle East and Africa, South America). Among these, the Simulation tools segment is estimated to witness significant growth during the forecast period, driven by rising adoption across key application areas. Each segment includes detailed qualitative and quantitative analysis, along with historical data from 2020-2024 and forecasts through 2030 with year-over-year growth rates.

  • Which regions are analyzed in the report?

    • The report covers North America, Europe, APAC, Middle East and Africa and South America. North America is estimated to contribute 37.1% to market growth during the forecast period. Country-level analysis includes US, Canada, Mexico, UK, Germany, France, Italy, Spain, The Netherlands, China, India, Japan, Australia, South Korea, Indonesia, Saudi Arabia, UAE, South Africa, Israel, Turkey, Brazil, Argentina and Colombia, with dedicated market size tables and year-over-year growth for each.

  • What are the key growth drivers and market challenges?

    • The primary driver is rising demand for remote and hybrid learning environments, which is accelerating investment and industry demand. The main challenge is high initial implementation costs and infrastructure barriers, creating operational barriers for key market participants. The report quantifies the impact of each driver and challenge across 2026 and 2030 with comparative analysis.

  • Who are the major players in the Virtual Labs For Stem Education Market?

    • Key vendors include Beyond Labz Inc., Carolina Biological Supply Co., Cengage Learning Inc., CloudLabs, Flinn Scientific Inc., GIGXR Inc., HoloPundits, Kognity AB, Labster Group ApS, McGraw Hill LLC, MyJoVE Corp., Nanome Inc., PASCO Scientific Inc., Pearson Plc, PraxiLabs, Science Interactive Group LLC, Vernier Science Education, VictoryXR Inc., VRLAB ACADEMY LTD. and Wards Science.. The report provides qualitative and quantitative analysis categorizing companies as dominant, leading, strong, tentative, and weak based on their market positioning. Company profiles include business segment analysis, SWOT assessment, key offerings, and recent strategic developments.

Virtual Labs For Stem Education Market Research Insights

Market dynamics are shaped by institutional needs for both educational efficacy and operational efficiency. The higher education segment dominates adoption, leveraging virtual labs to manage large student cohorts in foundational science courses. A key operational consideration is seamless learning management system (LMS) integration, which allows for streamlined grade reporting and personalized learning analytics.

As institutions adopt these platforms, compliance with standards like GDPR becomes critical, especially for cloud-based deployments handling student data, influencing decisions around data privacy in education.

Furthermore, the trend toward digital credentialing for completed lab modules requires robust curriculum alignment, ensuring that skills verified in a virtual environment are recognized by academic and professional bodies, thereby enhancing the value proposition for both students and institutions.

We can help! Our analysts can customize this virtual labs for stem education market research report to meet your requirements.

Get in touch

1. Executive Summary

1.1 Market overview

Executive Summary - Chart on Market Overview
Executive Summary - Data Table on Market Overview
Executive Summary - Chart on Global Market Characteristics
Executive Summary - Chart on Market by Geography
Executive Summary - Chart on Market Segmentation by Type
Executive Summary - Chart on Market Segmentation by Application
Executive Summary - Chart on Market Segmentation by Deployment
Executive Summary - Chart on Incremental Growth
Executive Summary - Data Table on Incremental Growth
Executive Summary - Chart on Company Market Positioning

2. Technavio Analysis

2.1 Analysis of price sensitivity, lifecycle, customer purchase basket, adoption rates, and purchase criteria

2.2 Criticality of inputs and Factors of differentiation

Chart on Overview on criticality of inputs and factors of differentiation

2.3 Factors of disruption

Chart on Overview on factors of disruption

2.4 Impact of drivers and challenges

Chart on Impact of drivers and challenges in 2025 and 2030

3. Market Landscape

3.1 Market ecosystem

Chart on Parent Market
Data Table on - Parent Market

3.2 Market characteristics

Chart on Market characteristics analysis

3.3 Value chain analysis

Chart on Value chain analysis

4. Market Sizing

4.1 Market definition

Data Table on Offerings of companies included in the market definition

4.2 Market segment analysis

Market segments

4.3 Market size 2025

4.4 Market outlook: Forecast for 2025-2030

Chart on Global - Market size and forecast 2025-2030 ($ million)
Data Table on Global - Market size and forecast 2025-2030 ($ million)
Chart on Global Market: Year-over-year growth 2025-2030 (%)
Data Table on Global Market: Year-over-year growth 2025-2030 (%)

5. Historic Market Size

5.1 Global Virtual Labs For STEM Education Market 2020 - 2024

Historic Market Size - Data Table on Global Virtual Labs For STEM Education Market 2020 - 2024 ($ million)

5.2 Type segment analysis 2020 - 2024

Historic Market Size - Type Segment 2020 - 2024 ($ million)

5.3 Application segment analysis 2020 - 2024

Historic Market Size - Application Segment 2020 - 2024 ($ million)

5.4 Deployment segment analysis 2020 - 2024

Historic Market Size - Deployment Segment 2020 - 2024 ($ million)

5.5 Geography segment analysis 2020 - 2024

Historic Market Size - Geography Segment 2020 - 2024 ($ million)

5.6 Country segment analysis 2020 - 2024

Historic Market Size - Country Segment 2020 - 2024 ($ million)

6. Qualitative Analysis

6.1 The AI impact on Global Virtual Labs for STEM Education Market

7. Five Forces Analysis

7.1 Five forces summary

Five forces analysis - Comparison between 2025 and 2030

7.2 Bargaining power of buyers

Bargaining power of buyers - Impact of key factors 2025 and 2030

7.3 Bargaining power of suppliers

Bargaining power of suppliers - Impact of key factors in 2025 and 2030

7.4 Threat of new entrants

Threat of new entrants - Impact of key factors in 2025 and 2030

7.5 Threat of substitutes

Threat of substitutes - Impact of key factors in 2025 and 2030

7.6 Threat of rivalry

Threat of rivalry - Impact of key factors in 2025 and 2030

7.7 Market condition

Chart on Market condition - Five forces 2025 and 2030

8. Market Segmentation by Type

8.1 Market segments

Chart on Type - Market share 2025-2030 (%)
Data Table on Type - Market share 2025-2030 (%)

8.2 Comparison by Type

Chart on Comparison by Type
Data Table on Comparison by Type

8.3 Simulation tools - Market size and forecast 2025-2030

Chart on Simulation tools - Market size and forecast 2025-2030 ($ million)
Data Table on Simulation tools - Market size and forecast 2025-2030 ($ million)
Chart on Simulation tools - Year-over-year growth 2025-2030 (%)
Data Table on Simulation tools - Year-over-year growth 2025-2030 (%)

8.4 VR and AR based labs - Market size and forecast 2025-2030

Chart on VR and AR based labs - Market size and forecast 2025-2030 ($ million)
Data Table on VR and AR based labs - Market size and forecast 2025-2030 ($ million)
Chart on VR and AR based labs - Year-over-year growth 2025-2030 (%)
Data Table on VR and AR based labs - Year-over-year growth 2025-2030 (%)

8.5 AI based STEM education - Market size and forecast 2025-2030

Chart on AI based STEM education - Market size and forecast 2025-2030 ($ million)
Data Table on AI based STEM education - Market size and forecast 2025-2030 ($ million)
Chart on AI based STEM education - Year-over-year growth 2025-2030 (%)
Data Table on AI based STEM education - Year-over-year growth 2025-2030 (%)

8.6 Others - Market size and forecast 2025-2030

Chart on Others - Market size and forecast 2025-2030 ($ million)
Data Table on Others - Market size and forecast 2025-2030 ($ million)
Chart on Others - Year-over-year growth 2025-2030 (%)
Data Table on Others - Year-over-year growth 2025-2030 (%)

8.7 Market opportunity by Type

Market opportunity by Type ($ million)
Data Table on Market opportunity by Type ($ million)

9. Market Segmentation by Application

9.1 Market segments

Chart on Application - Market share 2025-2030 (%)
Data Table on Application - Market share 2025-2030 (%)

9.2 Comparison by Application

Chart on Comparison by Application
Data Table on Comparison by Application

9.3 Higher education - Market size and forecast 2025-2030

Chart on Higher education - Market size and forecast 2025-2030 ($ million)
Data Table on Higher education - Market size and forecast 2025-2030 ($ million)
Chart on Higher education - Year-over-year growth 2025-2030 (%)
Data Table on Higher education - Year-over-year growth 2025-2030 (%)

9.4 K-12 education - Market size and forecast 2025-2030

Chart on K-12 education - Market size and forecast 2025-2030 ($ million)
Data Table on K-12 education - Market size and forecast 2025-2030 ($ million)
Chart on K-12 education - Year-over-year growth 2025-2030 (%)
Data Table on K-12 education - Year-over-year growth 2025-2030 (%)

9.5 Online STEM learning platforms - Market size and forecast 2025-2030

Chart on Online STEM learning platforms - Market size and forecast 2025-2030 ($ million)
Data Table on Online STEM learning platforms - Market size and forecast 2025-2030 ($ million)
Chart on Online STEM learning platforms - Year-over-year growth 2025-2030 (%)
Data Table on Online STEM learning platforms - Year-over-year growth 2025-2030 (%)

9.6 Corporate training - Market size and forecast 2025-2030

Chart on Corporate training - Market size and forecast 2025-2030 ($ million)
Data Table on Corporate training - Market size and forecast 2025-2030 ($ million)
Chart on Corporate training - Year-over-year growth 2025-2030 (%)
Data Table on Corporate training - Year-over-year growth 2025-2030 (%)

9.7 Market opportunity by Application

Market opportunity by Application ($ million)
Data Table on Market opportunity by Application ($ million)

10. Market Segmentation by Deployment

10.1 Market segments

Chart on Deployment - Market share 2025-2030 (%)
Data Table on Deployment - Market share 2025-2030 (%)

10.2 Comparison by Deployment

Chart on Comparison by Deployment
Data Table on Comparison by Deployment

10.3 Cloud based - Market size and forecast 2025-2030

Chart on Cloud based - Market size and forecast 2025-2030 ($ million)
Data Table on Cloud based - Market size and forecast 2025-2030 ($ million)
Chart on Cloud based - Year-over-year growth 2025-2030 (%)
Data Table on Cloud based - Year-over-year growth 2025-2030 (%)

10.4 On premises - Market size and forecast 2025-2030

Chart on On premises - Market size and forecast 2025-2030 ($ million)
Data Table on On premises - Market size and forecast 2025-2030 ($ million)
Chart on On premises - Year-over-year growth 2025-2030 (%)
Data Table on On premises - Year-over-year growth 2025-2030 (%)

10.5 Market opportunity by Deployment

Market opportunity by Deployment ($ million)
Data Table on Market opportunity by Deployment ($ million)

11. Customer Landscape

11.1 Customer landscape overview

Analysis of price sensitivity, lifecycle, customer purchase basket, adoption rates, and purchase criteria

12. Geographic Landscape

12.1 Geographic segmentation

Chart on Market share by geography 2025-2030 (%)
Data Table on Market share by geography 2025-2030 (%)

12.2 Geographic comparison

Chart on Geographic comparison
Data Table on Geographic comparison

12.3 North America - Market size and forecast 2025-2030

Chart on North America - Market size and forecast 2025-2030 ($ million)
Data Table on North America - Market size and forecast 2025-2030 ($ million)
Chart on North America - Year-over-year growth 2025-2030 (%)
Data Table on North America - Year-over-year growth 2025-2030 (%)
Chart on Regional Comparison - North America
Data Table on Regional Comparison - North America

12.3.1 US - Market size and forecast 2025-2030

Chart on US - Market size and forecast 2025-2030 ($ million)
Data Table on US - Market size and forecast 2025-2030 ($ million)
Chart on US - Year-over-year growth 2025-2030 (%)
Data Table on US - Year-over-year growth 2025-2030 (%)

12.3.2 Canada - Market size and forecast 2025-2030

Chart on Canada - Market size and forecast 2025-2030 ($ million)
Data Table on Canada - Market size and forecast 2025-2030 ($ million)
Chart on Canada - Year-over-year growth 2025-2030 (%)
Data Table on Canada - Year-over-year growth 2025-2030 (%)

12.3.3 Mexico - Market size and forecast 2025-2030

Chart on Mexico - Market size and forecast 2025-2030 ($ million)
Data Table on Mexico - Market size and forecast 2025-2030 ($ million)
Chart on Mexico - Year-over-year growth 2025-2030 (%)
Data Table on Mexico - Year-over-year growth 2025-2030 (%)

12.4 Europe - Market size and forecast 2025-2030

Chart on Europe - Market size and forecast 2025-2030 ($ million)
Data Table on Europe - Market size and forecast 2025-2030 ($ million)
Chart on Europe - Year-over-year growth 2025-2030 (%)
Data Table on Europe - Year-over-year growth 2025-2030 (%)
Chart on Regional Comparison - Europe
Data Table on Regional Comparison - Europe

12.4.1 UK - Market size and forecast 2025-2030

Chart on UK - Market size and forecast 2025-2030 ($ million)
Data Table on UK - Market size and forecast 2025-2030 ($ million)
Chart on UK - Year-over-year growth 2025-2030 (%)
Data Table on UK - Year-over-year growth 2025-2030 (%)

12.4.2 Germany - Market size and forecast 2025-2030

Chart on Germany - Market size and forecast 2025-2030 ($ million)
Data Table on Germany - Market size and forecast 2025-2030 ($ million)
Chart on Germany - Year-over-year growth 2025-2030 (%)
Data Table on Germany - Year-over-year growth 2025-2030 (%)

12.4.3 France - Market size and forecast 2025-2030

Chart on France - Market size and forecast 2025-2030 ($ million)
Data Table on France - Market size and forecast 2025-2030 ($ million)
Chart on France - Year-over-year growth 2025-2030 (%)
Data Table on France - Year-over-year growth 2025-2030 (%)

12.4.4 Italy - Market size and forecast 2025-2030

Chart on Italy - Market size and forecast 2025-2030 ($ million)
Data Table on Italy - Market size and forecast 2025-2030 ($ million)
Chart on Italy - Year-over-year growth 2025-2030 (%)
Data Table on Italy - Year-over-year growth 2025-2030 (%)

12.4.5 Spain - Market size and forecast 2025-2030

Chart on Spain - Market size and forecast 2025-2030 ($ million)
Data Table on Spain - Market size and forecast 2025-2030 ($ million)
Chart on Spain - Year-over-year growth 2025-2030 (%)
Data Table on Spain - Year-over-year growth 2025-2030 (%)

12.4.6 The Netherlands - Market size and forecast 2025-2030

Chart on The Netherlands - Market size and forecast 2025-2030 ($ million)
Data Table on The Netherlands - Market size and forecast 2025-2030 ($ million)
Chart on The Netherlands - Year-over-year growth 2025-2030 (%)
Data Table on The Netherlands - Year-over-year growth 2025-2030 (%)

12.5 APAC - Market size and forecast 2025-2030

Chart on APAC - Market size and forecast 2025-2030 ($ million)
Data Table on APAC - Market size and forecast 2025-2030 ($ million)
Chart on APAC - Year-over-year growth 2025-2030 (%)
Data Table on APAC - Year-over-year growth 2025-2030 (%)
Chart on Regional Comparison - APAC
Data Table on Regional Comparison - APAC

12.5.1 China - Market size and forecast 2025-2030

Chart on China - Market size and forecast 2025-2030 ($ million)
Data Table on China - Market size and forecast 2025-2030 ($ million)
Chart on China - Year-over-year growth 2025-2030 (%)
Data Table on China - Year-over-year growth 2025-2030 (%)

12.5.2 India - Market size and forecast 2025-2030

Chart on India - Market size and forecast 2025-2030 ($ million)
Data Table on India - Market size and forecast 2025-2030 ($ million)
Chart on India - Year-over-year growth 2025-2030 (%)
Data Table on India - Year-over-year growth 2025-2030 (%)

12.5.3 Japan - Market size and forecast 2025-2030

Chart on Japan - Market size and forecast 2025-2030 ($ million)
Data Table on Japan - Market size and forecast 2025-2030 ($ million)
Chart on Japan - Year-over-year growth 2025-2030 (%)
Data Table on Japan - Year-over-year growth 2025-2030 (%)

12.5.4 Australia - Market size and forecast 2025-2030

Chart on Australia - Market size and forecast 2025-2030 ($ million)
Data Table on Australia - Market size and forecast 2025-2030 ($ million)
Chart on Australia - Year-over-year growth 2025-2030 (%)
Data Table on Australia - Year-over-year growth 2025-2030 (%)

12.5.5 South Korea - Market size and forecast 2025-2030

Chart on South Korea - Market size and forecast 2025-2030 ($ million)
Data Table on South Korea - Market size and forecast 2025-2030 ($ million)
Chart on South Korea - Year-over-year growth 2025-2030 (%)
Data Table on South Korea - Year-over-year growth 2025-2030 (%)

12.5.6 Indonesia - Market size and forecast 2025-2030

Chart on Indonesia - Market size and forecast 2025-2030 ($ million)
Data Table on Indonesia - Market size and forecast 2025-2030 ($ million)
Chart on Indonesia - Year-over-year growth 2025-2030 (%)
Data Table on Indonesia - Year-over-year growth 2025-2030 (%)

12.6 Middle East and Africa - Market size and forecast 2025-2030

Chart on Middle East and Africa - Market size and forecast 2025-2030 ($ million)
Data Table on Middle East and Africa - Market size and forecast 2025-2030 ($ million)
Chart on Middle East and Africa - Year-over-year growth 2025-2030 (%)
Data Table on Middle East and Africa - Year-over-year growth 2025-2030 (%)
Chart on Regional Comparison - Middle East and Africa
Data Table on Regional Comparison - Middle East and Africa

12.6.1 Saudi Arabia - Market size and forecast 2025-2030

Chart on Saudi Arabia - Market size and forecast 2025-2030 ($ million)
Data Table on Saudi Arabia - Market size and forecast 2025-2030 ($ million)
Chart on Saudi Arabia - Year-over-year growth 2025-2030 (%)
Data Table on Saudi Arabia - Year-over-year growth 2025-2030 (%)

12.6.2 UAE - Market size and forecast 2025-2030

Chart on UAE - Market size and forecast 2025-2030 ($ million)
Data Table on UAE - Market size and forecast 2025-2030 ($ million)
Chart on UAE - Year-over-year growth 2025-2030 (%)
Data Table on UAE - Year-over-year growth 2025-2030 (%)

12.6.3 South Africa - Market size and forecast 2025-2030

Chart on South Africa - Market size and forecast 2025-2030 ($ million)
Data Table on South Africa - Market size and forecast 2025-2030 ($ million)
Chart on South Africa - Year-over-year growth 2025-2030 (%)
Data Table on South Africa - Year-over-year growth 2025-2030 (%)

12.6.4 Israel - Market size and forecast 2025-2030

Chart on Israel - Market size and forecast 2025-2030 ($ million)
Data Table on Israel - Market size and forecast 2025-2030 ($ million)
Chart on Israel - Year-over-year growth 2025-2030 (%)
Data Table on Israel - Year-over-year growth 2025-2030 (%)

12.6.5 Turkey - Market size and forecast 2025-2030

Chart on Turkey - Market size and forecast 2025-2030 ($ million)
Data Table on Turkey - Market size and forecast 2025-2030 ($ million)
Chart on Turkey - Year-over-year growth 2025-2030 (%)
Data Table on Turkey - Year-over-year growth 2025-2030 (%)

12.7 South America - Market size and forecast 2025-2030

Chart on South America - Market size and forecast 2025-2030 ($ million)
Data Table on South America - Market size and forecast 2025-2030 ($ million)
Chart on South America - Year-over-year growth 2025-2030 (%)
Data Table on South America - Year-over-year growth 2025-2030 (%)
Chart on Regional Comparison - South America
Data Table on Regional Comparison - South America

12.7.1 Brazil - Market size and forecast 2025-2030

Chart on Brazil - Market size and forecast 2025-2030 ($ million)
Data Table on Brazil - Market size and forecast 2025-2030 ($ million)
Chart on Brazil - Year-over-year growth 2025-2030 (%)
Data Table on Brazil - Year-over-year growth 2025-2030 (%)

12.7.2 Argentina - Market size and forecast 2025-2030

Chart on Argentina - Market size and forecast 2025-2030 ($ million)
Data Table on Argentina - Market size and forecast 2025-2030 ($ million)
Chart on Argentina - Year-over-year growth 2025-2030 (%)
Data Table on Argentina - Year-over-year growth 2025-2030 (%)

12.7.3 Colombia - Market size and forecast 2025-2030

Chart on Colombia - Market size and forecast 2025-2030 ($ million)
Data Table on Colombia - Market size and forecast 2025-2030 ($ million)
Chart on Colombia - Year-over-year growth 2025-2030 (%)
Data Table on Colombia - Year-over-year growth 2025-2030 (%)

12.8 Market opportunity by geography

Market opportunity by geography ($ million)
Data Tables on Market opportunity by geography ($ million)

13. Drivers, Challenges, and Opportunity

13.1 Market drivers

Rising demand for remote and hybrid learning environments
Integration of advanced immersive technologies and AI
Enhanced cost-efficiency and institutional resource optimization

13.2 Market challenges

High initial implementation costs and infrastructure barriers
Digital infrastructure disparities and technical latency
Pedagogical resistance and curricular integration challenges

13.3 Impact of drivers and challenges

Impact of drivers and challenges in 2025 and 2030

13.4 Market opportunities

Integration of generative AI and intelligent tutoring systems
Adoption of spatial computing and high-fidelity 3D environments
Implementation of gamified competency-based assessment models

14. Competitive Landscape

14.1 Overview

14.2

Overview on criticality of inputs and factors of differentiation

14.3 Landscape disruption

Overview on factors of disruption

14.4 Industry risks

Impact of key risks on business

15. Competitive Analysis

15.1 Companies profiled

Companies covered

15.2 Company ranking index

15.3 Market positioning of companies

Matrix on companies position and classification

15.4 Beyond Labz Inc.

Beyond Labz Inc. - Overview
Beyond Labz Inc. - Product / Service
Beyond Labz Inc. - Key offerings
SWOT

15.5 Carolina Biological Supply Co.

Carolina Biological Supply Co. - Overview
Carolina Biological Supply Co. - Product / Service
Carolina Biological Supply Co. - Key offerings
SWOT

15.6 Cengage Learning Inc.

Cengage Learning Inc. - Overview
Cengage Learning Inc. - Product / Service
Cengage Learning Inc. - Key offerings
SWOT

15.7 CloudLabs

CloudLabs - Overview
CloudLabs - Product / Service
CloudLabs - Key offerings
SWOT

15.8 Flinn Scientific Inc.

Flinn Scientific Inc. - Overview
Flinn Scientific Inc. - Product / Service
Flinn Scientific Inc. - Key offerings
SWOT

15.9 GIGXR Inc.

GIGXR Inc. - Overview
GIGXR Inc. - Product / Service
GIGXR Inc. - Key offerings
SWOT

15.10 HoloPundits

HoloPundits - Overview
HoloPundits - Product / Service
HoloPundits - Key offerings
SWOT

15.11 Kognity AB

Kognity AB - Overview
Kognity AB - Product / Service
Kognity AB - Key offerings
SWOT

15.12 Labster Group ApS

Labster Group ApS - Overview
Labster Group ApS - Product / Service
Labster Group ApS - Key offerings
SWOT

15.13 McGraw Hill LLC

McGraw Hill LLC - Overview
McGraw Hill LLC - Product / Service
McGraw Hill LLC - Key news
McGraw Hill LLC - Key offerings
SWOT

15.14 MyJoVE Corp.

MyJoVE Corp. - Overview
MyJoVE Corp. - Product / Service
MyJoVE Corp. - Key offerings
SWOT

15.15 Nanome Inc.

Nanome Inc. - Overview
Nanome Inc. - Product / Service
Nanome Inc. - Key offerings
SWOT

15.16 PASCO Scientific Inc.

PASCO Scientific Inc. - Overview
PASCO Scientific Inc. - Product / Service
PASCO Scientific Inc. - Key offerings
SWOT

15.17 Pearson Plc

Pearson Plc - Overview
Pearson Plc - Business segments
Pearson Plc - Key offerings
Pearson Plc - Segment focus
SWOT

15.18 PraxiLabs

PraxiLabs - Overview
PraxiLabs - Product / Service
PraxiLabs - Key offerings
SWOT

16. Appendix

16.1 Scope of the report

Market definition
Objectives
Notes and caveats

16.2 Inclusions and exclusions checklist

Inclusions checklist
Exclusions checklist

16.3 Currency conversion rates for US$

16.4 Research methodology

16.5 Data procurement

Information sources

16.6 Data validation

16.7 Validation techniques employed for market sizing

16.8 Data synthesis

16.9 360 degree market analysis

16.10 List of abbreviations

Research Methodology

Technavio presents a detailed picture of the market by way of study, synthesis, and summation of data from multiple sources. The analysts have presented the various facets of the market with a particular focus on identifying the key industry influencers. The data thus presented is comprehensive, reliable, and the result of extensive research, both primary and secondary.

INFORMATION SOURCES

Primary sources

  • Manufacturers and suppliers
  • Channel partners
  • Industry experts
  • Strategic decision makers

Secondary sources

  • Industry journals and periodicals
  • Government data
  • Financial reports of key industry players
  • Historical data
  • Press releases

DATA ANALYSIS

Data Synthesis

  • Collation of data
  • Estimation of key figures
  • Analysis of derived insights

Data Validation

  • Triangulation with data models
  • Reference against proprietary databases
  • Corroboration with industry experts

REPORT WRITING

Qualitative

  • Market drivers
  • Market challenges
  • Market trends
  • Five forces analysis

Quantitative

  • Market size and forecast
  • Market segmentation
  • Geographical insights
  • Competitive landscape

Interested in this report?

Get your sample now to see our research methodology and insights!

Download Now

Frequently Asked Questions

Virtual Labs For Stem Education market growth will increase by USD 2839.3 million during 2026-2030.

The Virtual Labs For Stem Education market is expected to grow at a CAGR of 15.3% during 2026-2030.

Virtual Labs For Stem Education market is segmented by Type (Simulation tools, VR and AR based labs, AI based STEM education, Others) Application (Higher education, K-12 education, Online STEM learning platforms, Corporate training) Deployment (Cloud based, On premises)

Beyond Labz Inc., Carolina Biological Supply Co., Cengage Learning Inc., CloudLabs, Flinn Scientific Inc., GIGXR Inc., HoloPundits, Kognity AB, Labster Group ApS, McGraw Hill LLC, MyJoVE Corp., Nanome Inc., PASCO Scientific Inc., Pearson Plc, PraxiLabs, Science Interactive Group LLC, Vernier Science Education, VictoryXR Inc., VRLAB ACADEMY LTD., Wards Science. are a few of the key vendors in the Virtual Labs For Stem Education market.

North America will register the highest growth rate of 37.1% among the other regions. Therefore, the Virtual Labs For Stem Education market in North America is expected to garner significant business opportunities for the vendors during the forecast period.

US, Canada, Mexico, UK, Germany, France, Italy, Spain, The Netherlands, China, India, Japan, Australia, South Korea, Indonesia, Saudi Arabia, UAE, South Africa, Israel, Turkey, Brazil, Argentina, Colombia

  • Rising demand for remote and hybrid learning environments is the driving factor this market.

The Virtual Labs For Stem Education market vendors should focus on grabbing business opportunities from the Type segment as it accounted for the largest market share in the base year.
RIA - Research AI Assistant
Ask RIA