Test Preparation Market Analysis, Size, and Forecast 2026-2030: North America (US, Canada, and Mexico), APAC (China, India, and Japan), Europe (Germany, UK, and France), South America (Brazil and Argentina), Middle East and Africa (Saudi Arabia, UAE, and South Africa), and Rest of World (ROW)

Test Preparation Market Analysis, Size, and Forecast 2026-2030:
North America (US, Canada, and Mexico), APAC (China, India, and Japan), Europe (Germany, UK, and France), South America (Brazil and Argentina), Middle East and Africa (Saudi Arabia, UAE, and South Africa), and Rest of World (ROW)

Published: May 2026 291 Pages SKU: IRTNTR76006

Market Overview at a Glance

$58.23 B
Market Opportunity
7.1%
CAGR 2025 - 2030
42.1%
North America Growth
$78.53 B
Blended learning segment 2024

Test Preparation Market Size 2026-2030

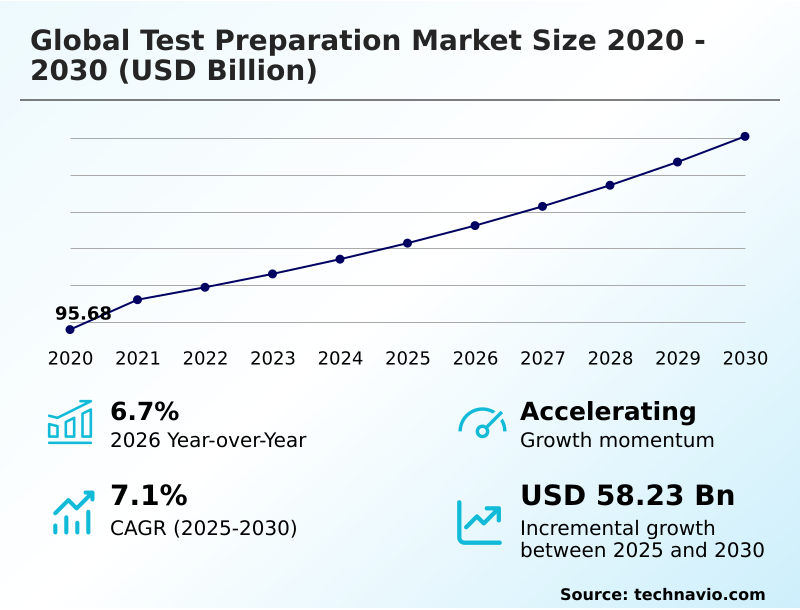
The Test Preparation Market size was valued at USD 142.83 billion in 2025, growing at a CAGR of 7.1% during the forecast period 2026-2030.

Major Market Trends & Insights

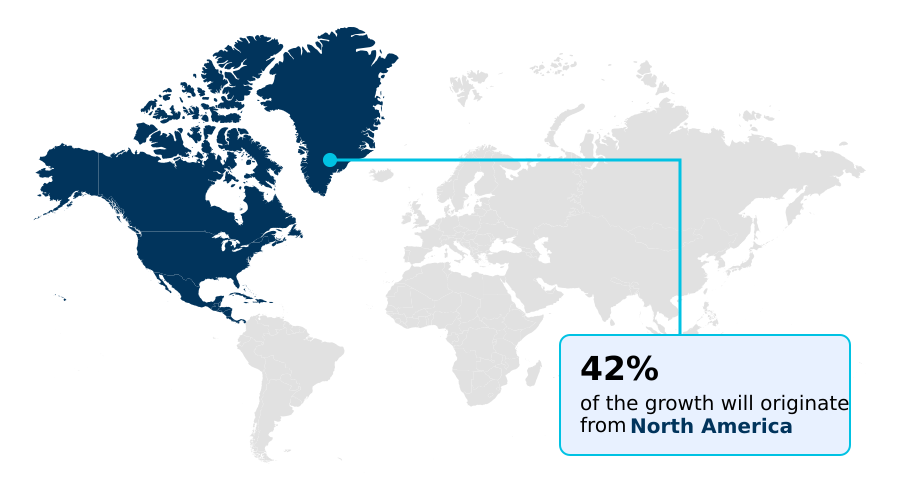
  • North America dominated the market and accounted for a 42.1% growth during the forecast period.
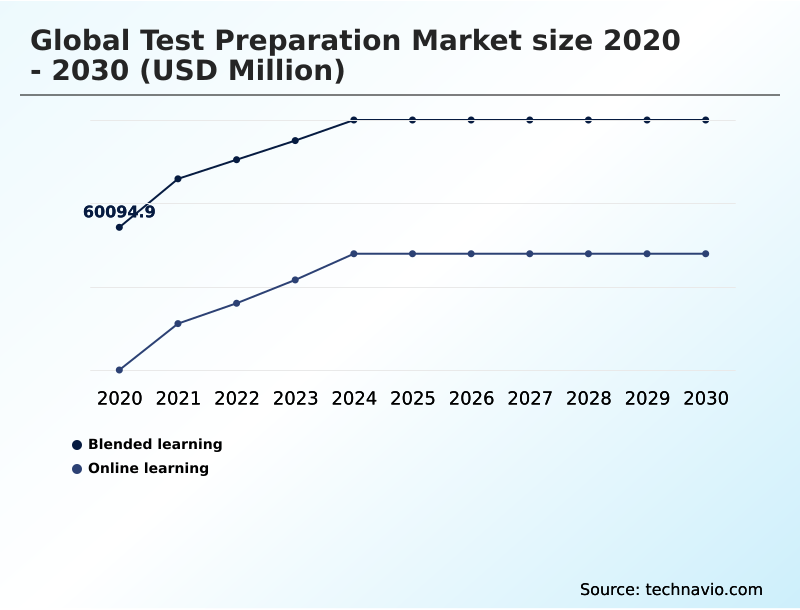
  • By Learning Method - Blended learning segment was valued at USD 78.53 billion in 2024
  • By Product - University exams segment accounted for the largest market revenue share in 2024

Market Size & Forecast

  • Historic Market Opportunities 2020-2024: USD 105.38 billion
  • Market Future Opportunities 2025-2030: USD 58.23 billion
  • CAGR from 2025 to 2030 : 7.1%

Market Summary

  • The test preparation market is undergoing a significant transformation, with a year-over-year growth of 6.7% driven by the adoption of digital-first assessment frameworks. The market, which reached a valuation of $142.8 billion, is characterized by a strategic shift from traditional rote learning to AI-driven, personalized study models.
  • A key driver is the increasing demand for professional certifications, compelling providers to develop modular, mobile-first tools for workforce upskilling. For instance, a provider might pivot its business model from selling one-off exam courses to offering subscription-based access to a portfolio of micro-credentials, boosting recurring revenue by over 20%.
  • However, the market faces a significant challenge from the rise of test-optional policies in higher education. This trend erodes demand for traditional college entrance exam prep and forces companies to diversify into more complex services like soft skill coaching and portfolio development, which are less scalable and carry higher operational costs.

What will be the Size of the Test Preparation Market during the forecast period?

Get Key Insights on Market Forecast (PDF) Request Free Sample

How is the Test Preparation Market Segmented?

The test preparation industry research report provides comprehensive data (region-wise segment analysis), with forecasts and analysis for the period 2026-2030, as well as historical data from 2020-2024 for the following segments.

  • Learning method
    • Blended learning
    • Online learning
  • Product
    • University exams
    • Certifications exams
    • High school exams
    • Elementary exams
    • Others
  • End-user
    • College students
    • Job seekers
    • Working professionals
    • Post-secondary certification
  • Geography
    • North America
      • US
      • Canada
      • Mexico
    • APAC
      • China
      • India
      • Japan
    • Europe
      • Germany
      • UK
      • France
    • South America
      • Brazil
      • Argentina
    • Middle East and Africa
      • Saudi Arabia
      • UAE
      • South Africa
    • Rest of World (ROW)

How is the Test Preparation Market Segmented by Learning Method?

The blended learning segment is estimated to witness significant growth during the forecast period.

The blended learning segment, which accounts for 57.6% of the market, integrates digital modularity with traditional instruction, showing 15% higher student engagement than purely online formats.

This hybrid approach utilizes a flipped classroom strategy, where asynchronous learning models like online video lectures precede synchronous virtual sessions focused on complex problem-solving. This structure optimizes instructor time by over 30%, automating content delivery to focus on personalized coaching.

Key blended learning models incorporate diagnostic assessments to tailor content, making it a preferred choice for university entrance exams where nuanced feedback is critical.

Request Free Sample

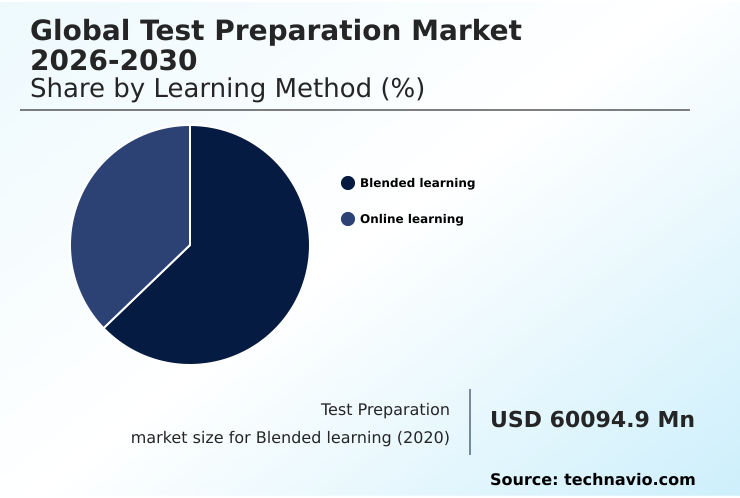
The Blended learning segment was valued at USD 78.53 billion in 2024 and showed a gradual increase during the forecast period.

Request Free Sample

How demand for the Test Preparation market is rising in the leading region?

North America is estimated to contribute 42.1% to the growth of the global market during the forecast period.Technavio’s analysts have elaborately explained the regional trends and drivers that shape the market during the forecast period.

See How Test Preparation Market demand is rising in North America Request Free Sample

The geographic landscape of the test preparation market is primarily dominated by North America and APAC, which together account for over 83% of the market's incremental growth.

While North America leads with a 42.1% share of this growth, APAC is closing the gap with a 7.9% CAGR, slightly higher than North America's 7.6%.

This difference is rooted in market maturity; North America's market, with the US representing a $46.2 billion opportunity, is driven by high-stakes professional licensure and graduate school exams that demand sophisticated predictive score modeling.

In contrast, growth in APAC, led by countries like China and India, is fueled by an immense volume of students preparing for university entrance exams, driving demand for scalable and affordable mobile-first prep tools.

This dynamic requires providers to adopt dual strategies: one focused on advanced, feature-rich platforms for the West and another on accessible, high-volume solutions for the East, impacting everything from product design to pricing.

What are the key Drivers, Trends, and Challenges in the Test Preparation Market?

Our researchers analyzed the data with 2025 as the base year, along with the key drivers, trends, and challenges. A holistic analysis of drivers will help companies refine their marketing strategies to gain a competitive advantage.

  • The strategic approach to the global test preparation market is becoming increasingly nuanced as providers address distinct user needs. For instance, test preparation for university exams is shifting from simple content review to sophisticated strategy coaching, with platforms demonstrating a 15% higher score improvement through adaptive learning.
  • The integration of AI in test preparation is central to this evolution, enabling personalized study plans that can improve study efficiency by up to 30%. This technological advancement also fuels the debate around blended vs online test prep effectiveness, with data showing that hybrid models combining asynchronous and synchronous learning yield higher completion rates.
  • Concurrently, the demand for test preparation for professional certifications is surging as corporations prioritize upskilling, creating a segment that is growing 1.5 times faster than the academic prep market. This trend signals that the future of standardized testing and prep lies in specialization, continuous learning, and measurable outcomes.
  • Providers must now demonstrate clear ROI, whether through career advancement or academic placement, to succeed in a market where the value of a test score is constantly being re-evaluated.

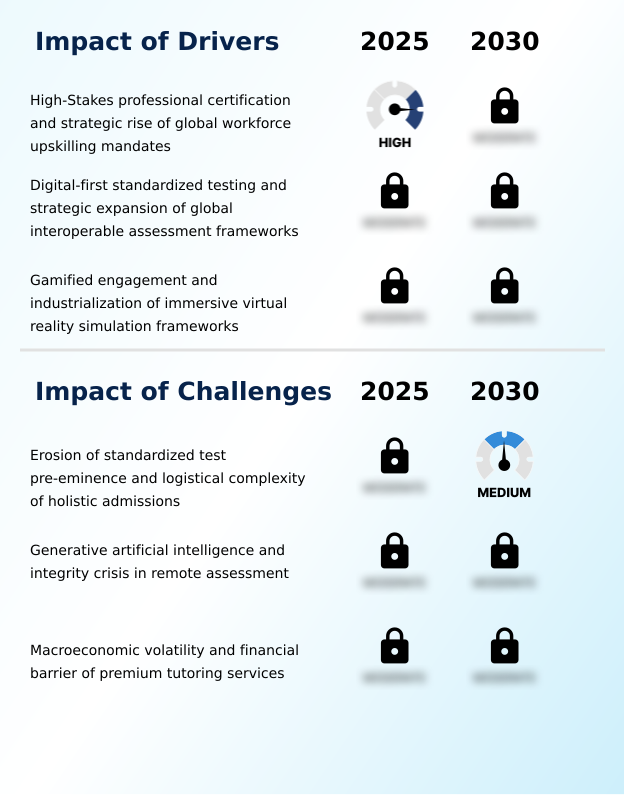
What are the key market drivers leading to the rise in the adoption of Test Preparation Industry?

  • The strategic rise of global workforce upskilling mandates and the persistent importance of high-stakes professional certifications are primary drivers of market growth.

  • The market is propelled by the increasing emphasis on high-stakes certification and global workforce upskilling mandates, which have driven a 19% rise in professional exam enrollment.
  • As automation transforms industries, companies are prioritizing competency-based hiring, making verifiable credentials more valuable than ever. This creates a strong demand for outcome-oriented preparation focused on professional licensure and technical skills.
  • Test preparation providers are responding by offering services that go beyond academic tests to support career-long learning.
  • This strategic expansion into the corporate training sector leverages the need for a demonstrably skilled workforce, cementing test preparation's role in the lifelong learning ecosystem.

What are the market trends shaping the Test Preparation Industry?

  • The proliferation of microlearning is reshaping test preparation, with a definitive shift toward modular, just-in-time knowledge bursts.

  • A primary trend reshaping the test preparation market is the proliferation of microlearning platforms, which deliver bite-sized modules and just-in-time knowledge. This shift away from lengthy study sessions caters to modern learners' reduced attention spans and mobile-first habits, with platforms integrating this approach reporting a 20% increase in daily user engagement.
  • The methodology relies on gamified engagement and AI-driven spaced repetition systems, which present information at optimized intervals to enhance retention. This move toward frictionless education allows for continuous learning, integrating study into daily routines. As a result, asynchronous learning models are becoming the standard, offering flexibility and personalization that traditional methods cannot match.

What challenges does the Test Preparation Industry face during its growth?

  • A key challenge is the erosion of standardized test pre-eminence, compounded by the logistical complexity of holistic admissions processes.

  • A significant challenge confronting the market is the erosion of demand due to widespread test-optional policies, which has reduced revenue from traditional exam prep by up to 15% for some providers. This trend, coupled with the logistical complexity of holistic admissions criteria, forces a difficult pivot from scalable content-based drilling to labor-intensive soft skill coaching and portfolio development.
  • The integrity crisis in remote assessment further complicates operations, requiring heavy investment in security. This environment creates instability, as providers must cater to a fragmented market while grappling with the perception that the skills-based economy offers viable alternatives to standardized testing, such as alternative digital badges.

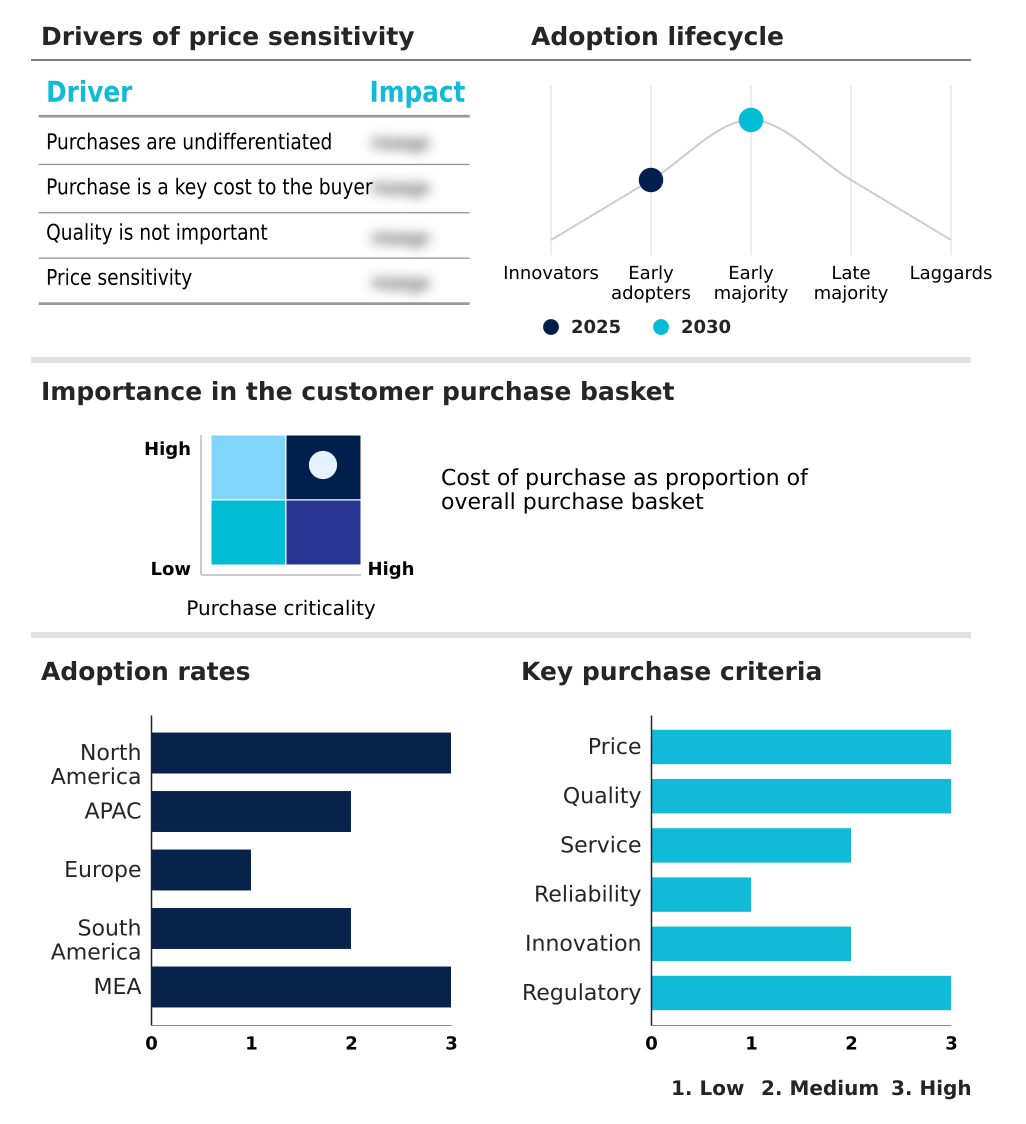
Exclusive Technavio Analysis on Customer Landscape

The test preparation market forecasting report includes the adoption lifecycle of the market, covering from the innovator’s stage to the laggard’s stage. It focuses on adoption rates in different regions based on penetration. Furthermore, the test preparation market report also includes key purchase criteria and drivers of price sensitivity to help companies evaluate and develop their market growth analysis strategies.

Customer Landscape of Test Preparation Industry

Competitive Landscape

Companies are implementing various strategies, such as strategic alliances, test preparation market forecast, partnerships, mergers and acquisitions, geographical expansion, and product/service launches, to enhance their presence in the industry.

Blueprint Test Preparation LLC - Core offerings center on AI-driven adaptive learning platforms, personalized study plans, and diagnostic assessments for high-stakes academic and professional examinations.

The industry research and growth report includes detailed analyses of the competitive landscape of the market and information about key companies, including:

  • Blueprint Test Preparation LLC
  • FIITJEE Ltd.
  • Google LLC
  • Graham Holdings Co.
  • IMS Learning Resources Pvt. Ltd
  • Khan Academy Inc.
  • Magoosh
  • Manipal Global Edu Services
  • Pearson Plc
  • PrepScholar
  • Quizlet Inc.
  • Simplilearn Solutions Pvt. Ltd
  • Sorting Hat Technologies Ltd.
  • Test Innovators
  • Think and Learn Pvt. Ltd.
  • TPR Education LLC
  • Tutor.com Inc.
  • Udemy Inc.
  • Varsity Tutors LLC
  • Vedantu Innovations Pvt. Ltd.

Qualitative and quantitative analysis of companies has been conducted to help clients understand the wider business environment as well as the strengths and weaknesses of key industry players. Data is qualitatively analyzed to categorize companies as pure play, category-focused, industry-focused, and diversified; it is quantitatively analyzed to categorize companies as dominant, leading, strong, tentative, and weak.

Market Intelligence Radar: High-Impact Developments & Growth Signals

  • In the Education Services industry, the integration of AI to create personalized learning paths at scale is now standard, directly compelling test preparation providers to adopt AI-powered tutoring bots and predictive score modeling to remain competitive.
  • A broader shift toward competency-based digital credentialing over traditional degrees is expanding the market for high-stakes certification, driving demand for test preparation services focused on workforce upskilling and professional licensure.
  • Corporate mandates for continuous workforce upskilling have solidified the lifelong learning ecosystem, creating a sustained B2B demand channel for test preparation providers that offer modular and mobile-first prep tools for professional certifications.
  • Heightened data privacy regulations, such as GDPR and similar frameworks, have increased the compliance burden, forcing providers to invest heavily in secure remote proctoring integrity and transparent data handling to maintain user trust in remote assessment environments.

Dive into Technavio’s robust research methodology, blending expert interviews, extensive data synthesis, and validated models for unparalleled Test Preparation Market insights. See full methodology.

Market Scope
Page number 291
Base year 2025
Historic period 2020-2024
Forecast period 2026-2030
Growth momentum & CAGR Accelerate at a CAGR of 7.1%
Market growth 2026-2030 USD 58231.1 million
Market structure Fragmented
YoY growth 2025-2026(%) 6.7%
Key countries US, Canada, Mexico, China, India, Japan, South Korea, Australia, Indonesia, Germany, UK, France, Italy, The Netherlands, Spain, Brazil, Argentina, Chile, Saudi Arabia, UAE, South Africa, Israel and Turkey
Competitive landscape Leading Companies, Market Positioning of Companies, Competitive Strategies, and Industry Risks

Request Free Sample

Research Analyst Overview

  • The test preparation market ecosystem is a complex network where content and technology suppliers hold significant influence, with high-quality diagnostic assessments forming the backbone of services for over 80% of providers. Key stakeholders include subject matter experts and educational publishers who supply the core instructional content, while technology firms provide the AI-powered tutoring bots and adaptive learning algorithms.
  • Test-administering bodies, such as the College Board, act as de facto regulators, setting the standards that the entire industry must follow. Distribution is increasingly direct-to-consumer via online learning platforms and mobile apps.
  • This model is shaped by the end-users—students and professionals—whose moderate bargaining power and high price sensitivity, as noted in customer landscape analyses, pressure providers to demonstrate a clear and measurable ROI, with platforms showing verifiable score improvements capturing 25% more market share.

What are the Key Data Covered in this Test Preparation Market Research and Growth Report?

  • What is the expected growth of the Test Preparation Market between 2026 and 2030?

    • The Test Preparation Market is expected to grow by USD 58.23 billion during 2026-2030, registering a CAGR of 7.1%. Year-over-year growth in 2026 is estimated at 6.7%%. This acceleration is shaped by high-stakes professional certification and strategic rise of global workforce upskilling mandates, which is intensifying demand across multiple end-use verticals covered in the report.

  • What segmentation does the market report cover?

    • The report is segmented by Learning Method (Blended learning, and Online learning), Product (University exams, Certifications exams, High school exams, Elementary exams, and Others), End-user (College students, Job seekers, Working professionals, and Post-secondary certification) and Geography (North America, APAC, Europe, South America, Middle East and Africa). Among these, the Blended learning segment is estimated to witness significant growth during the forecast period, driven by rising adoption across key application areas. Each segment includes detailed qualitative and quantitative analysis, along with historical data from 2020-2024 and forecasts through 2030 with year-over-year growth rates.

  • Which regions are analyzed in the report?

    • The report covers North America, APAC, Europe, South America and Middle East and Africa. North America is estimated to contribute 42.1% to market growth during the forecast period. Country-level analysis includes US, Canada, Mexico, China, India, Japan, South Korea, Australia, Indonesia, Germany, UK, France, Italy, The Netherlands, Spain, Brazil, Argentina, Chile, Saudi Arabia, UAE, South Africa, Israel and Turkey, with dedicated market size tables and year-over-year growth for each.

  • What are the key growth drivers and market challenges?

    • The primary driver is high-stakes professional certification and strategic rise of global workforce upskilling mandates, which is accelerating investment and industry demand. The main challenge is erosion of standardized test pre-eminence and logistical complexity of holistic admissions, creating operational barriers for key market participants. The report quantifies the impact of each driver and challenge across 2026 and 2030 with comparative analysis.

  • Who are the major players in the Test Preparation Market?

    • Key vendors include Blueprint Test Preparation LLC, FIITJEE Ltd., Google LLC, Graham Holdings Co., IMS Learning Resources Pvt. Ltd, Khan Academy Inc., Magoosh, Manipal Global Edu Services, Pearson Plc, PrepScholar, Quizlet Inc., Simplilearn Solutions Pvt. Ltd, Sorting Hat Technologies Ltd., Test Innovators, Think and Learn Pvt. Ltd., TPR Education LLC, Tutor.com Inc., Udemy Inc., Varsity Tutors LLC and Vedantu Innovations Pvt. Ltd.. The report provides qualitative and quantitative analysis categorizing companies as dominant, leading, strong, tentative, and weak based on their market positioning. Company profiles include business segment analysis, SWOT assessment, key offerings, and recent strategic developments.

Market Research Insights

  • The competitive landscape of the test preparation market, where North America accounts for 42.1% of incremental growth, is defined by a race toward technological superiority. Key vendors such as Pearson Plc and Graham Holdings Co. are moving beyond content delivery to become end-to-end credentialing partners.
  • For example, Pearson's integration of its AI-powered tools within Microsoft 365 and its role as the test provider for Google Cloud certifications highlight a strategic pivot, resulting in a 15% increase in B2B engagement. Similarly, Graham Holdings' subsidiary, Kaplan, continues to refine its adaptive learning technology to personalize study paths.
  • This innovation is a direct response to the primary industry challenge: maintaining relevance and proving value in an environment where test-optional policies and free online resources are gaining traction, requiring continuous investment in R&D to stay ahead.

We can help! Our analysts can customize this test preparation market research report to meet your requirements.

Get in touch

1. Executive Summary

1.1 Market overview

Executive Summary - Chart on Market Overview
Executive Summary - Data Table on Market Overview
Executive Summary - Chart on Global Market Characteristics
Executive Summary - Chart on Market by Geography
Executive Summary - Chart on Market Segmentation by Learning Method
Executive Summary - Chart on Market Segmentation by Product
Executive Summary - Chart on Market Segmentation by End-user
Executive Summary - Chart on Incremental Growth
Executive Summary - Data Table on Incremental Growth
Executive Summary - Chart on Company Market Positioning

2. Technavio Analysis

2.1 Analysis of price sensitivity, lifecycle, customer purchase basket, adoption rates, and purchase criteria

2.2 Criticality of inputs and Factors of differentiation

Chart on Overview on criticality of inputs and factors of differentiation

2.3 Factors of disruption

Chart on Overview on factors of disruption

2.4 Impact of drivers and challenges

Chart on Impact of drivers and challenges in 2025 and 2030

3. Market Landscape

3.1 Market ecosystem

Chart on Parent Market
Data Table on - Parent Market

3.2 Market characteristics

Chart on Market characteristics analysis

3.3 Value chain analysis

Chart on Value chain analysis

4. Market Sizing

4.1 Market definition

Data Table on Offerings of companies included in the market definition

4.2 Market segment analysis

Market segments

4.3 Market size 2025

4.4 Market outlook: Forecast for 2025-2030

Chart on Global - Market size and forecast 2025-2030 ($ million)
Data Table on Global - Market size and forecast 2025-2030 ($ million)
Chart on Global Market: Year-over-year growth 2025-2030 (%)
Data Table on Global Market: Year-over-year growth 2025-2030 (%)

5. Historic Market Size

5.1 Global Test Preparation Market 2020 - 2024

Historic Market Size - Data Table on Global Test Preparation Market 2020 - 2024 ($ million)

5.2 Learning Method segment analysis 2020 - 2024

Historic Market Size - Learning Method Segment 2020 - 2024 ($ million)

5.3 Product segment analysis 2020 - 2024

Historic Market Size - Product Segment 2020 - 2024 ($ million)

5.4 End-user segment analysis 2020 - 2024

Historic Market Size - End-user Segment 2020 - 2024 ($ million)

5.5 Geography segment analysis 2020 - 2024

Historic Market Size - Geography Segment 2020 - 2024 ($ million)

5.6 Country segment analysis 2020 - 2024

Historic Market Size - Country Segment 2020 - 2024 ($ million)

6. Qualitative Analysis

6.1 Impact of AI in global test preparation market

6.2 Impact of geopolitical conflict for global test preparation market

7. Five Forces Analysis

7.1 Five forces summary

Five forces analysis - Comparison between 2025 and 2030

7.2 Bargaining power of buyers

Bargaining power of buyers - Impact of key factors 2025 and 2030

7.3 Bargaining power of suppliers

Bargaining power of suppliers - Impact of key factors in 2025 and 2030

7.4 Threat of new entrants

Threat of new entrants - Impact of key factors in 2025 and 2030

7.5 Threat of substitutes

Threat of substitutes - Impact of key factors in 2025 and 2030

7.6 Threat of rivalry

Threat of rivalry - Impact of key factors in 2025 and 2030

7.7 Market condition

Chart on Market condition - Five forces 2025 and 2030

8. Market Segmentation by Learning Method

8.1 Market segments

Chart on Learning Method - Market share 2025-2030 (%)
Data Table on Learning Method - Market share 2025-2030 (%)

8.2 Comparison by Learning Method

Chart on Comparison by Learning Method
Data Table on Comparison by Learning Method

8.3 Blended learning - Market size and forecast 2025-2030

Chart on Blended learning - Market size and forecast 2025-2030 ($ million)
Data Table on Blended learning - Market size and forecast 2025-2030 ($ million)
Chart on Blended learning - Year-over-year growth 2025-2030 (%)
Data Table on Blended learning - Year-over-year growth 2025-2030 (%)

8.4 Online learning - Market size and forecast 2025-2030

Chart on Online learning - Market size and forecast 2025-2030 ($ million)
Data Table on Online learning - Market size and forecast 2025-2030 ($ million)
Chart on Online learning - Year-over-year growth 2025-2030 (%)
Data Table on Online learning - Year-over-year growth 2025-2030 (%)

8.5 Market opportunity by Learning Method

Market opportunity by Learning Method ($ million)
Data Table on Market opportunity by Learning Method ($ million)

9. Market Segmentation by Product

9.1 Market segments

Chart on Product - Market share 2025-2030 (%)
Data Table on Product - Market share 2025-2030 (%)

9.2 Comparison by Product

Chart on Comparison by Product
Data Table on Comparison by Product

9.3 University exams - Market size and forecast 2025-2030

Chart on University exams - Market size and forecast 2025-2030 ($ million)
Data Table on University exams - Market size and forecast 2025-2030 ($ million)
Chart on University exams - Year-over-year growth 2025-2030 (%)
Data Table on University exams - Year-over-year growth 2025-2030 (%)

9.4 Certifications exams - Market size and forecast 2025-2030

Chart on Certifications exams - Market size and forecast 2025-2030 ($ million)
Data Table on Certifications exams - Market size and forecast 2025-2030 ($ million)
Chart on Certifications exams - Year-over-year growth 2025-2030 (%)
Data Table on Certifications exams - Year-over-year growth 2025-2030 (%)

9.5 High school exams - Market size and forecast 2025-2030

Chart on High school exams - Market size and forecast 2025-2030 ($ million)
Data Table on High school exams - Market size and forecast 2025-2030 ($ million)
Chart on High school exams - Year-over-year growth 2025-2030 (%)
Data Table on High school exams - Year-over-year growth 2025-2030 (%)

9.6 Elementary exams - Market size and forecast 2025-2030

Chart on Elementary exams - Market size and forecast 2025-2030 ($ million)
Data Table on Elementary exams - Market size and forecast 2025-2030 ($ million)
Chart on Elementary exams - Year-over-year growth 2025-2030 (%)
Data Table on Elementary exams - Year-over-year growth 2025-2030 (%)

9.7 Others - Market size and forecast 2025-2030

Chart on Others - Market size and forecast 2025-2030 ($ million)
Data Table on Others - Market size and forecast 2025-2030 ($ million)
Chart on Others - Year-over-year growth 2025-2030 (%)
Data Table on Others - Year-over-year growth 2025-2030 (%)

9.8 Market opportunity by Product

Market opportunity by Product ($ million)
Data Table on Market opportunity by Product ($ million)

10. Market Segmentation by End-user

10.1 Market segments

Chart on End-user - Market share 2025-2030 (%)
Data Table on End-user - Market share 2025-2030 (%)

10.2 Comparison by End-user

Chart on Comparison by End-user
Data Table on Comparison by End-user

10.3 College students - Market size and forecast 2025-2030

Chart on College students - Market size and forecast 2025-2030 ($ million)
Data Table on College students - Market size and forecast 2025-2030 ($ million)
Chart on College students - Year-over-year growth 2025-2030 (%)
Data Table on College students - Year-over-year growth 2025-2030 (%)

10.4 Job seekers - Market size and forecast 2025-2030

Chart on Job seekers - Market size and forecast 2025-2030 ($ million)
Data Table on Job seekers - Market size and forecast 2025-2030 ($ million)
Chart on Job seekers - Year-over-year growth 2025-2030 (%)
Data Table on Job seekers - Year-over-year growth 2025-2030 (%)

10.5 Working professionals - Market size and forecast 2025-2030

Chart on Working professionals - Market size and forecast 2025-2030 ($ million)
Data Table on Working professionals - Market size and forecast 2025-2030 ($ million)
Chart on Working professionals - Year-over-year growth 2025-2030 (%)
Data Table on Working professionals - Year-over-year growth 2025-2030 (%)

10.6 Post-secondary certification - Market size and forecast 2025-2030

Chart on Post-secondary certification - Market size and forecast 2025-2030 ($ million)
Data Table on Post-secondary certification - Market size and forecast 2025-2030 ($ million)
Chart on Post-secondary certification - Year-over-year growth 2025-2030 (%)
Data Table on Post-secondary certification - Year-over-year growth 2025-2030 (%)

10.7 Market opportunity by End-user

Market opportunity by End-user ($ million)
Data Table on Market opportunity by End-user ($ million)

11. Customer Landscape

11.1 Customer landscape overview

Analysis of price sensitivity, lifecycle, customer purchase basket, adoption rates, and purchase criteria

12. Geographic Landscape

12.1 Geographic segmentation

Chart on Market share by geography 2025-2030 (%)
Data Table on Market share by geography 2025-2030 (%)

12.2 Geographic comparison

Chart on Geographic comparison
Data Table on Geographic comparison

12.3 North America - Market size and forecast 2025-2030

Chart on North America - Market size and forecast 2025-2030 ($ million)
Data Table on North America - Market size and forecast 2025-2030 ($ million)
Chart on North America - Year-over-year growth 2025-2030 (%)
Data Table on North America - Year-over-year growth 2025-2030 (%)
Chart on Regional Comparison - North America
Data Table on Regional Comparison - North America

12.3.1 US - Market size and forecast 2025-2030

Chart on US - Market size and forecast 2025-2030 ($ million)
Data Table on US - Market size and forecast 2025-2030 ($ million)
Chart on US - Year-over-year growth 2025-2030 (%)
Data Table on US - Year-over-year growth 2025-2030 (%)

12.3.2 Canada - Market size and forecast 2025-2030

Chart on Canada - Market size and forecast 2025-2030 ($ million)
Data Table on Canada - Market size and forecast 2025-2030 ($ million)
Chart on Canada - Year-over-year growth 2025-2030 (%)
Data Table on Canada - Year-over-year growth 2025-2030 (%)

12.3.3 Mexico - Market size and forecast 2025-2030

Chart on Mexico - Market size and forecast 2025-2030 ($ million)
Data Table on Mexico - Market size and forecast 2025-2030 ($ million)
Chart on Mexico - Year-over-year growth 2025-2030 (%)
Data Table on Mexico - Year-over-year growth 2025-2030 (%)

12.4 APAC - Market size and forecast 2025-2030

Chart on APAC - Market size and forecast 2025-2030 ($ million)
Data Table on APAC - Market size and forecast 2025-2030 ($ million)
Chart on APAC - Year-over-year growth 2025-2030 (%)
Data Table on APAC - Year-over-year growth 2025-2030 (%)
Chart on Regional Comparison - APAC
Data Table on Regional Comparison - APAC

12.4.1 China - Market size and forecast 2025-2030

Chart on China - Market size and forecast 2025-2030 ($ million)
Data Table on China - Market size and forecast 2025-2030 ($ million)
Chart on China - Year-over-year growth 2025-2030 (%)
Data Table on China - Year-over-year growth 2025-2030 (%)

12.4.2 India - Market size and forecast 2025-2030

Chart on India - Market size and forecast 2025-2030 ($ million)
Data Table on India - Market size and forecast 2025-2030 ($ million)
Chart on India - Year-over-year growth 2025-2030 (%)
Data Table on India - Year-over-year growth 2025-2030 (%)

12.4.3 Japan - Market size and forecast 2025-2030

Chart on Japan - Market size and forecast 2025-2030 ($ million)
Data Table on Japan - Market size and forecast 2025-2030 ($ million)
Chart on Japan - Year-over-year growth 2025-2030 (%)
Data Table on Japan - Year-over-year growth 2025-2030 (%)

12.4.4 South Korea - Market size and forecast 2025-2030

Chart on South Korea - Market size and forecast 2025-2030 ($ million)
Data Table on South Korea - Market size and forecast 2025-2030 ($ million)
Chart on South Korea - Year-over-year growth 2025-2030 (%)
Data Table on South Korea - Year-over-year growth 2025-2030 (%)

12.4.5 Australia - Market size and forecast 2025-2030

Chart on Australia - Market size and forecast 2025-2030 ($ million)
Data Table on Australia - Market size and forecast 2025-2030 ($ million)
Chart on Australia - Year-over-year growth 2025-2030 (%)
Data Table on Australia - Year-over-year growth 2025-2030 (%)

12.4.6 Indonesia - Market size and forecast 2025-2030

Chart on Indonesia - Market size and forecast 2025-2030 ($ million)
Data Table on Indonesia - Market size and forecast 2025-2030 ($ million)
Chart on Indonesia - Year-over-year growth 2025-2030 (%)
Data Table on Indonesia - Year-over-year growth 2025-2030 (%)

12.5 Europe - Market size and forecast 2025-2030

Chart on Europe - Market size and forecast 2025-2030 ($ million)
Data Table on Europe - Market size and forecast 2025-2030 ($ million)
Chart on Europe - Year-over-year growth 2025-2030 (%)
Data Table on Europe - Year-over-year growth 2025-2030 (%)
Chart on Regional Comparison - Europe
Data Table on Regional Comparison - Europe

12.5.1 Germany - Market size and forecast 2025-2030

Chart on Germany - Market size and forecast 2025-2030 ($ million)
Data Table on Germany - Market size and forecast 2025-2030 ($ million)
Chart on Germany - Year-over-year growth 2025-2030 (%)
Data Table on Germany - Year-over-year growth 2025-2030 (%)

12.5.2 UK - Market size and forecast 2025-2030

Chart on UK - Market size and forecast 2025-2030 ($ million)
Data Table on UK - Market size and forecast 2025-2030 ($ million)
Chart on UK - Year-over-year growth 2025-2030 (%)
Data Table on UK - Year-over-year growth 2025-2030 (%)

12.5.3 France - Market size and forecast 2025-2030

Chart on France - Market size and forecast 2025-2030 ($ million)
Data Table on France - Market size and forecast 2025-2030 ($ million)
Chart on France - Year-over-year growth 2025-2030 (%)
Data Table on France - Year-over-year growth 2025-2030 (%)

12.5.4 Italy - Market size and forecast 2025-2030

Chart on Italy - Market size and forecast 2025-2030 ($ million)
Data Table on Italy - Market size and forecast 2025-2030 ($ million)
Chart on Italy - Year-over-year growth 2025-2030 (%)
Data Table on Italy - Year-over-year growth 2025-2030 (%)

12.5.5 The Netherlands - Market size and forecast 2025-2030

Chart on The Netherlands - Market size and forecast 2025-2030 ($ million)
Data Table on The Netherlands - Market size and forecast 2025-2030 ($ million)
Chart on The Netherlands - Year-over-year growth 2025-2030 (%)
Data Table on The Netherlands - Year-over-year growth 2025-2030 (%)

12.5.6 Spain - Market size and forecast 2025-2030

Chart on Spain - Market size and forecast 2025-2030 ($ million)
Data Table on Spain - Market size and forecast 2025-2030 ($ million)
Chart on Spain - Year-over-year growth 2025-2030 (%)
Data Table on Spain - Year-over-year growth 2025-2030 (%)

12.6 South America - Market size and forecast 2025-2030

Chart on South America - Market size and forecast 2025-2030 ($ million)
Data Table on South America - Market size and forecast 2025-2030 ($ million)
Chart on South America - Year-over-year growth 2025-2030 (%)
Data Table on South America - Year-over-year growth 2025-2030 (%)
Chart on Regional Comparison - South America
Data Table on Regional Comparison - South America

12.6.1 Brazil - Market size and forecast 2025-2030

Chart on Brazil - Market size and forecast 2025-2030 ($ million)
Data Table on Brazil - Market size and forecast 2025-2030 ($ million)
Chart on Brazil - Year-over-year growth 2025-2030 (%)
Data Table on Brazil - Year-over-year growth 2025-2030 (%)

12.6.2 Argentina - Market size and forecast 2025-2030

Chart on Argentina - Market size and forecast 2025-2030 ($ million)
Data Table on Argentina - Market size and forecast 2025-2030 ($ million)
Chart on Argentina - Year-over-year growth 2025-2030 (%)
Data Table on Argentina - Year-over-year growth 2025-2030 (%)

12.6.3 Chile - Market size and forecast 2025-2030

Chart on Chile - Market size and forecast 2025-2030 ($ million)
Data Table on Chile - Market size and forecast 2025-2030 ($ million)
Chart on Chile - Year-over-year growth 2025-2030 (%)
Data Table on Chile - Year-over-year growth 2025-2030 (%)

12.7 Middle East and Africa - Market size and forecast 2025-2030

Chart on Middle East and Africa - Market size and forecast 2025-2030 ($ million)
Data Table on Middle East and Africa - Market size and forecast 2025-2030 ($ million)
Chart on Middle East and Africa - Year-over-year growth 2025-2030 (%)
Data Table on Middle East and Africa - Year-over-year growth 2025-2030 (%)
Chart on Regional Comparison - Middle East and Africa
Data Table on Regional Comparison - Middle East and Africa

12.7.1 Saudi Arabia - Market size and forecast 2025-2030

Chart on Saudi Arabia - Market size and forecast 2025-2030 ($ million)
Data Table on Saudi Arabia - Market size and forecast 2025-2030 ($ million)
Chart on Saudi Arabia - Year-over-year growth 2025-2030 (%)
Data Table on Saudi Arabia - Year-over-year growth 2025-2030 (%)

12.7.2 UAE - Market size and forecast 2025-2030

Chart on UAE - Market size and forecast 2025-2030 ($ million)
Data Table on UAE - Market size and forecast 2025-2030 ($ million)
Chart on UAE - Year-over-year growth 2025-2030 (%)
Data Table on UAE - Year-over-year growth 2025-2030 (%)

12.7.3 South Africa - Market size and forecast 2025-2030

Chart on South Africa - Market size and forecast 2025-2030 ($ million)
Data Table on South Africa - Market size and forecast 2025-2030 ($ million)
Chart on South Africa - Year-over-year growth 2025-2030 (%)
Data Table on South Africa - Year-over-year growth 2025-2030 (%)

12.7.4 Israel - Market size and forecast 2025-2030

Chart on Israel - Market size and forecast 2025-2030 ($ million)
Data Table on Israel - Market size and forecast 2025-2030 ($ million)
Chart on Israel - Year-over-year growth 2025-2030 (%)
Data Table on Israel - Year-over-year growth 2025-2030 (%)

12.7.5 Turkey - Market size and forecast 2025-2030

Chart on Turkey - Market size and forecast 2025-2030 ($ million)
Data Table on Turkey - Market size and forecast 2025-2030 ($ million)
Chart on Turkey - Year-over-year growth 2025-2030 (%)
Data Table on Turkey - Year-over-year growth 2025-2030 (%)

12.8 Market opportunity by geography

Market opportunity by geography ($ million)
Data Tables on Market opportunity by geography ($ million)

13. Drivers, Challenges, and Opportunity

13.1 Market drivers

High-Stakes professional certification and strategic rise of global workforce upskilling mandates
Digital-first standardized testing and strategic expansion of global interoperable assessment frameworks
Gamified engagement and industrialization of immersive virtual reality simulation frameworks

13.2 Market challenges

Erosion of standardized test pre-eminence and logistical complexity of holistic admissions
Generative artificial intelligence and integrity crisis in remote assessment
Macroeconomic volatility and financial barrier of premium tutoring services

13.3 Impact of drivers and challenges

Impact of drivers and challenges in 2025 and 2030

13.4 Market opportunities

Proliferation of microlearning and modular, just-in-time knowledge bursts
Expansion of community-led social learning and peer-to-peer enablement
Transition toward evidence-based efficacy and measurable ROI frameworks

14. Competitive Landscape

14.1 Overview

14.2

Overview on criticality of inputs and factors of differentiation

14.3 Landscape disruption

Overview on factors of disruption

14.4 Industry risks

Impact of key risks on business

15. Competitive Analysis

15.1 Companies profiled

Companies covered

15.2 Company ranking index

15.3 Market positioning of companies

Matrix on companies position and classification

15.4 Blueprint Test Preparation LLC

Blueprint Test Preparation LLC - Overview
Blueprint Test Preparation LLC - Product / Service
Blueprint Test Preparation LLC - Key offerings
SWOT

15.5 Google LLC

Google LLC - Overview
Google LLC - Product / Service
Google LLC - Key offerings
SWOT

15.6 Graham Holdings Co.

Graham Holdings Co. - Overview
Graham Holdings Co. - Business segments
Graham Holdings Co. - Key offerings
Graham Holdings Co. - Segment focus
SWOT

15.7 Khan Academy Inc.

Khan Academy Inc. - Overview
Khan Academy Inc. - Product / Service
Khan Academy Inc. - Key offerings
SWOT

15.8 Magoosh

Magoosh - Overview
Magoosh - Product / Service
Magoosh - Key offerings
SWOT

15.9 Manipal Global Edu Services

Manipal Global Edu Services - Overview
Manipal Global Edu Services - Product / Service
Manipal Global Edu Services - Key offerings
SWOT

15.10 Pearson Plc

Pearson Plc - Overview
Pearson Plc - Business segments
Pearson Plc - Key news
Pearson Plc - Key offerings
Pearson Plc - Segment focus
SWOT

15.11 Quizlet Inc.

Quizlet Inc. - Overview
Quizlet Inc. - Product / Service
Quizlet Inc. - Key offerings
SWOT

15.12 Simplilearn Solutions Pvt. Ltd

Simplilearn Solutions Pvt. Ltd - Overview
Simplilearn Solutions Pvt. Ltd - Product / Service
Simplilearn Solutions Pvt. Ltd - Key offerings
SWOT

15.13 Sorting Hat Technologies Ltd.

Sorting Hat Technologies Ltd. - Overview
Sorting Hat Technologies Ltd. - Product / Service
Sorting Hat Technologies Ltd. - Key offerings
SWOT

15.14 Think and Learn Pvt. Ltd.

Think and Learn Pvt. Ltd. - Overview
Think and Learn Pvt. Ltd. - Product / Service
Think and Learn Pvt. Ltd. - Key offerings
SWOT

15.15 TPR Education LLC

TPR Education LLC - Overview
TPR Education LLC - Product / Service
TPR Education LLC - Key offerings
SWOT

15.16 Tutor.com Inc.

Tutor.com Inc. - Overview
Tutor.com Inc. - Product / Service
Tutor.com Inc. - Key offerings
SWOT

15.17 Udemy Inc.

Udemy Inc. - Overview
Udemy Inc. - Business segments
Udemy Inc. - Key news
Udemy Inc. - Key offerings
Udemy Inc. - Segment focus
SWOT

15.18 Varsity Tutors LLC

Varsity Tutors LLC - Overview
Varsity Tutors LLC - Product / Service
Varsity Tutors LLC - Key offerings
SWOT

16. Appendix

16.1 Scope of the report

Market definition
Objectives
Notes and caveats

16.2 Inclusions and exclusions checklist

Inclusions checklist
Exclusions checklist

16.3 Currency conversion rates for US$

16.4 Research methodology

16.5 Data procurement

Information sources

16.6 Data validation

16.7 Validation techniques employed for market sizing

16.8 Data synthesis

16.9 360 degree market analysis

16.10 List of abbreviations

Research Methodology

Technavio presents a detailed picture of the market by way of study, synthesis, and summation of data from multiple sources. The analysts have presented the various facets of the market with a particular focus on identifying the key industry influencers. The data thus presented is comprehensive, reliable, and the result of extensive research, both primary and secondary.

INFORMATION SOURCES

Primary sources

  • Manufacturers and suppliers
  • Channel partners
  • Industry experts
  • Strategic decision makers

Secondary sources

  • Industry journals and periodicals
  • Government data
  • Financial reports of key industry players
  • Historical data
  • Press releases

DATA ANALYSIS

Data Synthesis

  • Collation of data
  • Estimation of key figures
  • Analysis of derived insights

Data Validation

  • Triangulation with data models
  • Reference against proprietary databases
  • Corroboration with industry experts

REPORT WRITING

Qualitative

  • Market drivers
  • Market challenges
  • Market trends
  • Five forces analysis

Quantitative

  • Market size and forecast
  • Market segmentation
  • Geographical insights
  • Competitive landscape

Interested in this report?

Get your sample now to see our research methodology and insights!

Download Now

Frequently Asked Questions

Test Preparation market growth will increase by USD 58231.1 million during 2026-2030.

The Test Preparation market is expected to grow at a CAGR of 7.1% during 2026-2030.

Test Preparation market is segmented by Learning method (Blended learning, Online learning) Product (University exams, Certifications exams, High school exams, Elementary exams, Others) End-user (College students, Job seekers, Working professionals, Post-secondary certification)

Blueprint Test Preparation LLC, FIITJEE Ltd., Google LLC, Graham Holdings Co., IMS Learning Resources Pvt. Ltd, Khan Academy Inc., Magoosh, Manipal Global Edu Services, Pearson Plc, PrepScholar, Quizlet Inc., Simplilearn Solutions Pvt. Ltd, Sorting Hat Technologies Ltd., Test Innovators, Think and Learn Pvt. Ltd., TPR Education LLC, Tutor.com Inc., Udemy Inc., Varsity Tutors LLC, Vedantu Innovations Pvt. Ltd. are a few of the key vendors in the Test Preparation market.

North America will register the highest growth rate of 42.1% among the other regions. Therefore, the Test Preparation market in North America is expected to garner significant business opportunities for the vendors during the forecast period.

US, Canada, Mexico, China, India, Japan, South Korea, Australia, Indonesia, Germany, UK, France, Italy, The Netherlands, Spain, Brazil, Argentina, Chile, Saudi Arabia, UAE, South Africa, Israel, Turkey

  • High-Stakes professional certification and strategic rise of global workforce upskilling mandates is the driving factor this market.

The Test Preparation market vendors should focus on grabbing business opportunities from the Learning method segment as it accounted for the largest market share in the base year.
RIA - Research AI Assistant
Ask RIA