Telecom Analytics Market Analysis, Size, and Forecast 2026-2030: North America (US, Canada, and Mexico), Europe (Germany, UK, and France), APAC (China, Japan, and India), Middle East and Africa (Saudi Arabia, UAE, and South Africa), South America (Brazil, Argentina, and Chile), and Rest of World (ROW)

Telecom Analytics Market Analysis, Size, and Forecast 2026-2030:
North America (US, Canada, and Mexico), Europe (Germany, UK, and France), APAC (China, Japan, and India), Middle East and Africa (Saudi Arabia, UAE, and South Africa), South America (Brazil, Argentina, and Chile), and Rest of World (ROW)

Published: May 2026 300 Pages SKU: IRTNTR71673

Market Overview at a Glance

$5.87 B
Market Opportunity
14.2%
CAGR 2025 - 2030
36.9%
APAC Growth
$3.96 B
Cloud-based segment 2024

Telecom Analytics Market Size and Growth Forecast 2026-2030

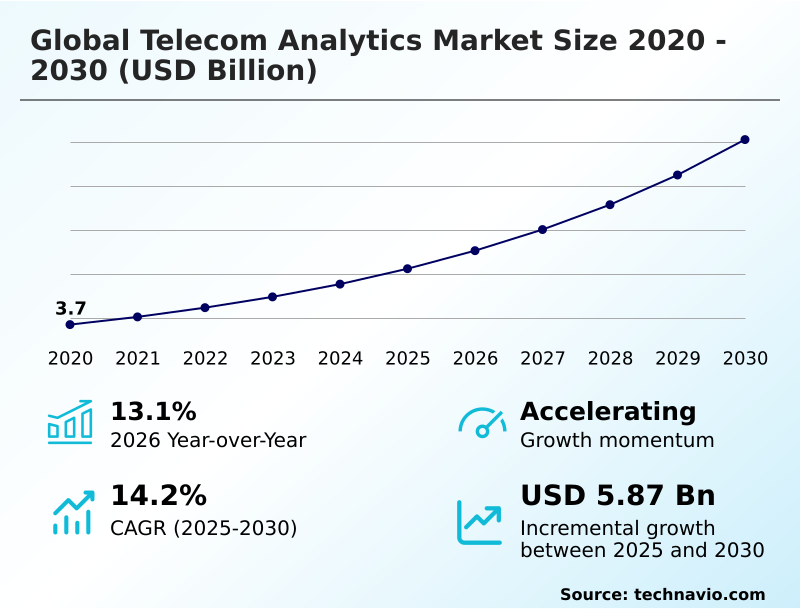
The Telecom Analytics Market size was valued at USD 6.24 billion in 2025 growing at a CAGR of 14.2% during the forecast period 2026-2030.

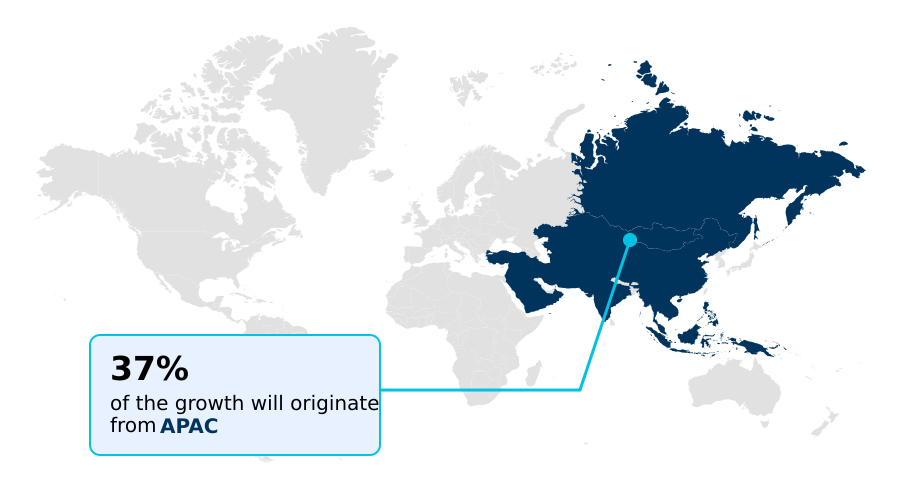
APAC accounts for 36.9% of incremental growth during the forecast period. The Cloud-based segment by Deployment was valued at USD 3.96 billion in 2024, while the Customer management segment holds the largest revenue share by Application.

The market is projected to grow by USD 8.41 billion from 2020 to 2030, with USD 5.87 billion of the growth expected during the forecast period of 2025 to 2030.

Get Key Insights on Market Forecast (PDF) Request Free Sample

Telecom Analytics Market Overview

The telecom analytics market is defined by the strategic imperative for communication service providers to manage network complexity and enhance customer value. The proliferation of 5G infrastructure drives an immense volume of network telemetry data, making advanced analytics essential for functions like network performance management and autonomous network orchestration. A dominant trend is the adoption of cloud-based telecom analytics platforms, which offer the scalability needed for real-time data processing and AI-driven customer experience management. APAC is a key region, contributing nearly 37% of the incremental growth, fueled by rapid 5G deployment. For instance, a tier-one operator implementing predictive analytics for telecom churn can reduce subscriber attrition by proactively identifying at-risk accounts through behavior analysis. This involves leveraging big data platforms to analyze call detail records and usage patterns, enabling targeted retention campaigns. However, operators face challenges in ensuring data governance and compliance with regulations like GDPR, which affects how subscriber data is used for network optimization and fraud detection. Successfully navigating these dynamics through a unified data fabric is critical for achieving a high return on infrastructure investments.

Drivers, Trends, and Challenges in the Telecom Analytics Market

The strategic implementation of telecom analytics is reshaping operator business models, moving beyond basic connectivity to value-added services. The ability to perform real-time network traffic analysis is foundational for managing the complexities of 5G, where dynamic resource allocation is essential.

For instance, a key operational scenario is 5G network slice performance monitoring, which allows carriers to guarantee quality of service for enterprise clients in manufacturing or logistics, a segment with significantly higher revenue potential than consumer mobile broadband. Success hinges on AI-driven customer experience management, which leverages subscriber data to personalize offerings and reduce churn.

This is directly linked to optimizing RAN with machine learning, a practice that can improve network efficiency by over 15% compared to static configurations. Cloud-based telecom analytics platforms are becoming the standard for deployment, offering the scalability required for these intensive computational tasks. However, all telecom data monetization strategies must be executed within strict regulatory boundaries.

For example, compliance analytics for telecom data is a non-negotiable requirement under frameworks like GDPR, governing how personal information is used. This has driven the adoption of advanced techniques for automating network operations with AI, ensuring that efficiency gains do not compromise privacy.

Ultimately, the market's trajectory is defined by the successful application of predictive analytics for telecom churn and the development of secure, efficient platforms.

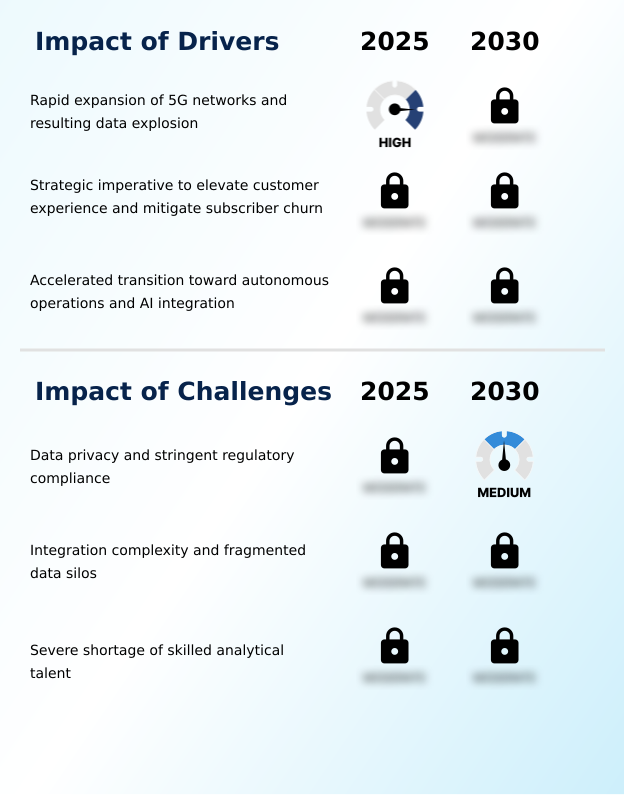
Primary Growth Driver: The rapid expansion of 5G networks and the resulting data explosion are key drivers for the adoption of advanced telecom analytics solutions.

The inexorable expansion of 5G networks and the corresponding explosion in data volume are the primary drivers of the market.

With networks becoming exponentially more complex, traditional management tools are inadequate, compelling operators to adopt advanced analytics for network performance management. The year-over-year market growth of over 13% reflects this urgency.

Communication service providers are investing in big data platforms capable of ingesting and analyzing network telemetry data in real-time to enable predictive maintenance and prevent service degradation.

Furthermore, the strategic imperative to improve customer experience and reduce churn is a powerful catalyst.

Analytics focused on subscriber behavior and quality of service are critical for retaining customers in competitive markets, making investment in these platforms a strategic necessity for sustainable revenue.

Emerging Market Trend: A key market trend is the shift toward edge analytics to process data closer to the source. This supports the ultra-low latency required for advanced applications like IoT and autonomous systems.

A primary trend is the decentralization of analytical processing power toward the network edge. This shift to edge analytics is driven by the need to support ultra-low latency applications, such as industrial IoT and autonomous systems, where real-time data processing is critical.

Rather than backhauling massive data volumes to a central cloud, operators are deploying AI and machine learning models at base stations and local data centers. This approach facilitates instantaneous anomaly detection and autonomous network orchestration, which are essential for maintaining service level agreements.

The customer management segment, which accounts for the largest share of applications at over 35%, benefits significantly, as localized processing enables faster, more responsive personalization and proactive support. This architectural evolution is fundamental for operators to monetize new 5G use cases.

Key Industry Challenge: Navigating data privacy concerns and stringent regulatory compliance frameworks presents a significant challenge to market growth.

A formidable challenge confronting the market is the intersection of data privacy and stringent regulatory compliance. As operators collect vast amounts of sensitive subscriber behavior data for analytics, they must navigate a complex web of regulations like GDPR and CCPA.

Adherence to these data governance frameworks requires significant investment in technologies for data anonymization and security, which can add computational overhead and slow down real-time data processing. The challenge is amplified by the fact that the risk and compliance management application segment is growing rapidly.

A single data breach can lead to severe financial penalties and irreparable reputational damage, creating a constant tension between maximizing data utility for subscriber churn prediction and ensuring foolproof privacy protection, which can divert resources from core network innovation.

Explore Full Market Dynamics Analysis Request Free Sample

Telecom Analytics Market Segmentation

The telecom analytics industry research report provides comprehensive data including region-wise segment analysis, with forecasts and analysis for the period 2026-2030, as well as historical data from 2020-2024 for the following segments.

Market Segment by Deployment
  • Cloud-based
  • On-premises
Market Segment by Application
  • Customer management
  • Network management
  • Sales and marketing management
  • Risk and compliance management
  • Workforce management
Market Segment by End-user
  • Large enterprises
  • SMEs
Market Segment by Geography
North America
US, Canada, Mexico
Europe
Germany, UK, France, Italy, Spain, The Netherlands
APAC
China, Japan, India, South Korea, Australia, Indonesia
Middle East and Africa
Saudi Arabia, UAE, South Africa, Israel, Turkey
South America
Brazil, Argentina, Chile

Deployment Segment Analysis

The cloud-based segment is estimated to witness significant growth during the forecast period.

The cloud-based deployment model is central to the telecom analytics market, driven by the operational necessity for scalable and agile solutions.

Communication service providers are shifting from on-premises infrastructure to leverage cloud environments for real-time data processing and to manage the complexities of 5G network analytics.

This transition supports advanced functions like subscriber churn prediction and autonomous network orchestration, which are essential for competitive differentiation.

The inherent flexibility of cloud-native architecture allows for the seamless integration of AI and machine learning algorithms, facilitating predictive maintenance and enhancing network performance management.

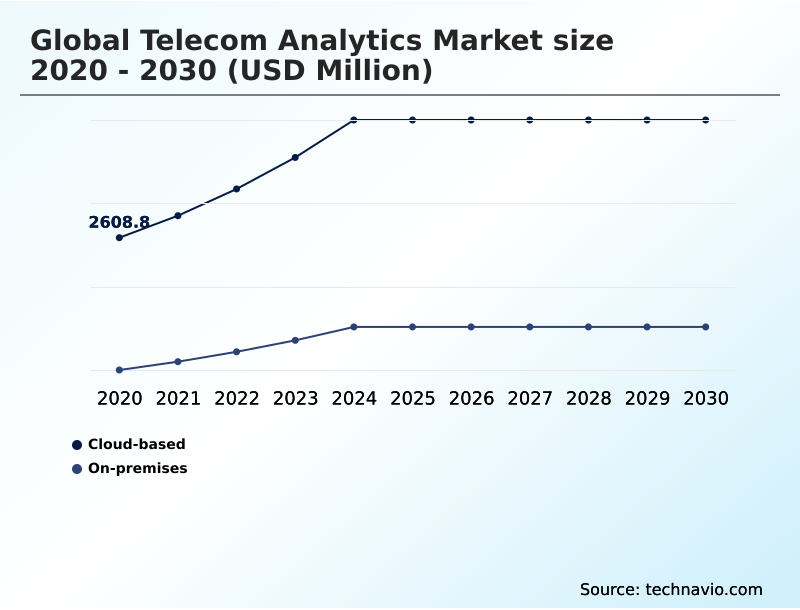
This segment, representing over 70% of deployments, relies on a unified data fabric to monetize massive data volumes from IoT ecosystems while maintaining service level agreement compliance.

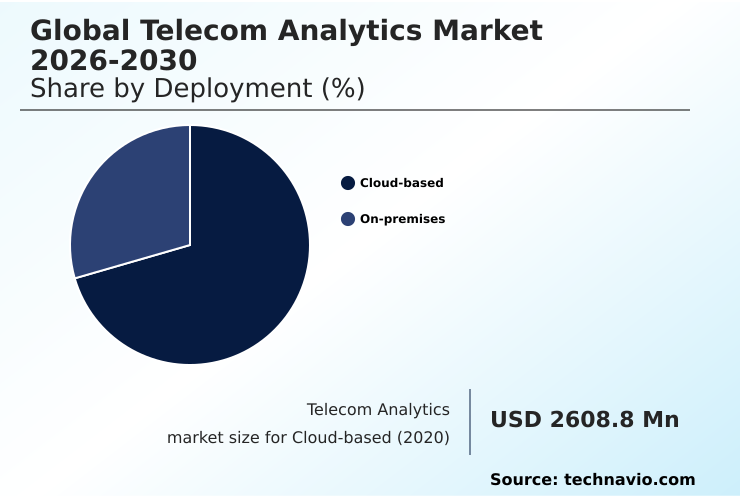
The Cloud-based segment was valued at USD 3.96 billion in 2024 and showed a gradual increase during the forecast period.

Telecom Analytics Market by Region: APAC Leads with 36.9% Growth Share

APAC is estimated to contribute 36.9% to the growth of the global market during the forecast period.

The geographic landscape of the telecom analytics market is diverse, with regional adoption patterns reflecting technological maturity and investment priorities.

North America, accounting for over 30% of the market, is characterized by advanced deployments of AI-driven customer experience management and predictive maintenance to manage highly saturated markets.

In contrast, APAC is the fastest-growing region, projected to contribute nearly 37% of the market's incremental growth, driven by massive 5G network analytics rollouts and a focus on data monetization strategies in countries like China and India.

In Europe, the emphasis is on regulatory compliance, with GDPR shaping data governance frameworks for any subscriber behavior analysis. This necessitates robust solutions for data anonymization and security within big data platforms.

The Middle East and Africa show strong growth potential, with investments in network optimization and service assurance to support expanding digital economies.

Customer Landscape Analysis for the Telecom Analytics Market

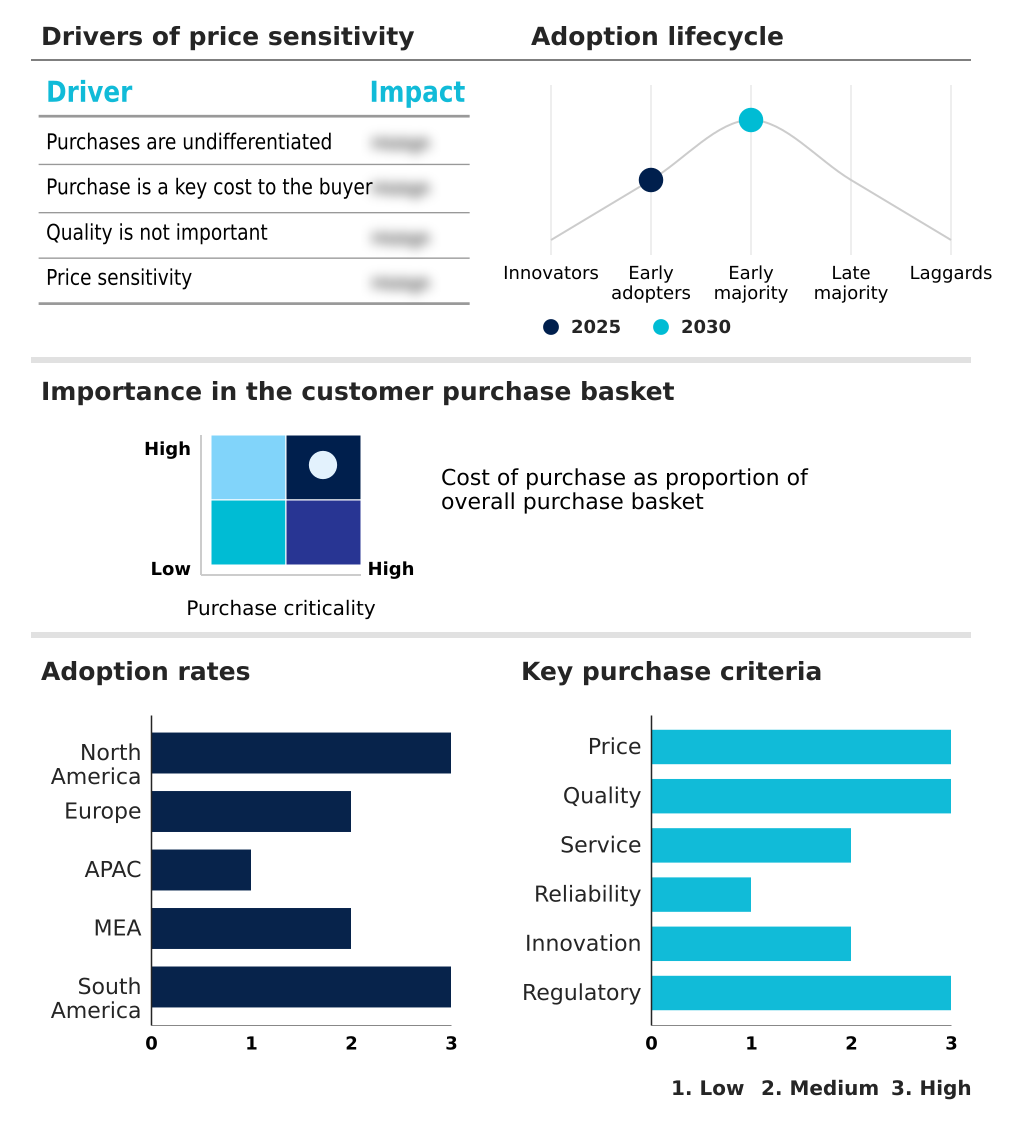
The telecom analytics market forecasting report includes the adoption lifecycle of the market, covering from the innovator’s stage to the laggard’s stage. It focuses on adoption rates in different regions based on penetration. Furthermore, the telecom analytics market report also includes key purchase criteria and drivers of price sensitivity to help companies evaluate and develop their market growth analysis strategies.

Competitive Landscape of the Telecom Analytics Market

Companies are implementing various strategies, such as strategic alliances, partnerships, mergers and acquisitions, geographical expansion, and product/service launches, to enhance their presence in the telecom analytics market industry.

Adobe Inc. - Providers deliver analytics platforms for network optimization, customer experience management, and data monetization, leveraging AI-driven insights for modern telecommunication infrastructures.

The industry research and growth report includes detailed analyses of the competitive landscape of the market and information about key companies, including:

  • Adobe Inc.
  • Alteryx Inc.
  • Cisco Systems Inc.
  • Huawei Technologies Co. Ltd.
  • IBM Corp.
  • Idera Inc.
  • Macrometa Corp.
  • Microsoft Corp.
  • Nokia Corp.
  • Oracle Corp.
  • Panorama Software Inc.
  • QlikTech International AB
  • SAP SE
  • SAS Institute Inc.
  • Sisense Ltd.
  • Tableau Software LLC
  • Telefonaktiebolaget Ericsson
  • Teradata Corp.
  • Thales Group
  • TIBCO Software Inc.

Qualitative and quantitative analysis of companies has been conducted to help clients understand the wider business environment as well as the strengths and weaknesses of key industry players. Data is qualitatively analyzed to categorize companies as pure play, category-focused, industry-focused, and diversified; it is quantitatively analyzed to categorize companies as dominant, leading, strong, tentative, and weak.

Recent Developments in the Telecom Analytics Market

  • In February 2025, Amdocs and Google Cloud announced a collaboration to launch the Amdocs Network AIOps solution, which utilizes generative AI and advanced data query platforms to help telecommunications providers automate network operations.
  • In March 2025, Adobe introduced updated Adobe Experience Cloud solutions with enhanced telecom analytics capabilities, enabling communication service providers to unify disconnected workflows and improve customer journeys.
  • In May 2025, Orange Business Services deployed AI-Orchestrator, a generative artificial intelligence service aimed at automating network management and resource allocation to optimize operational efficiency for enterprise clients.
  • In May 2025, International Business Machines Corporation and AT&T announced an extended multi-year collaboration focused on leveraging generative AI and advanced analytics to autonomously optimize network operations and enhance customer experience.

Research Analyst Overview: Telecom Analytics Market

The operational paradigm for telecommunications is shifting toward data-centric automation, where telecom analytics serves as the core intelligence layer. The deployment of 5G network analytics is no longer a forward-looking strategy but a current operational necessity for managing network performance and enabling services like network slicing.

This has direct boardroom implications, as capital expenditure decisions for network upgrades are now intrinsically tied to the capabilities of the organization's predictive maintenance and autonomous network orchestration platforms. A critical focus area is AI-driven customer experience management, as operators in mature markets where subscriber growth has plateaued pivot to maximizing average revenue per user.

For instance, leveraging big data platforms for real-time data processing allows operators to preemptively address issues impacting quality of service, a key factor in subscriber churn prediction.

This is conducted within a tight regulatory environment, with compliance with standards like the California Consumer Privacy Act influencing the architecture of any unified data fabric and data governance framework, particularly in the cloud-based segment, which accounts for over 70% of deployments.

Dive into Technavio’s robust research methodology, blending expert interviews, extensive data synthesis, and validated models for unparalleled Telecom Analytics Market insights. See full methodology.

Request Free Sample

Market Scope
Page number 300
Base year 2025
Historic period 2020-2024
Forecast period 2026-2030
Growth momentum & CAGR Accelerate at a CAGR of 14.2%
Market growth 2026-2030 USD 5869.7 million
Market structure Fragmented
YoY growth 2025-2026(%) 13.1%
Key countries US, Canada, Mexico, Germany, UK, France, Italy, Spain, The Netherlands, China, Japan, India, South Korea, Australia, Indonesia, Saudi Arabia, UAE, South Africa, Israel, Turkey, Brazil, Argentina and Chile
Competitive landscape Leading Companies, Market Positioning of Companies, Competitive Strategies, and Industry Risks

Telecom Analytics Market: Key Questions Answered in This Report

  • What is the expected growth of the Telecom Analytics Market between 2026 and 2030?

    • The Telecom Analytics Market is expected to grow by USD 5.87 billion during 2026-2030, registering a CAGR of 14.2%. Year-over-year growth in 2026 is estimated at 13.1%%. This acceleration is shaped by rapid expansion of 5g networks and resulting data explosion, which is intensifying demand across multiple end-use verticals covered in the report.

  • What segmentation does the market report cover?

    • The report is segmented by Deployment (Cloud-based, and On-premises), Application (Customer management, Network management, Sales and marketing management, Risk and compliance management, and Workforce management), End-user (Large enterprises, and SMEs) and Geography (North America, Europe, APAC, Middle East and Africa, South America). Among these, the Cloud-based segment is estimated to witness significant growth during the forecast period, driven by rising adoption across key application areas. Each segment includes detailed qualitative and quantitative analysis, along with historical data from 2020-2024 and forecasts through 2030 with year-over-year growth rates.

  • Which regions are analyzed in the report?

    • The report covers North America, Europe, APAC, Middle East and Africa and South America. APAC is estimated to contribute 36.9% to market growth during the forecast period. Country-level analysis includes US, Canada, Mexico, Germany, UK, France, Italy, Spain, The Netherlands, China, Japan, India, South Korea, Australia, Indonesia, Saudi Arabia, UAE, South Africa, Israel, Turkey, Brazil, Argentina and Chile, with dedicated market size tables and year-over-year growth for each.

  • What are the key growth drivers and market challenges?

    • The primary driver is rapid expansion of 5g networks and resulting data explosion, which is accelerating investment and industry demand. The main challenge is data privacy and stringent regulatory compliance, creating operational barriers for key market participants. The report quantifies the impact of each driver and challenge across 2026 and 2030 with comparative analysis.

  • Who are the major players in the Telecom Analytics Market?

    • Key vendors include Adobe Inc., Alteryx Inc., Cisco Systems Inc., Huawei Technologies Co. Ltd., IBM Corp., Idera Inc., Macrometa Corp., Microsoft Corp., Nokia Corp., Oracle Corp., Panorama Software Inc., QlikTech International AB, SAP SE, SAS Institute Inc., Sisense Ltd., Tableau Software LLC, Telefonaktiebolaget Ericsson, Teradata Corp., Thales Group and TIBCO Software Inc.. The report provides qualitative and quantitative analysis categorizing companies as dominant, leading, strong, tentative, and weak based on their market positioning. Company profiles include business segment analysis, SWOT assessment, key offerings, and recent strategic developments.

Telecom Analytics Market Research Insights

Market dynamics are shaped by the dual pressures of technological advancement and regulatory oversight. The strategic need to elevate customer experience and mitigate churn compels investment in sophisticated analytics. Operators are deploying solutions for subscriber behavior analysis to personalize services and improve retention.

For example, in a large enterprise deployment, quality of service monitoring across a sliced 5G network is crucial for maintaining strict service level agreements, a process governed by technical standards. At the same time, adherence to data privacy mandates, such as the stringent requirements outlined in the General Data Protection Regulation, dictates the architecture of data governance frameworks.

This requires a balance between data utilization for business intelligence and strict compliance, impacting everything from network traffic analysis to customer relationship management. The on-premises segment, while smaller, remains relevant for use cases with specific data sovereignty requirements.

We can help! Our analysts can customize this telecom analytics market research report to meet your requirements.

Get in touch

1. Executive Summary

1.1 Market overview

Executive Summary - Chart on Market Overview
Executive Summary - Data Table on Market Overview
Executive Summary - Chart on Global Market Characteristics
Executive Summary - Chart on Market by Geography
Executive Summary - Chart on Market Segmentation by Deployment
Executive Summary - Chart on Market Segmentation by Application
Executive Summary - Chart on Market Segmentation by End-user
Executive Summary - Chart on Incremental Growth
Executive Summary - Data Table on Incremental Growth
Executive Summary - Chart on Company Market Positioning

2. Technavio Analysis

2.1 Analysis of price sensitivity, lifecycle, customer purchase basket, adoption rates, and purchase criteria

2.2 Criticality of inputs and Factors of differentiation

Chart on Overview on criticality of inputs and factors of differentiation

2.3 Factors of disruption

Chart on Overview on factors of disruption

2.4 Impact of drivers and challenges

Chart on Impact of drivers and challenges in 2025 and 2030

3. Market Landscape

3.1 Market ecosystem

Chart on Parent Market
Data Table on - Parent Market

3.2 Market characteristics

Chart on Market characteristics analysis

3.3 Value chain analysis

Chart on Value chain analysis

4. Market Sizing

4.1 Market definition

Data Table on Offerings of companies included in the market definition

4.2 Market segment analysis

Market segments

4.3 Market size 2025

4.4 Market outlook: Forecast for 2025-2030

Chart on Global - Market size and forecast 2025-2030 ($ million)
Data Table on Global - Market size and forecast 2025-2030 ($ million)
Chart on Global Market: Year-over-year growth 2025-2030 (%)
Data Table on Global Market: Year-over-year growth 2025-2030 (%)

5. Historic Market Size

5.1 Global Telecom Analytics Market 2020 - 2024

Historic Market Size - Data Table on Global Telecom Analytics Market 2020 - 2024 ($ million)

5.2 Deployment segment analysis 2020 - 2024

Historic Market Size - Deployment Segment 2020 - 2024 ($ million)

5.3 Application segment analysis 2020 - 2024

Historic Market Size - Application Segment 2020 - 2024 ($ million)

5.4 End-user segment analysis 2020 - 2024

Historic Market Size - End-user Segment 2020 - 2024 ($ million)

5.5 Geography segment analysis 2020 - 2024

Historic Market Size - Geography Segment 2020 - 2024 ($ million)

5.6 Country segment analysis 2020 - 2024

Historic Market Size - Country Segment 2020 - 2024 ($ million)

6. Qualitative Analysis

6.1 Impact of AI on Global Telecom Analytics Market

6.2 Impact of Geopolitical Conflict on Global Telecom Analytics Market

7. Five Forces Analysis

7.1 Five forces summary

Five forces analysis - Comparison between 2025 and 2030

7.2 Bargaining power of buyers

Bargaining power of buyers - Impact of key factors 2025 and 2030

7.3 Bargaining power of suppliers

Bargaining power of suppliers - Impact of key factors in 2025 and 2030

7.4 Threat of new entrants

Threat of new entrants - Impact of key factors in 2025 and 2030

7.5 Threat of substitutes

Threat of substitutes - Impact of key factors in 2025 and 2030

7.6 Threat of rivalry

Threat of rivalry - Impact of key factors in 2025 and 2030

7.7 Market condition

Chart on Market condition - Five forces 2025 and 2030

8. Market Segmentation by Deployment

8.1 Market segments

Chart on Deployment - Market share 2025-2030 (%)
Data Table on Deployment - Market share 2025-2030 (%)

8.2 Comparison by Deployment

Chart on Comparison by Deployment
Data Table on Comparison by Deployment

8.3 Cloud-based - Market size and forecast 2025-2030

Chart on Cloud-based - Market size and forecast 2025-2030 ($ million)
Data Table on Cloud-based - Market size and forecast 2025-2030 ($ million)
Chart on Cloud-based - Year-over-year growth 2025-2030 (%)
Data Table on Cloud-based - Year-over-year growth 2025-2030 (%)

8.4 On-premises - Market size and forecast 2025-2030

Chart on On-premises - Market size and forecast 2025-2030 ($ million)
Data Table on On-premises - Market size and forecast 2025-2030 ($ million)
Chart on On-premises - Year-over-year growth 2025-2030 (%)
Data Table on On-premises - Year-over-year growth 2025-2030 (%)

8.5 Market opportunity by Deployment

Market opportunity by Deployment ($ million)
Data Table on Market opportunity by Deployment ($ million)

9. Market Segmentation by Application

9.1 Market segments

Chart on Application - Market share 2025-2030 (%)
Data Table on Application - Market share 2025-2030 (%)

9.2 Comparison by Application

Chart on Comparison by Application
Data Table on Comparison by Application

9.3 Customer management - Market size and forecast 2025-2030

Chart on Customer management - Market size and forecast 2025-2030 ($ million)
Data Table on Customer management - Market size and forecast 2025-2030 ($ million)
Chart on Customer management - Year-over-year growth 2025-2030 (%)
Data Table on Customer management - Year-over-year growth 2025-2030 (%)

9.4 Network management - Market size and forecast 2025-2030

Chart on Network management - Market size and forecast 2025-2030 ($ million)
Data Table on Network management - Market size and forecast 2025-2030 ($ million)
Chart on Network management - Year-over-year growth 2025-2030 (%)
Data Table on Network management - Year-over-year growth 2025-2030 (%)

9.5 Sales and marketing management - Market size and forecast 2025-2030

Chart on Sales and marketing management - Market size and forecast 2025-2030 ($ million)
Data Table on Sales and marketing management - Market size and forecast 2025-2030 ($ million)
Chart on Sales and marketing management - Year-over-year growth 2025-2030 (%)
Data Table on Sales and marketing management - Year-over-year growth 2025-2030 (%)

9.6 Risk and compliance management - Market size and forecast 2025-2030

Chart on Risk and compliance management - Market size and forecast 2025-2030 ($ million)
Data Table on Risk and compliance management - Market size and forecast 2025-2030 ($ million)
Chart on Risk and compliance management - Year-over-year growth 2025-2030 (%)
Data Table on Risk and compliance management - Year-over-year growth 2025-2030 (%)

9.7 Workforce management - Market size and forecast 2025-2030

Chart on Workforce management - Market size and forecast 2025-2030 ($ million)
Data Table on Workforce management - Market size and forecast 2025-2030 ($ million)
Chart on Workforce management - Year-over-year growth 2025-2030 (%)
Data Table on Workforce management - Year-over-year growth 2025-2030 (%)

9.8 Market opportunity by Application

Market opportunity by Application ($ million)
Data Table on Market opportunity by Application ($ million)

10. Market Segmentation by End-user

10.1 Market segments

Chart on End-user - Market share 2025-2030 (%)
Data Table on End-user - Market share 2025-2030 (%)

10.2 Comparison by End-user

Chart on Comparison by End-user
Data Table on Comparison by End-user

10.3 Large enterprises - Market size and forecast 2025-2030

Chart on Large enterprises - Market size and forecast 2025-2030 ($ million)
Data Table on Large enterprises - Market size and forecast 2025-2030 ($ million)
Chart on Large enterprises - Year-over-year growth 2025-2030 (%)
Data Table on Large enterprises - Year-over-year growth 2025-2030 (%)

10.4 SMEs - Market size and forecast 2025-2030

Chart on SMEs - Market size and forecast 2025-2030 ($ million)
Data Table on SMEs - Market size and forecast 2025-2030 ($ million)
Chart on SMEs - Year-over-year growth 2025-2030 (%)
Data Table on SMEs - Year-over-year growth 2025-2030 (%)

10.5 Market opportunity by End-user

Market opportunity by End-user ($ million)
Data Table on Market opportunity by End-user ($ million)

11. Customer Landscape

11.1 Customer landscape overview

Analysis of price sensitivity, lifecycle, customer purchase basket, adoption rates, and purchase criteria

12. Geographic Landscape

12.1 Geographic segmentation

Chart on Market share by geography 2025-2030 (%)
Data Table on Market share by geography 2025-2030 (%)

12.2 Geographic comparison

Chart on Geographic comparison
Data Table on Geographic comparison

12.3 North America - Market size and forecast 2025-2030

Chart on North America - Market size and forecast 2025-2030 ($ million)
Data Table on North America - Market size and forecast 2025-2030 ($ million)
Chart on North America - Year-over-year growth 2025-2030 (%)
Data Table on North America - Year-over-year growth 2025-2030 (%)
Chart on Regional Comparison - North America
Data Table on Regional Comparison - North America

12.3.1 US - Market size and forecast 2025-2030

Chart on US - Market size and forecast 2025-2030 ($ million)
Data Table on US - Market size and forecast 2025-2030 ($ million)
Chart on US - Year-over-year growth 2025-2030 (%)
Data Table on US - Year-over-year growth 2025-2030 (%)

12.3.2 Canada - Market size and forecast 2025-2030

Chart on Canada - Market size and forecast 2025-2030 ($ million)
Data Table on Canada - Market size and forecast 2025-2030 ($ million)
Chart on Canada - Year-over-year growth 2025-2030 (%)
Data Table on Canada - Year-over-year growth 2025-2030 (%)

12.3.3 Mexico - Market size and forecast 2025-2030

Chart on Mexico - Market size and forecast 2025-2030 ($ million)
Data Table on Mexico - Market size and forecast 2025-2030 ($ million)
Chart on Mexico - Year-over-year growth 2025-2030 (%)
Data Table on Mexico - Year-over-year growth 2025-2030 (%)

12.4 Europe - Market size and forecast 2025-2030

Chart on Europe - Market size and forecast 2025-2030 ($ million)
Data Table on Europe - Market size and forecast 2025-2030 ($ million)
Chart on Europe - Year-over-year growth 2025-2030 (%)
Data Table on Europe - Year-over-year growth 2025-2030 (%)
Chart on Regional Comparison - Europe
Data Table on Regional Comparison - Europe

12.4.1 Germany - Market size and forecast 2025-2030

Chart on Germany - Market size and forecast 2025-2030 ($ million)
Data Table on Germany - Market size and forecast 2025-2030 ($ million)
Chart on Germany - Year-over-year growth 2025-2030 (%)
Data Table on Germany - Year-over-year growth 2025-2030 (%)

12.4.2 UK - Market size and forecast 2025-2030

Chart on UK - Market size and forecast 2025-2030 ($ million)
Data Table on UK - Market size and forecast 2025-2030 ($ million)
Chart on UK - Year-over-year growth 2025-2030 (%)
Data Table on UK - Year-over-year growth 2025-2030 (%)

12.4.3 France - Market size and forecast 2025-2030

Chart on France - Market size and forecast 2025-2030 ($ million)
Data Table on France - Market size and forecast 2025-2030 ($ million)
Chart on France - Year-over-year growth 2025-2030 (%)
Data Table on France - Year-over-year growth 2025-2030 (%)

12.4.4 Italy - Market size and forecast 2025-2030

Chart on Italy - Market size and forecast 2025-2030 ($ million)
Data Table on Italy - Market size and forecast 2025-2030 ($ million)
Chart on Italy - Year-over-year growth 2025-2030 (%)
Data Table on Italy - Year-over-year growth 2025-2030 (%)

12.4.5 Spain - Market size and forecast 2025-2030

Chart on Spain - Market size and forecast 2025-2030 ($ million)
Data Table on Spain - Market size and forecast 2025-2030 ($ million)
Chart on Spain - Year-over-year growth 2025-2030 (%)
Data Table on Spain - Year-over-year growth 2025-2030 (%)

12.4.6 The Netherlands - Market size and forecast 2025-2030

Chart on The Netherlands - Market size and forecast 2025-2030 ($ million)
Data Table on The Netherlands - Market size and forecast 2025-2030 ($ million)
Chart on The Netherlands - Year-over-year growth 2025-2030 (%)
Data Table on The Netherlands - Year-over-year growth 2025-2030 (%)

12.5 APAC - Market size and forecast 2025-2030

Chart on APAC - Market size and forecast 2025-2030 ($ million)
Data Table on APAC - Market size and forecast 2025-2030 ($ million)
Chart on APAC - Year-over-year growth 2025-2030 (%)
Data Table on APAC - Year-over-year growth 2025-2030 (%)
Chart on Regional Comparison - APAC
Data Table on Regional Comparison - APAC

12.5.1 China - Market size and forecast 2025-2030

Chart on China - Market size and forecast 2025-2030 ($ million)
Data Table on China - Market size and forecast 2025-2030 ($ million)
Chart on China - Year-over-year growth 2025-2030 (%)
Data Table on China - Year-over-year growth 2025-2030 (%)

12.5.2 Japan - Market size and forecast 2025-2030

Chart on Japan - Market size and forecast 2025-2030 ($ million)
Data Table on Japan - Market size and forecast 2025-2030 ($ million)
Chart on Japan - Year-over-year growth 2025-2030 (%)
Data Table on Japan - Year-over-year growth 2025-2030 (%)

12.5.3 India - Market size and forecast 2025-2030

Chart on India - Market size and forecast 2025-2030 ($ million)
Data Table on India - Market size and forecast 2025-2030 ($ million)
Chart on India - Year-over-year growth 2025-2030 (%)
Data Table on India - Year-over-year growth 2025-2030 (%)

12.5.4 South Korea - Market size and forecast 2025-2030

Chart on South Korea - Market size and forecast 2025-2030 ($ million)
Data Table on South Korea - Market size and forecast 2025-2030 ($ million)
Chart on South Korea - Year-over-year growth 2025-2030 (%)
Data Table on South Korea - Year-over-year growth 2025-2030 (%)

12.5.5 Australia - Market size and forecast 2025-2030

Chart on Australia - Market size and forecast 2025-2030 ($ million)
Data Table on Australia - Market size and forecast 2025-2030 ($ million)
Chart on Australia - Year-over-year growth 2025-2030 (%)
Data Table on Australia - Year-over-year growth 2025-2030 (%)

12.5.6 Indonesia - Market size and forecast 2025-2030

Chart on Indonesia - Market size and forecast 2025-2030 ($ million)
Data Table on Indonesia - Market size and forecast 2025-2030 ($ million)
Chart on Indonesia - Year-over-year growth 2025-2030 (%)
Data Table on Indonesia - Year-over-year growth 2025-2030 (%)

12.6 Middle East and Africa - Market size and forecast 2025-2030

Chart on Middle East and Africa - Market size and forecast 2025-2030 ($ million)
Data Table on Middle East and Africa - Market size and forecast 2025-2030 ($ million)
Chart on Middle East and Africa - Year-over-year growth 2025-2030 (%)
Data Table on Middle East and Africa - Year-over-year growth 2025-2030 (%)
Chart on Regional Comparison - Middle East and Africa
Data Table on Regional Comparison - Middle East and Africa

12.6.1 Saudi Arabia - Market size and forecast 2025-2030

Chart on Saudi Arabia - Market size and forecast 2025-2030 ($ million)
Data Table on Saudi Arabia - Market size and forecast 2025-2030 ($ million)
Chart on Saudi Arabia - Year-over-year growth 2025-2030 (%)
Data Table on Saudi Arabia - Year-over-year growth 2025-2030 (%)

12.6.2 UAE - Market size and forecast 2025-2030

Chart on UAE - Market size and forecast 2025-2030 ($ million)
Data Table on UAE - Market size and forecast 2025-2030 ($ million)
Chart on UAE - Year-over-year growth 2025-2030 (%)
Data Table on UAE - Year-over-year growth 2025-2030 (%)

12.6.3 South Africa - Market size and forecast 2025-2030

Chart on South Africa - Market size and forecast 2025-2030 ($ million)
Data Table on South Africa - Market size and forecast 2025-2030 ($ million)
Chart on South Africa - Year-over-year growth 2025-2030 (%)
Data Table on South Africa - Year-over-year growth 2025-2030 (%)

12.6.4 Israel - Market size and forecast 2025-2030

Chart on Israel - Market size and forecast 2025-2030 ($ million)
Data Table on Israel - Market size and forecast 2025-2030 ($ million)
Chart on Israel - Year-over-year growth 2025-2030 (%)
Data Table on Israel - Year-over-year growth 2025-2030 (%)

12.6.5 Turkey - Market size and forecast 2025-2030

Chart on Turkey - Market size and forecast 2025-2030 ($ million)
Data Table on Turkey - Market size and forecast 2025-2030 ($ million)
Chart on Turkey - Year-over-year growth 2025-2030 (%)
Data Table on Turkey - Year-over-year growth 2025-2030 (%)

12.7 South America - Market size and forecast 2025-2030

Chart on South America - Market size and forecast 2025-2030 ($ million)
Data Table on South America - Market size and forecast 2025-2030 ($ million)
Chart on South America - Year-over-year growth 2025-2030 (%)
Data Table on South America - Year-over-year growth 2025-2030 (%)
Chart on Regional Comparison - South America
Data Table on Regional Comparison - South America

12.7.1 Brazil - Market size and forecast 2025-2030

Chart on Brazil - Market size and forecast 2025-2030 ($ million)
Data Table on Brazil - Market size and forecast 2025-2030 ($ million)
Chart on Brazil - Year-over-year growth 2025-2030 (%)
Data Table on Brazil - Year-over-year growth 2025-2030 (%)

12.7.2 Argentina - Market size and forecast 2025-2030

Chart on Argentina - Market size and forecast 2025-2030 ($ million)
Data Table on Argentina - Market size and forecast 2025-2030 ($ million)
Chart on Argentina - Year-over-year growth 2025-2030 (%)
Data Table on Argentina - Year-over-year growth 2025-2030 (%)

12.7.3 Chile - Market size and forecast 2025-2030

Chart on Chile - Market size and forecast 2025-2030 ($ million)
Data Table on Chile - Market size and forecast 2025-2030 ($ million)
Chart on Chile - Year-over-year growth 2025-2030 (%)
Data Table on Chile - Year-over-year growth 2025-2030 (%)

12.8 Market opportunity by geography

Market opportunity by geography ($ million)
Data Tables on Market opportunity by geography ($ million)

13. Drivers, Challenges, and Opportunity

13.1 Market drivers

Rapid expansion of 5G networks and resulting data explosion
Strategic imperative to elevate customer experience and mitigate subscriber churn
Accelerated transition toward autonomous operations and AI integration

13.2 Market challenges

Data privacy and stringent regulatory compliance
Integration complexity and fragmented data silos
Severe shortage of skilled analytical talent

13.3 Impact of drivers and challenges

Impact of drivers and challenges in 2025 and 2030

13.4 Market opportunities

Shift toward edge analytics to support ultra-low latency applications
Adoption of unified data fabrics to eliminate operational data
Increasing focus on improving customer experience

14. Competitive Landscape

14.1 Overview

14.2

Overview on criticality of inputs and factors of differentiation

14.3 Landscape disruption

Overview on factors of disruption

14.4 Industry risks

Impact of key risks on business

15. Competitive Analysis

15.1 Companies profiled

Companies covered

15.2 Company ranking index

15.3 Market positioning of companies

Matrix on companies position and classification

15.4 Adobe Inc.

Adobe Inc. - Overview
Adobe Inc. - Business segments
Adobe Inc. - Key news
Adobe Inc. - Key offerings
Adobe Inc. - Segment focus
SWOT

15.5 Alteryx Inc.

Alteryx Inc. - Overview
Alteryx Inc. - Product / Service
Alteryx Inc. - Key offerings
SWOT

15.6 Cisco Systems Inc.

Cisco Systems Inc. - Overview
Cisco Systems Inc. - Business segments
Cisco Systems Inc. - Key news
Cisco Systems Inc. - Key offerings
Cisco Systems Inc. - Segment focus
SWOT

15.7 Huawei Technologies Co. Ltd.

Huawei Technologies Co. Ltd. - Overview
Huawei Technologies Co. Ltd. - Business segments
Huawei Technologies Co. Ltd. - Key news
Huawei Technologies Co. Ltd. - Key offerings
Huawei Technologies Co. Ltd. - Segment focus
SWOT

15.8 IBM Corp.

IBM Corp. - Overview
IBM Corp. - Business segments
IBM Corp. - Key news
IBM Corp. - Key offerings
IBM Corp. - Segment focus
SWOT

15.9 Microsoft Corp.

Microsoft Corp. - Overview
Microsoft Corp. - Business segments
Microsoft Corp. - Key news
Microsoft Corp. - Key offerings
Microsoft Corp. - Segment focus
SWOT

15.10 Nokia Corp.

Nokia Corp. - Overview
Nokia Corp. - Business segments
Nokia Corp. - Key news
Nokia Corp. - Key offerings
Nokia Corp. - Segment focus
SWOT

15.11 Oracle Corp.

Oracle Corp. - Overview
Oracle Corp. - Business segments
Oracle Corp. - Key news
Oracle Corp. - Key offerings
Oracle Corp. - Segment focus
SWOT

15.12 QlikTech International AB

QlikTech International AB - Overview
QlikTech International AB - Product / Service
QlikTech International AB - Key offerings
SWOT

15.13 SAP SE

SAP SE - Overview
SAP SE - Business segments
SAP SE - Key news
SAP SE - Key offerings
SAP SE - Segment focus
SWOT

15.14 SAS Institute Inc.

SAS Institute Inc. - Overview
SAS Institute Inc. - Product / Service
SAS Institute Inc. - Key offerings
SWOT

15.15 Tableau Software LLC

Tableau Software LLC - Overview
Tableau Software LLC - Product / Service
Tableau Software LLC - Key offerings
SWOT

15.16 Telefonaktiebolaget Ericsson

Telefonaktiebolaget Ericsson - Overview
Telefonaktiebolaget Ericsson - Business segments
Telefonaktiebolaget Ericsson - Key news
Telefonaktiebolaget Ericsson - Key offerings
Telefonaktiebolaget Ericsson - Segment focus
SWOT

15.17 Teradata Corp.

Teradata Corp. - Overview
Teradata Corp. - Business segments
Teradata Corp. - Key news
Teradata Corp. - Key offerings
Teradata Corp. - Segment focus
SWOT

15.18 TIBCO Software Inc.

TIBCO Software Inc. - Overview
TIBCO Software Inc. - Product / Service
TIBCO Software Inc. - Key offerings
SWOT

16. Appendix

16.1 Scope of the report

Market definition
Objectives
Notes and caveats

16.2 Inclusions and exclusions checklist

Inclusions checklist
Exclusions checklist

16.3 Currency conversion rates for US$

16.4 Research methodology

16.5 Data procurement

Information sources

16.6 Data validation

16.7 Validation techniques employed for market sizing

16.8 Data synthesis

16.9 360 degree market analysis

16.10 List of abbreviations

Research Methodology

Technavio presents a detailed picture of the market by way of study, synthesis, and summation of data from multiple sources. The analysts have presented the various facets of the market with a particular focus on identifying the key industry influencers. The data thus presented is comprehensive, reliable, and the result of extensive research, both primary and secondary.

INFORMATION SOURCES

Primary sources

  • Manufacturers and suppliers
  • Channel partners
  • Industry experts
  • Strategic decision makers

Secondary sources

  • Industry journals and periodicals
  • Government data
  • Financial reports of key industry players
  • Historical data
  • Press releases

DATA ANALYSIS

Data Synthesis

  • Collation of data
  • Estimation of key figures
  • Analysis of derived insights

Data Validation

  • Triangulation with data models
  • Reference against proprietary databases
  • Corroboration with industry experts

REPORT WRITING

Qualitative

  • Market drivers
  • Market challenges
  • Market trends
  • Five forces analysis

Quantitative

  • Market size and forecast
  • Market segmentation
  • Geographical insights
  • Competitive landscape

Interested in this report?

Get your sample now to see our research methodology and insights!

Download Now

Frequently Asked Questions

Telecom Analytics market growth will increase by USD 5869.7 million during 2026-2030.

The Telecom Analytics market is expected to grow at a CAGR of 14.2% during 2026-2030.

Telecom Analytics market is segmented by Deployment (Cloud-based, On-premises) Application (Customer management, Network management, Sales and marketing management, Risk and compliance management, Workforce management) End-user (Large enterprises, SMEs)

Adobe Inc., Alteryx Inc., Cisco Systems Inc., Huawei Technologies Co. Ltd., IBM Corp., Idera Inc., Macrometa Corp., Microsoft Corp., Nokia Corp., Oracle Corp., Panorama Software Inc., QlikTech International AB, SAP SE, SAS Institute Inc., Sisense Ltd., Tableau Software LLC, Telefonaktiebolaget Ericsson, Teradata Corp., Thales Group, TIBCO Software Inc. are a few of the key vendors in the Telecom Analytics market.

APAC will register the highest growth rate of 36.9% among the other regions. Therefore, the Telecom Analytics market in APAC is expected to garner significant business opportunities for the vendors during the forecast period.

US, Canada, Mexico, Germany, UK, France, Italy, Spain, The Netherlands, China, Japan, India, South Korea, Australia, Indonesia, Saudi Arabia, UAE, South Africa, Israel, Turkey, Brazil, Argentina, Chile

  • Rapid expansion of 5G networks and resulting data explosion is the driving factor this market.

The Telecom Analytics market vendors should focus on grabbing business opportunities from the Deployment segment as it accounted for the largest market share in the base year.
RIA - Research AI Assistant
Ask RIA