Sustainable Consumer Goods Market Analysis, Size, and Forecast 2026-2030: North America (US, Canada, and Mexico), Europe (Germany, UK, and France), APAC (China, Japan, and India), South America (Brazil, Argentina, and Chile), Middle East and Africa (Saudi Arabia, UAE, and South Africa), and Rest of World (ROW)

Sustainable Consumer Goods Market Analysis, Size, and Forecast 2026-2030:
North America (US, Canada, and Mexico), Europe (Germany, UK, and France), APAC (China, Japan, and India), South America (Brazil, Argentina, and Chile), Middle East and Africa (Saudi Arabia, UAE, and South Africa), and Rest of World (ROW)

Published: May 2026 315 Pages SKU: IRTNTR81359

Market Overview at a Glance

$11.20 B
Market Opportunity
10.5%
CAGR 2025 - 2030
35.9%
North America Growth
$4.87 B
Food and beverages segment 2024

Sustainable Consumer Goods Market Size and Growth Forecast 2026-2030

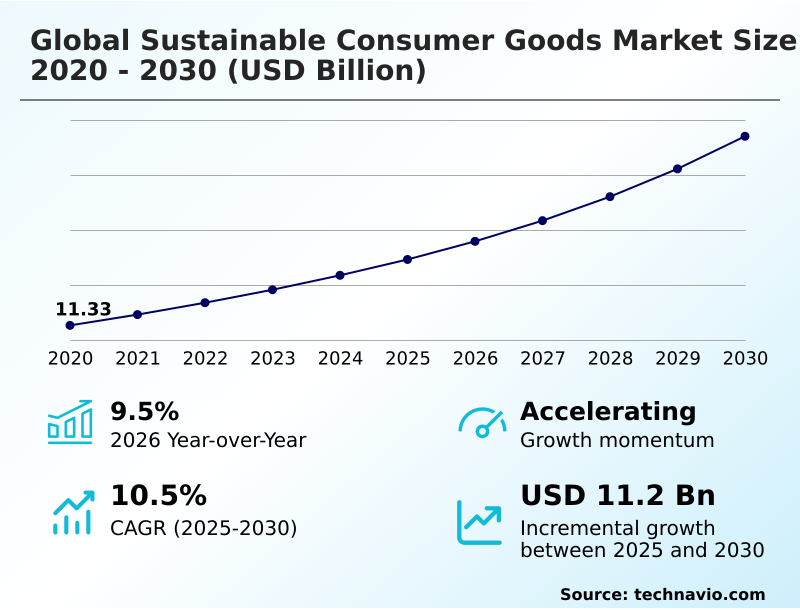
The Sustainable Consumer Goods Market size was valued at USD 17.32 billion in 2025 growing at a CAGR of 10.5% during the forecast period 2026-2030.

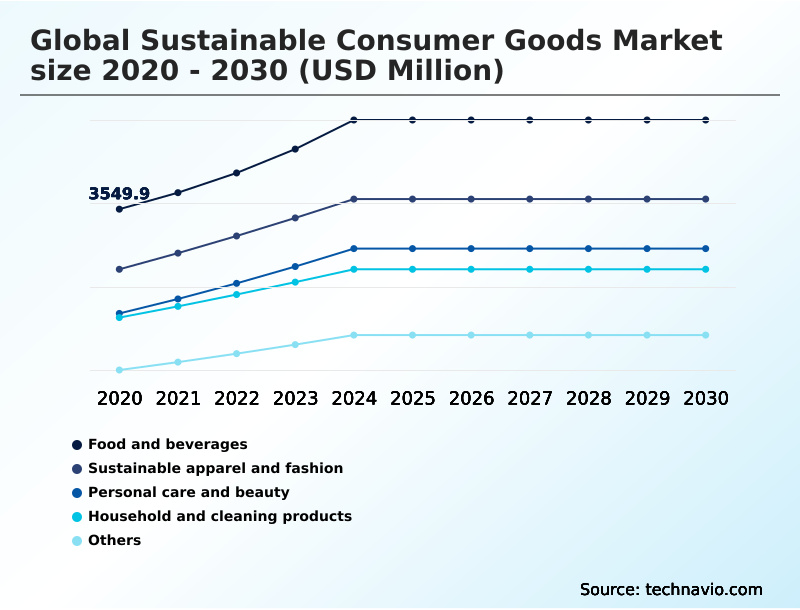
North America accounts for 35.9% of incremental growth during the forecast period. The Food and beverages segment by Product was valued at USD 4.87 billion in 2024, while the Organic materials segment holds the largest revenue share by Material.

The market is projected to grow by USD 17.20 billion from 2020 to 2030, with USD 11.20 billion of the growth expected during the forecast period of 2025 to 2030.

Get Key Insights on Market Forecast (PDF) Request Free Sample

Sustainable Consumer Goods Market Overview

The sustainable consumer goods market is driven by a fundamental reevaluation of production and consumption, with APAC projected to be a significant growth center. The shift towards circular business models is compelling companies to innovate beyond single-use products. In the sustainable fashion textiles sector, this means designing for disassembly and recycled content integration. A key operational shift is visible in personal care, where waterless product formulation reduces logistics costs and the need for plastic packaging. For instance, a household cleaning products company adopting concentrated formulas and biodegradable packaging materials can reduce its shipping-related carbon emissions by over 50%. This transition is supported by technologies like a blockchain supply chain for ensuring transparency in ethical sourcing standards. As North America is poised to contribute a significant portion of the market's incremental growth, regulatory pressure and consumer demand for eco-friendly home care and regenerative agriculture practices will continue to shape corporate strategy, forcing a move toward carbon neutral manufacturing.

Drivers, Trends, and Challenges in the Sustainable Consumer Goods Market

Corporate strategies for achieving net-zero are reshaping the competitive landscape, with a focus on managing supply chain complexity for sustainable goods and overcoming high costs of sustainable production. The impact of circular economy on consumer goods is profound, fueling the growth of resale and refurbishment business models.

A key challenge remains in addressing consumer skepticism towards green claims, making verifiable data crucial. This is where blockchain for supply chain transparency in fashion becomes critical, as does the importance of digital product passports for electronics, which are mandated under frameworks like the European Commission's Ecodesign for Sustainable Products Regulation.

The consumer demand for ethically sourced products is a primary driver, particularly for sustainable sourcing in the beauty industry. Here, the benefits of waterless personal care products are notable; a cosmetics firm can reduce shipping weight by over 80%, directly contributing to reducing carbon footprint.

Similar innovation is seen in advancing green chemistry in consumer products and reducing carbon footprint in household cleaning products. The transition to plant-based meat alternatives and the role of regenerative agriculture in food sustainability are also key trends.

For example, new production technologies have demonstrated the ability to lower the carbon footprint of plant-based proteins by more than one-third compared to previous methods. Despite progress, challenges in scaling biodegradable packaging persist. Trends in sustainable apparel and footwear are pushing for innovation in recycled material, while integrating AI for sustainable product design helps optimize resource use from the outset.

Ultimately, regional policies driving sustainable manufacturing will continue to enforce accountability and accelerate these transformations.

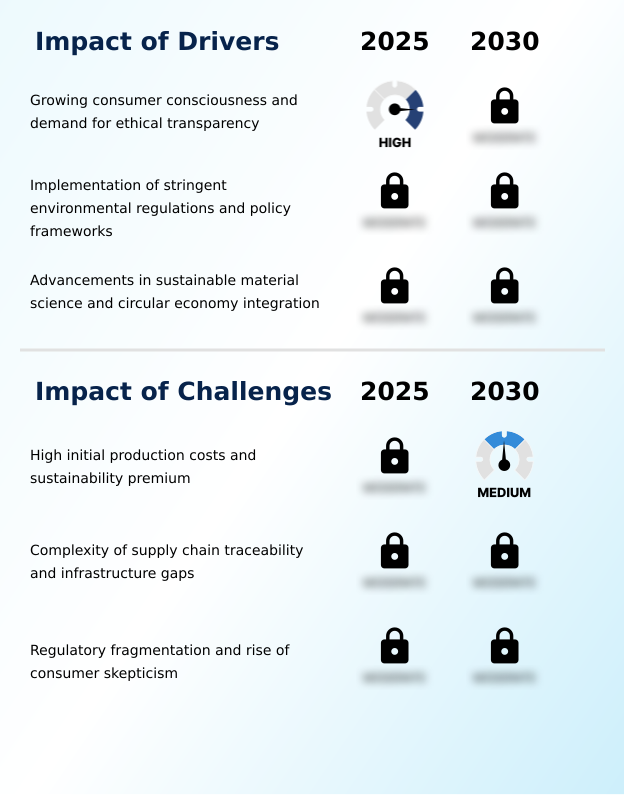
Primary Growth Driver: Growing consumer consciousness and a strong demand for ethical transparency throughout the supply chain are the primary drivers of market growth.

The market is primarily propelled by a combination of heightened consumer environmental awareness and stringent regulatory frameworks.

Governments worldwide are mandating regulatory compliance for sustainability, including extended producer responsibility and limits on single-use plastics, creating a level playing field and incentivizing green manufacturing.

This regulatory push is complemented by strong consumer demand for transparent supply chains and products made from sustainable materials. The rapid adoption of plant-based alternatives in the food sector exemplifies this shift.

In regions like APAC, which is experiencing growth exceeding 11%, these drivers are particularly potent, as a growing middle class demands safer, more eco-friendly products, forcing both local and multinational companies to innovate and align their offerings with global sustainability standards.

Emerging Market Trend: A key market trend is the expansion of circular business models and the rise of the resale revolution, signaling a structural shift away from linear consumption patterns.

A defining trend is the mainstream adoption of circular business models, moving beyond niche applications to become a core strategic focus. This is particularly evident in the growth of resale and refurbishment programs, which are enabled by modular product design that facilitates repair and component replacement.

The food and beverage segment, which accounts for a significant portion of the market, is seeing a push towards regenerative inputs. Concurrently, the personal care sector is being reshaped by waterless product formulation, which reduces packaging waste and transportation emissions, aligning with a zero-waste lifestyle.

Underpinning these trends is the integration of digital traceability, where tools like a blockchain supply chain provide consumers with verifiable proof of a product's origin and ethical journey, building trust and combating greenwashing.

Key Industry Challenge: High initial production costs and the resulting sustainability premium for consumers present a key challenge affecting the market's growth trajectory.

Significant challenges restrain market growth, led by the high costs of sustainable production and the complexity of global supply chains. Sourcing certified materials and ensuring ethical labor practices elevate operational expenses, often creating a price premium that limits mass adoption, particularly in price-sensitive regions like South America.

Managing supply chain complexity for sustainable goods is another major hurdle, as verifying recycled content standards or the provenance of biodegradable packaging materials across multiple tiers of suppliers is difficult. This lack of transparency contributes to consumer skepticism towards green claims, as greenwashing erodes trust.

Furthermore, infrastructure gaps, such as the lack of industrial composting facilities, can negate the environmental benefits of innovative materials, hindering the transition to a fully circular economy.

Explore Full Market Dynamics Analysis Request Free Sample

Sustainable Consumer Goods Market Segmentation

The sustainable consumer goods industry research report provides comprehensive data including region-wise segment analysis, with forecasts and analysis for the period 2026-2030, as well as historical data from 2020-2024 for the following segments.

Market Segment by Product
  • Food and beverages
  • Sustainable apparel and fashion
  • Personal care and beauty
  • Household and cleaning products
  • Others
Market Segment by Material
  • Organic materials
  • Recycled materials
  • Biodegradable materials
  • Carbon neutral material
  • Others
Market Segment by Distribution channel
  • Offline
  • Online
Market Segment by Geography
North America
US, Canada, Mexico
Europe
Germany, UK, France, Italy, Spain, The Netherlands
APAC
China, Japan, India, Australia, South Korea, Indonesia
South America
Brazil, Argentina, Chile
Middle East and Africa
Saudi Arabia, UAE, South Africa, Turkey, Israel

Product Segment Analysis

The food and beverages segment is estimated to witness significant growth during the forecast period.

The food and beverages segment is pivotal, shaped by a significant shift toward sustainable agriculture and conscious consumerism. Demand for plant-based alternatives is accelerating, with an emphasis on plant-based protein production to mitigate the environmental impact of traditional livestock farming.

Companies are implementing regenerative agriculture practices to enhance soil health and biodiversity, a move that also supports overall carbon footprint reduction. Innovation extends to utilizing upcycled agricultural residue, transforming waste streams into valuable inputs.

This sector, which is projected to be valued at over 7,798.8 million in 2025, is increasingly defined by carbon labeling and transparent sourcing, enabling consumers to make informed decisions based on the ecological cost of their food choices.

The Food and beverages segment was valued at USD 4.87 billion in 2024 and showed a gradual increase during the forecast period.

Sustainable Consumer Goods Market by Region: North America Leads with 35.9% Growth Share

North America is estimated to contribute 35.9% to the growth of the global market during the forecast period.

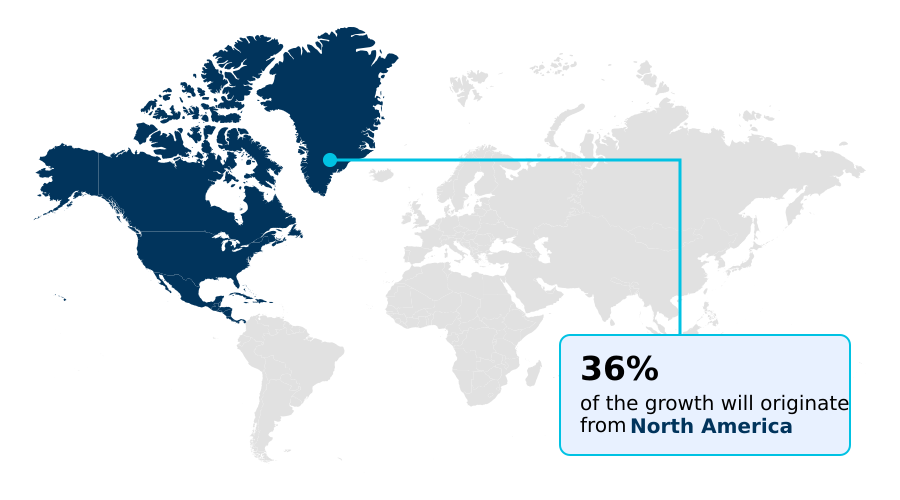
The geographic landscape of the sustainable consumer goods market is diverse, with North America representing the largest opportunity, accounting for nearly 36% of growth potential.

This region, along with Europe, is characterized by strong regulatory compliance for sustainability and high consumer awareness, driving demand for eco-friendly products.

Companies are pursuing corporate sustainability goals focused on carbon footprint reduction and establishing transparent supply chains to meet stakeholder expectations.

In APAC, which accounts for over 27% of the opportunity, the focus is on addressing plastic waste and promoting sustainable materials in rapidly urbanizing economies.

Across all regions, the principles of environmental stewardship and social responsibility are becoming integral to market strategy, pushing brands to innovate in both product design and operational transparency to maintain a competitive edge.

Customer Landscape Analysis for the Sustainable Consumer Goods Market

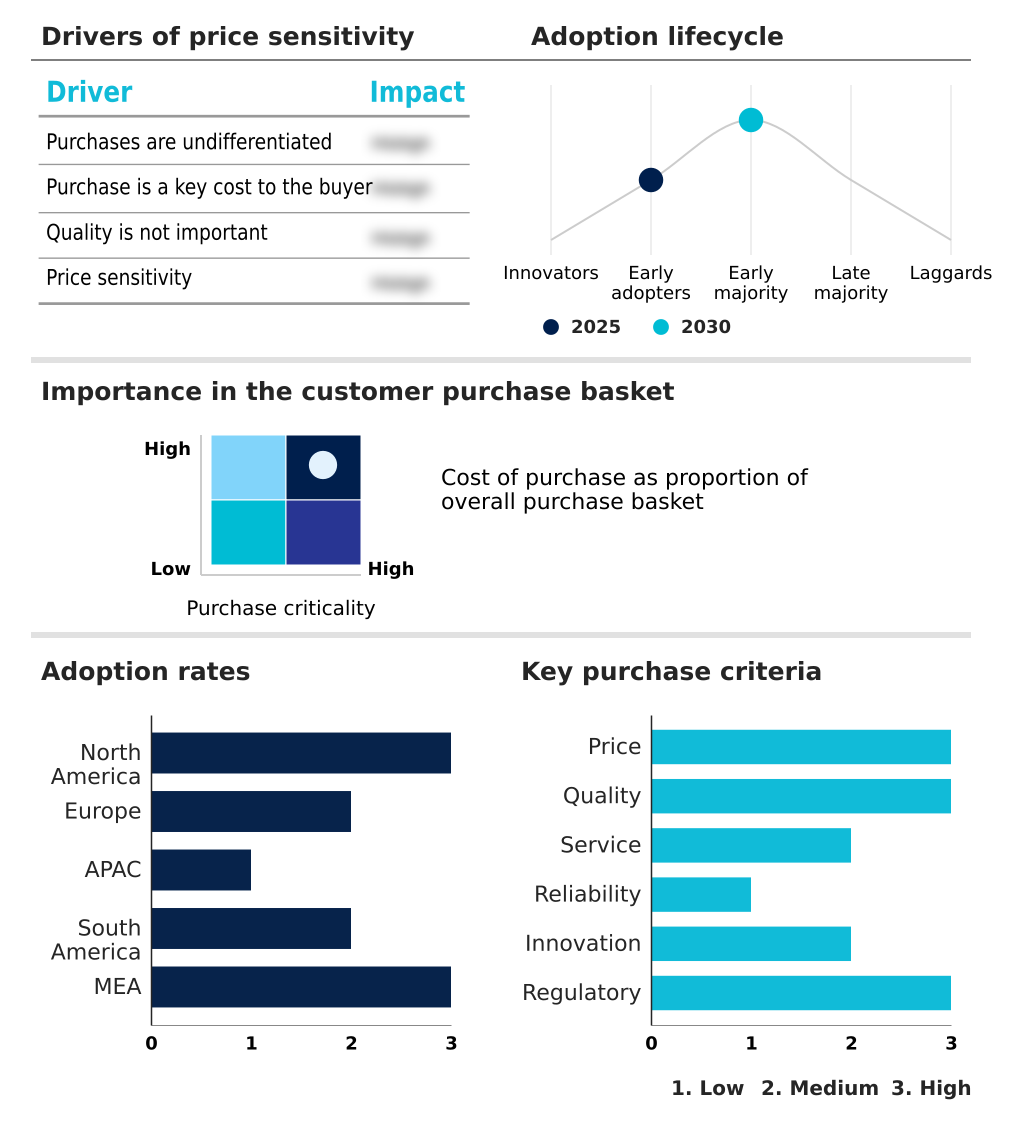
The sustainable consumer goods market forecasting report includes the adoption lifecycle of the market, covering from the innovator’s stage to the laggard’s stage. It focuses on adoption rates in different regions based on penetration. Furthermore, the sustainable consumer goods market report also includes key purchase criteria and drivers of price sensitivity to help companies evaluate and develop their market growth analysis strategies.

Competitive Landscape of the Sustainable Consumer Goods Market

Companies are implementing various strategies, such as strategic alliances, partnerships, mergers and acquisitions, geographical expansion, and product/service launches, to enhance their presence in the sustainable consumer goods market industry.

Allbirds Inc. - Key offerings include sustainable footwear and apparel, utilizing innovative natural materials to meet consumer demand for eco-conscious products.

The industry research and growth report includes detailed analyses of the competitive landscape of the market and information about key companies, including:

  • Allbirds Inc.
  • Beyond Meat Inc.
  • Burts Bees
  • Danone SA
  • Dr. Bronners Magic Soaps
  • Grove Collaborative Inc.
  • Impossible Foods Inc.
  • Inter IKEA Holding BV
  • Interface Inc.
  • Kering SA
  • Natura and Co. Holding SA
  • Oatly Group AB
  • Patagonia Inc.
  • People Against Dirty Holdings Ltd.
  • Procter and Gamble Co.
  • Seventh Generation Inc.
  • Lush Retail Ltd.
  • Stella McCartney Ltd.
  • The Body Shop International
  • Unilever PLC

Qualitative and quantitative analysis of companies has been conducted to help clients understand the wider business environment as well as the strengths and weaknesses of key industry players. Data is qualitatively analyzed to categorize companies as pure play, category-focused, industry-focused, and diversified; it is quantitatively analyzed to categorize companies as dominant, leading, strong, tentative, and weak.

Recent Developments in the Sustainable Consumer Goods Market

  • In October 2024, Beyond Meat Inc. introduced a pioneering production technology using high-moisture extrusion and upcycled agricultural residues, creating plant-based proteins with a 40% lower carbon footprint.
  • In November 2024, Inter IKEA Holding BV inaugurated a regional circularity hub in Sao Paulo, Brazil, to serve as a centralized facility for the professional refurbishment and resale of used furniture across South America.
  • In April 2025, the BMW Group implemented a standardized blockchain-based platform for the end-to-end tracking of raw materials, providing a technological blueprint for ensuring ethical sourcing of minerals and recycled plastics.
  • In May 2025, Unilever PLC announced a strategic adjustment to its procurement program in Europe after experiencing a 15% increase in the cost of certified sustainable surfactants derived from plant-based sources.

Research Analyst Overview: Sustainable Consumer Goods Market

Operational decisions are now intrinsically linked to sustainability metrics, moving far beyond marketing claims. Boardroom discussions center on the capital expenditure required for carbon neutral manufacturing and the total cost of ownership for technologies enabling circular business models.

For example, a CPG firm evaluating a shift to waterless product formulation must weigh the R&D investment against long-term logistics savings and alignment with extended producer responsibility schemes like those under the EU's Green Deal.

The integration of digital product passports is becoming a prerequisite for market access, forcing companies to deploy blockchain supply chain solutions to validate ethical sourcing standards and fair trade certification. This pressure drives innovation in areas like plant-based surfactant technology and the use of upcycled agricultural residue.

For instance, an apparel brand's decision to invest in developing mycelium-based leather is no longer just about brand image; it's a strategic move to de-risk its supply chain from volatile commodity prices and meet recycled content integration mandates, ultimately impacting long-term profitability and investor confidence.

Dive into Technavio’s robust research methodology, blending expert interviews, extensive data synthesis, and validated models for unparalleled Sustainable Consumer Goods Market insights. See full methodology.

Request Free Sample

Market Scope
Page number 315
Base year 2025
Historic period 2020-2024
Forecast period 2026-2030
Growth momentum & CAGR Accelerate at a CAGR of 10.5%
Market growth 2026-2030 USD 11201.6 million
Market structure Fragmented
YoY growth 2025-2026(%) 9.5%
Key countries US, Canada, Mexico, Germany, UK, France, Italy, Spain, The Netherlands, China, Japan, India, Australia, South Korea, Indonesia, Brazil, Argentina, Chile, Saudi Arabia, UAE, South Africa, Turkey and Israel
Competitive landscape Leading Companies, Market Positioning of Companies, Competitive Strategies, and Industry Risks

Sustainable Consumer Goods Market: Key Questions Answered in This Report

  • What is the expected growth of the Sustainable Consumer Goods Market between 2026 and 2030?

    • The Sustainable Consumer Goods Market is expected to grow by USD 11.20 billion during 2026-2030, registering a CAGR of 10.5%. Year-over-year growth in 2026 is estimated at 9.5%%. This acceleration is shaped by growing consumer consciousness and demand for ethical transparency, which is intensifying demand across multiple end-use verticals covered in the report.

  • What segmentation does the market report cover?

    • The report is segmented by Product (Food and beverages, Sustainable apparel and fashion, Personal care and beauty, Household and cleaning products, and Others), Material (Organic materials, Recycled materials, Biodegradable materials, Carbon neutral material, and Others), Distribution Channel (Offline, and Online) and Geography (North America, Europe, APAC, South America, Middle East and Africa). Among these, the Food and beverages segment is estimated to witness significant growth during the forecast period, driven by rising adoption across key application areas. Each segment includes detailed qualitative and quantitative analysis, along with historical data from 2020-2024 and forecasts through 2030 with year-over-year growth rates.

  • Which regions are analyzed in the report?

    • The report covers North America, Europe, APAC, South America and Middle East and Africa. North America is estimated to contribute 35.9% to market growth during the forecast period. Country-level analysis includes US, Canada, Mexico, Germany, UK, France, Italy, Spain, The Netherlands, China, Japan, India, Australia, South Korea, Indonesia, Brazil, Argentina, Chile, Saudi Arabia, UAE, South Africa, Turkey and Israel, with dedicated market size tables and year-over-year growth for each.

  • What are the key growth drivers and market challenges?

    • The primary driver is growing consumer consciousness and demand for ethical transparency, which is accelerating investment and industry demand. The main challenge is high initial production costs and sustainability premium, creating operational barriers for key market participants. The report quantifies the impact of each driver and challenge across 2026 and 2030 with comparative analysis.

  • Who are the major players in the Sustainable Consumer Goods Market?

    • Key vendors include Allbirds Inc., Beyond Meat Inc., Burts Bees, Danone SA, Dr. Bronners Magic Soaps, Grove Collaborative Inc., Impossible Foods Inc., Inter IKEA Holding BV, Interface Inc., Kering SA, Natura and Co. Holding SA, Oatly Group AB, Patagonia Inc., People Against Dirty Holdings Ltd., Procter and Gamble Co., Seventh Generation Inc., Lush Retail Ltd., Stella McCartney Ltd., The Body Shop International and Unilever PLC. The report provides qualitative and quantitative analysis categorizing companies as dominant, leading, strong, tentative, and weak based on their market positioning. Company profiles include business segment analysis, SWOT assessment, key offerings, and recent strategic developments.

Sustainable Consumer Goods Market Research Insights

Market dynamics are increasingly influenced by regulatory frameworks and a profound shift toward ethical consumption. Corporate sustainability goals are no longer optional, with an emphasis on creating transparent supply chains and investing in green manufacturing to reduce environmental impact. While Europe demonstrates mature, steady growth, the APAC region is expanding more rapidly, driven by rising consumer environmental awareness.

Frameworks like the EU’s Ecodesign for Sustainable Products Regulation mandate circular economy solutions and end-of-life product management, pushing companies toward innovations like plastic-free packaging and products designed for a sustainable product lifecycle. This regulatory pressure, combined with consumer demand, forces a comprehensive reevaluation of procurement, design, and distribution strategies globally.

We can help! Our analysts can customize this sustainable consumer goods market research report to meet your requirements.

Get in touch

1. Executive Summary

1.1 Market overview

Executive Summary - Chart on Market Overview
Executive Summary - Data Table on Market Overview
Executive Summary - Chart on Global Market Characteristics
Executive Summary - Chart on Market by Geography
Executive Summary - Chart on Market Segmentation by Product
Executive Summary - Chart on Market Segmentation by Material
Executive Summary - Chart on Market Segmentation by Distribution Channel
Executive Summary - Chart on Incremental Growth
Executive Summary - Data Table on Incremental Growth
Executive Summary - Chart on Company Market Positioning

2. Technavio Analysis

2.1 Analysis of price sensitivity, lifecycle, customer purchase basket, adoption rates, and purchase criteria

2.2 Criticality of inputs and Factors of differentiation

Chart on Overview on criticality of inputs and factors of differentiation

2.3 Factors of disruption

Chart on Overview on factors of disruption

2.4 Impact of drivers and challenges

Chart on Impact of drivers and challenges in 2025 and 2030

3. Market Landscape

3.1 Market ecosystem

Chart on Parent Market
Data Table on - Parent Market

3.2 Market characteristics

Chart on Market characteristics analysis

3.3 Value chain analysis

Chart on Value chain analysis

4. Market Sizing

4.1 Market definition

Data Table on Offerings of companies included in the market definition

4.2 Market segment analysis

Market segments

4.3 Market size 2025

4.4 Market outlook: Forecast for 2025-2030

Chart on Global - Market size and forecast 2025-2030 ($ million)
Data Table on Global - Market size and forecast 2025-2030 ($ million)
Chart on Global Market: Year-over-year growth 2025-2030 (%)
Data Table on Global Market: Year-over-year growth 2025-2030 (%)

5. Historic Market Size

5.1 Global Sustainable Consumer Goods Market 2020 - 2024

Historic Market Size - Data Table on Global Sustainable Consumer Goods Market 2020 - 2024 ($ million)

5.2 Product segment analysis 2020 - 2024

Historic Market Size - Product Segment 2020 - 2024 ($ million)

5.3 Material segment analysis 2020 - 2024

Historic Market Size - Material Segment 2020 - 2024 ($ million)

5.4 Distribution Channel segment analysis 2020 - 2024

Historic Market Size - Distribution Channel Segment 2020 - 2024 ($ million)

5.5 Geography segment analysis 2020 - 2024

Historic Market Size - Geography Segment 2020 - 2024 ($ million)

5.6 Country segment analysis 2020 - 2024

Historic Market Size - Country Segment 2020 - 2024 ($ million)

6. Qualitative Analysis

6.1 The AI impact on Global Sustainable Consumer Goods Market

6.2 Impact of geopolitical conflicts on Global Sustainable Consumer Goods Market

7. Five Forces Analysis

7.1 Five forces summary

Five forces analysis - Comparison between 2025 and 2030

7.2 Bargaining power of buyers

Bargaining power of buyers - Impact of key factors 2025 and 2030

7.3 Bargaining power of suppliers

Bargaining power of suppliers - Impact of key factors in 2025 and 2030

7.4 Threat of new entrants

Threat of new entrants - Impact of key factors in 2025 and 2030

7.5 Threat of substitutes

Threat of substitutes - Impact of key factors in 2025 and 2030

7.6 Threat of rivalry

Threat of rivalry - Impact of key factors in 2025 and 2030

7.7 Market condition

Chart on Market condition - Five forces 2025 and 2030

8. Market Segmentation by Product

8.1 Market segments

Chart on Product - Market share 2025-2030 (%)
Data Table on Product - Market share 2025-2030 (%)

8.2 Comparison by Product

Chart on Comparison by Product
Data Table on Comparison by Product

8.3 Food and beverages - Market size and forecast 2025-2030

Chart on Food and beverages - Market size and forecast 2025-2030 ($ million)
Data Table on Food and beverages - Market size and forecast 2025-2030 ($ million)
Chart on Food and beverages - Year-over-year growth 2025-2030 (%)
Data Table on Food and beverages - Year-over-year growth 2025-2030 (%)

8.4 Sustainable apparel and fashion - Market size and forecast 2025-2030

Chart on Sustainable apparel and fashion - Market size and forecast 2025-2030 ($ million)
Data Table on Sustainable apparel and fashion - Market size and forecast 2025-2030 ($ million)
Chart on Sustainable apparel and fashion - Year-over-year growth 2025-2030 (%)
Data Table on Sustainable apparel and fashion - Year-over-year growth 2025-2030 (%)

8.5 Personal care and beauty - Market size and forecast 2025-2030

Chart on Personal care and beauty - Market size and forecast 2025-2030 ($ million)
Data Table on Personal care and beauty - Market size and forecast 2025-2030 ($ million)
Chart on Personal care and beauty - Year-over-year growth 2025-2030 (%)
Data Table on Personal care and beauty - Year-over-year growth 2025-2030 (%)

8.6 Household and cleaning products - Market size and forecast 2025-2030

Chart on Household and cleaning products - Market size and forecast 2025-2030 ($ million)
Data Table on Household and cleaning products - Market size and forecast 2025-2030 ($ million)
Chart on Household and cleaning products - Year-over-year growth 2025-2030 (%)
Data Table on Household and cleaning products - Year-over-year growth 2025-2030 (%)

8.7 Others - Market size and forecast 2025-2030

Chart on Others - Market size and forecast 2025-2030 ($ million)
Data Table on Others - Market size and forecast 2025-2030 ($ million)
Chart on Others - Year-over-year growth 2025-2030 (%)
Data Table on Others - Year-over-year growth 2025-2030 (%)

8.8 Market opportunity by Product

Market opportunity by Product ($ million)
Data Table on Market opportunity by Product ($ million)

9. Market Segmentation by Material

9.1 Market segments

Chart on Material - Market share 2025-2030 (%)
Data Table on Material - Market share 2025-2030 (%)

9.2 Comparison by Material

Chart on Comparison by Material
Data Table on Comparison by Material

9.3 Organic materials - Market size and forecast 2025-2030

Chart on Organic materials - Market size and forecast 2025-2030 ($ million)
Data Table on Organic materials - Market size and forecast 2025-2030 ($ million)
Chart on Organic materials - Year-over-year growth 2025-2030 (%)
Data Table on Organic materials - Year-over-year growth 2025-2030 (%)

9.4 Recycled materials - Market size and forecast 2025-2030

Chart on Recycled materials - Market size and forecast 2025-2030 ($ million)
Data Table on Recycled materials - Market size and forecast 2025-2030 ($ million)
Chart on Recycled materials - Year-over-year growth 2025-2030 (%)
Data Table on Recycled materials - Year-over-year growth 2025-2030 (%)

9.5 Biodegradable materials - Market size and forecast 2025-2030

Chart on Biodegradable materials - Market size and forecast 2025-2030 ($ million)
Data Table on Biodegradable materials - Market size and forecast 2025-2030 ($ million)
Chart on Biodegradable materials - Year-over-year growth 2025-2030 (%)
Data Table on Biodegradable materials - Year-over-year growth 2025-2030 (%)

9.6 Carbon neutral material - Market size and forecast 2025-2030

Chart on Carbon neutral material - Market size and forecast 2025-2030 ($ million)
Data Table on Carbon neutral material - Market size and forecast 2025-2030 ($ million)
Chart on Carbon neutral material - Year-over-year growth 2025-2030 (%)
Data Table on Carbon neutral material - Year-over-year growth 2025-2030 (%)

9.7 Others - Market size and forecast 2025-2030

Chart on Others - Market size and forecast 2025-2030 ($ million)
Data Table on Others - Market size and forecast 2025-2030 ($ million)
Chart on Others - Year-over-year growth 2025-2030 (%)
Data Table on Others - Year-over-year growth 2025-2030 (%)

9.8 Market opportunity by Material

Market opportunity by Material ($ million)
Data Table on Market opportunity by Material ($ million)

10. Market Segmentation by Distribution Channel

10.1 Market segments

Chart on Distribution Channel - Market share 2025-2030 (%)
Data Table on Distribution Channel - Market share 2025-2030 (%)

10.2 Comparison by Distribution Channel

Chart on Comparison by Distribution Channel
Data Table on Comparison by Distribution Channel

10.3 Offline - Market size and forecast 2025-2030

Chart on Offline - Market size and forecast 2025-2030 ($ million)
Data Table on Offline - Market size and forecast 2025-2030 ($ million)
Chart on Offline - Year-over-year growth 2025-2030 (%)
Data Table on Offline - Year-over-year growth 2025-2030 (%)

10.4 Online - Market size and forecast 2025-2030

Chart on Online - Market size and forecast 2025-2030 ($ million)
Data Table on Online - Market size and forecast 2025-2030 ($ million)
Chart on Online - Year-over-year growth 2025-2030 (%)
Data Table on Online - Year-over-year growth 2025-2030 (%)

10.5 Market opportunity by Distribution Channel

Market opportunity by Distribution Channel ($ million)
Data Table on Market opportunity by Distribution Channel ($ million)

11. Customer Landscape

11.1 Customer landscape overview

Analysis of price sensitivity, lifecycle, customer purchase basket, adoption rates, and purchase criteria

12. Geographic Landscape

12.1 Geographic segmentation

Chart on Market share by geography 2025-2030 (%)
Data Table on Market share by geography 2025-2030 (%)

12.2 Geographic comparison

Chart on Geographic comparison
Data Table on Geographic comparison

12.3 North America - Market size and forecast 2025-2030

Chart on North America - Market size and forecast 2025-2030 ($ million)
Data Table on North America - Market size and forecast 2025-2030 ($ million)
Chart on North America - Year-over-year growth 2025-2030 (%)
Data Table on North America - Year-over-year growth 2025-2030 (%)
Chart on Regional Comparison - North America
Data Table on Regional Comparison - North America

12.3.1 US - Market size and forecast 2025-2030

Chart on US - Market size and forecast 2025-2030 ($ million)
Data Table on US - Market size and forecast 2025-2030 ($ million)
Chart on US - Year-over-year growth 2025-2030 (%)
Data Table on US - Year-over-year growth 2025-2030 (%)

12.3.2 Canada - Market size and forecast 2025-2030

Chart on Canada - Market size and forecast 2025-2030 ($ million)
Data Table on Canada - Market size and forecast 2025-2030 ($ million)
Chart on Canada - Year-over-year growth 2025-2030 (%)
Data Table on Canada - Year-over-year growth 2025-2030 (%)

12.3.3 Mexico - Market size and forecast 2025-2030

Chart on Mexico - Market size and forecast 2025-2030 ($ million)
Data Table on Mexico - Market size and forecast 2025-2030 ($ million)
Chart on Mexico - Year-over-year growth 2025-2030 (%)
Data Table on Mexico - Year-over-year growth 2025-2030 (%)

12.4 Europe - Market size and forecast 2025-2030

Chart on Europe - Market size and forecast 2025-2030 ($ million)
Data Table on Europe - Market size and forecast 2025-2030 ($ million)
Chart on Europe - Year-over-year growth 2025-2030 (%)
Data Table on Europe - Year-over-year growth 2025-2030 (%)
Chart on Regional Comparison - Europe
Data Table on Regional Comparison - Europe

12.4.1 Germany - Market size and forecast 2025-2030

Chart on Germany - Market size and forecast 2025-2030 ($ million)
Data Table on Germany - Market size and forecast 2025-2030 ($ million)
Chart on Germany - Year-over-year growth 2025-2030 (%)
Data Table on Germany - Year-over-year growth 2025-2030 (%)

12.4.2 UK - Market size and forecast 2025-2030

Chart on UK - Market size and forecast 2025-2030 ($ million)
Data Table on UK - Market size and forecast 2025-2030 ($ million)
Chart on UK - Year-over-year growth 2025-2030 (%)
Data Table on UK - Year-over-year growth 2025-2030 (%)

12.4.3 France - Market size and forecast 2025-2030

Chart on France - Market size and forecast 2025-2030 ($ million)
Data Table on France - Market size and forecast 2025-2030 ($ million)
Chart on France - Year-over-year growth 2025-2030 (%)
Data Table on France - Year-over-year growth 2025-2030 (%)

12.4.4 Italy - Market size and forecast 2025-2030

Chart on Italy - Market size and forecast 2025-2030 ($ million)
Data Table on Italy - Market size and forecast 2025-2030 ($ million)
Chart on Italy - Year-over-year growth 2025-2030 (%)
Data Table on Italy - Year-over-year growth 2025-2030 (%)

12.4.5 Spain - Market size and forecast 2025-2030

Chart on Spain - Market size and forecast 2025-2030 ($ million)
Data Table on Spain - Market size and forecast 2025-2030 ($ million)
Chart on Spain - Year-over-year growth 2025-2030 (%)
Data Table on Spain - Year-over-year growth 2025-2030 (%)

12.4.6 The Netherlands - Market size and forecast 2025-2030

Chart on The Netherlands - Market size and forecast 2025-2030 ($ million)
Data Table on The Netherlands - Market size and forecast 2025-2030 ($ million)
Chart on The Netherlands - Year-over-year growth 2025-2030 (%)
Data Table on The Netherlands - Year-over-year growth 2025-2030 (%)

12.5 APAC - Market size and forecast 2025-2030

Chart on APAC - Market size and forecast 2025-2030 ($ million)
Data Table on APAC - Market size and forecast 2025-2030 ($ million)
Chart on APAC - Year-over-year growth 2025-2030 (%)
Data Table on APAC - Year-over-year growth 2025-2030 (%)
Chart on Regional Comparison - APAC
Data Table on Regional Comparison - APAC

12.5.1 China - Market size and forecast 2025-2030

Chart on China - Market size and forecast 2025-2030 ($ million)
Data Table on China - Market size and forecast 2025-2030 ($ million)
Chart on China - Year-over-year growth 2025-2030 (%)
Data Table on China - Year-over-year growth 2025-2030 (%)

12.5.2 Japan - Market size and forecast 2025-2030

Chart on Japan - Market size and forecast 2025-2030 ($ million)
Data Table on Japan - Market size and forecast 2025-2030 ($ million)
Chart on Japan - Year-over-year growth 2025-2030 (%)
Data Table on Japan - Year-over-year growth 2025-2030 (%)

12.5.3 India - Market size and forecast 2025-2030

Chart on India - Market size and forecast 2025-2030 ($ million)
Data Table on India - Market size and forecast 2025-2030 ($ million)
Chart on India - Year-over-year growth 2025-2030 (%)
Data Table on India - Year-over-year growth 2025-2030 (%)

12.5.4 Australia - Market size and forecast 2025-2030

Chart on Australia - Market size and forecast 2025-2030 ($ million)
Data Table on Australia - Market size and forecast 2025-2030 ($ million)
Chart on Australia - Year-over-year growth 2025-2030 (%)
Data Table on Australia - Year-over-year growth 2025-2030 (%)

12.5.5 South Korea - Market size and forecast 2025-2030

Chart on South Korea - Market size and forecast 2025-2030 ($ million)
Data Table on South Korea - Market size and forecast 2025-2030 ($ million)
Chart on South Korea - Year-over-year growth 2025-2030 (%)
Data Table on South Korea - Year-over-year growth 2025-2030 (%)

12.5.6 Indonesia - Market size and forecast 2025-2030

Chart on Indonesia - Market size and forecast 2025-2030 ($ million)
Data Table on Indonesia - Market size and forecast 2025-2030 ($ million)
Chart on Indonesia - Year-over-year growth 2025-2030 (%)
Data Table on Indonesia - Year-over-year growth 2025-2030 (%)

12.6 South America - Market size and forecast 2025-2030

Chart on South America - Market size and forecast 2025-2030 ($ million)
Data Table on South America - Market size and forecast 2025-2030 ($ million)
Chart on South America - Year-over-year growth 2025-2030 (%)
Data Table on South America - Year-over-year growth 2025-2030 (%)
Chart on Regional Comparison - South America
Data Table on Regional Comparison - South America

12.6.1 Brazil - Market size and forecast 2025-2030

Chart on Brazil - Market size and forecast 2025-2030 ($ million)
Data Table on Brazil - Market size and forecast 2025-2030 ($ million)
Chart on Brazil - Year-over-year growth 2025-2030 (%)
Data Table on Brazil - Year-over-year growth 2025-2030 (%)

12.6.2 Argentina - Market size and forecast 2025-2030

Chart on Argentina - Market size and forecast 2025-2030 ($ million)
Data Table on Argentina - Market size and forecast 2025-2030 ($ million)
Chart on Argentina - Year-over-year growth 2025-2030 (%)
Data Table on Argentina - Year-over-year growth 2025-2030 (%)

12.6.3 Chile - Market size and forecast 2025-2030

Chart on Chile - Market size and forecast 2025-2030 ($ million)
Data Table on Chile - Market size and forecast 2025-2030 ($ million)
Chart on Chile - Year-over-year growth 2025-2030 (%)
Data Table on Chile - Year-over-year growth 2025-2030 (%)

12.7 Middle East and Africa - Market size and forecast 2025-2030

Chart on Middle East and Africa - Market size and forecast 2025-2030 ($ million)
Data Table on Middle East and Africa - Market size and forecast 2025-2030 ($ million)
Chart on Middle East and Africa - Year-over-year growth 2025-2030 (%)
Data Table on Middle East and Africa - Year-over-year growth 2025-2030 (%)
Chart on Regional Comparison - Middle East and Africa
Data Table on Regional Comparison - Middle East and Africa

12.7.1 Saudi Arabia - Market size and forecast 2025-2030

Chart on Saudi Arabia - Market size and forecast 2025-2030 ($ million)
Data Table on Saudi Arabia - Market size and forecast 2025-2030 ($ million)
Chart on Saudi Arabia - Year-over-year growth 2025-2030 (%)
Data Table on Saudi Arabia - Year-over-year growth 2025-2030 (%)

12.7.2 UAE - Market size and forecast 2025-2030

Chart on UAE - Market size and forecast 2025-2030 ($ million)
Data Table on UAE - Market size and forecast 2025-2030 ($ million)
Chart on UAE - Year-over-year growth 2025-2030 (%)
Data Table on UAE - Year-over-year growth 2025-2030 (%)

12.7.3 South Africa - Market size and forecast 2025-2030

Chart on South Africa - Market size and forecast 2025-2030 ($ million)
Data Table on South Africa - Market size and forecast 2025-2030 ($ million)
Chart on South Africa - Year-over-year growth 2025-2030 (%)
Data Table on South Africa - Year-over-year growth 2025-2030 (%)

12.7.4 Turkey - Market size and forecast 2025-2030

Chart on Turkey - Market size and forecast 2025-2030 ($ million)
Data Table on Turkey - Market size and forecast 2025-2030 ($ million)
Chart on Turkey - Year-over-year growth 2025-2030 (%)
Data Table on Turkey - Year-over-year growth 2025-2030 (%)

12.7.5 Israel - Market size and forecast 2025-2030

Chart on Israel - Market size and forecast 2025-2030 ($ million)
Data Table on Israel - Market size and forecast 2025-2030 ($ million)
Chart on Israel - Year-over-year growth 2025-2030 (%)
Data Table on Israel - Year-over-year growth 2025-2030 (%)

12.8 Market opportunity by geography

Market opportunity by geography ($ million)
Data Tables on Market opportunity by geography ($ million)

13. Drivers, Challenges, and Opportunity

13.1 Market drivers

Growing consumer consciousness and demand for ethical transparency
Implementation of stringent environmental regulations and policy frameworks
Advancements in sustainable material science and circular economy integration

13.2 Market challenges

High initial production costs and sustainability premium
Complexity of supply chain traceability and infrastructure gaps
Regulatory fragmentation and rise of consumer skepticism

13.3 Impact of drivers and challenges

Impact of drivers and challenges in 2025 and 2030

13.4 Market opportunities

Expansion of circular business models and resale revolution
Mainstream adoption of waterless and ultra-concentrated formulations
Integration of digital traceability and blockchain for radical transparency

14. Competitive Landscape

14.1 Overview

14.2

Overview on criticality of inputs and factors of differentiation

14.3 Landscape disruption

Overview on factors of disruption

14.4 Industry risks

Impact of key risks on business

15. Competitive Analysis

15.1 Companies profiled

Companies covered

15.2 Company ranking index

15.3 Market positioning of companies

Matrix on companies position and classification

15.4 Allbirds Inc.

Allbirds Inc. - Overview
Allbirds Inc. - Product / Service
Allbirds Inc. - Key offerings
SWOT

15.5 Beyond Meat Inc.

Beyond Meat Inc. - Overview
Beyond Meat Inc. - Product / Service
Beyond Meat Inc. - Key offerings
SWOT

15.6 Burts Bees

Burts Bees - Overview
Burts Bees - Product / Service
Burts Bees - Key offerings
SWOT

15.7 Danone SA

Danone SA - Overview
Danone SA - Business segments
Danone SA - Key news
Danone SA - Key offerings
Danone SA - Segment focus
SWOT

15.8 Dr. Bronners Magic Soaps

Dr. Bronners Magic Soaps - Overview
Dr. Bronners Magic Soaps - Product / Service
Dr. Bronners Magic Soaps - Key offerings
SWOT

15.9 Grove Collaborative Inc.

Grove Collaborative Inc. - Overview
Grove Collaborative Inc. - Business segments
Grove Collaborative Inc. - Key offerings
Grove Collaborative Inc. - Segment focus
SWOT

15.10 Impossible Foods Inc.

Impossible Foods Inc. - Overview
Impossible Foods Inc. - Product / Service
Impossible Foods Inc. - Key offerings
SWOT

15.11 Inter IKEA Holding BV

Inter IKEA Holding BV - Overview
Inter IKEA Holding BV - Product / Service
Inter IKEA Holding BV - Key news
Inter IKEA Holding BV - Key offerings
SWOT

15.12 Interface Inc.

Interface Inc. - Overview
Interface Inc. - Business segments
Interface Inc. - Key offerings
Interface Inc. - Segment focus
SWOT

15.13 Kering SA

Kering SA - Overview
Kering SA - Business segments
Kering SA - Key news
Kering SA - Key offerings
Kering SA - Segment focus
SWOT

15.14 Natura and Co. Holding SA

Natura and Co. Holding SA - Overview
Natura and Co. Holding SA - Business segments
Natura and Co. Holding SA - Key offerings
Natura and Co. Holding SA - Segment focus
SWOT

15.15 Oatly Group AB

Oatly Group AB - Overview
Oatly Group AB - Business segments
Oatly Group AB - Key news
Oatly Group AB - Key offerings
Oatly Group AB - Segment focus
SWOT

15.16 Patagonia Inc.

Patagonia Inc. - Overview
Patagonia Inc. - Product / Service
Patagonia Inc. - Key offerings
SWOT

15.17 People Against Dirty Holdings Ltd.

People Against Dirty Holdings Ltd. - Overview
People Against Dirty Holdings Ltd. - Product / Service
People Against Dirty Holdings Ltd. - Key offerings
SWOT

15.18 Procter and Gamble Co.

Procter and Gamble Co. - Overview
Procter and Gamble Co. - Business segments
Procter and Gamble Co. - Key offerings
Procter and Gamble Co. - Segment focus
SWOT

16. Appendix

16.1 Scope of the report

Market definition
Objectives
Notes and caveats

16.2 Inclusions and exclusions checklist

Inclusions checklist
Exclusions checklist

16.3 Currency conversion rates for US$

16.4 Research methodology

16.5 Data procurement

Information sources

16.6 Data validation

16.7 Validation techniques employed for market sizing

16.8 Data synthesis

16.9 360 degree market analysis

16.10 List of abbreviations

Research Methodology

Technavio presents a detailed picture of the market by way of study, synthesis, and summation of data from multiple sources. The analysts have presented the various facets of the market with a particular focus on identifying the key industry influencers. The data thus presented is comprehensive, reliable, and the result of extensive research, both primary and secondary.

INFORMATION SOURCES

Primary sources

  • Manufacturers and suppliers
  • Channel partners
  • Industry experts
  • Strategic decision makers

Secondary sources

  • Industry journals and periodicals
  • Government data
  • Financial reports of key industry players
  • Historical data
  • Press releases

DATA ANALYSIS

Data Synthesis

  • Collation of data
  • Estimation of key figures
  • Analysis of derived insights

Data Validation

  • Triangulation with data models
  • Reference against proprietary databases
  • Corroboration with industry experts

REPORT WRITING

Qualitative

  • Market drivers
  • Market challenges
  • Market trends
  • Five forces analysis

Quantitative

  • Market size and forecast
  • Market segmentation
  • Geographical insights
  • Competitive landscape

Interested in this report?

Get your sample now to see our research methodology and insights!

Download Now

Frequently Asked Questions

Sustainable Consumer Goods market growth will increase by USD 11201.6 million during 2026-2030.

The Sustainable Consumer Goods market is expected to grow at a CAGR of 10.5% during 2026-2030.

Sustainable Consumer Goods market is segmented by Product (Food and beverages, Sustainable apparel and fashion, Personal care and beauty, Household and cleaning products, Others) Material (Organic materials, Recycled materials, Biodegradable materials, Carbon neutral material, Others) Distribution channel (Offline, Online)

Allbirds Inc., Beyond Meat Inc., Burts Bees, Danone SA, Dr. Bronners Magic Soaps, Grove Collaborative Inc., Impossible Foods Inc., Inter IKEA Holding BV, Interface Inc., Kering SA, Natura and Co. Holding SA, Oatly Group AB, Patagonia Inc., People Against Dirty Holdings Ltd., Procter and Gamble Co., Seventh Generation Inc., Lush Retail Ltd., Stella McCartney Ltd., The Body Shop International, Unilever PLC are a few of the key vendors in the Sustainable Consumer Goods market.

North America will register the highest growth rate of 35.9% among the other regions. Therefore, the Sustainable Consumer Goods market in North America is expected to garner significant business opportunities for the vendors during the forecast period.

US, Canada, Mexico, Germany, UK, France, Italy, Spain, The Netherlands, China, Japan, India, Australia, South Korea, Indonesia, Brazil, Argentina, Chile, Saudi Arabia, UAE, South Africa, Turkey, Israel

  • Growing consumer consciousness and demand for ethical transparency is the driving factor this market.

The Sustainable Consumer Goods market vendors should focus on grabbing business opportunities from the Product segment as it accounted for the largest market share in the base year.
RIA - Research AI Assistant
Ask RIA