Snowmobile Market Analysis, Size, and Forecast 2026-2030: North America (US, Canada, and Mexico), Europe (Germany, France, and Italy), APAC (Japan, South Korea, and China), South America (Brazil, Argentina, and Colombia), Middle East and Africa (Saudi Arabia, Turkey, and UAE), and Rest of World (ROW)

Snowmobile Market Analysis, Size, and Forecast 2026-2030:
North America (US, Canada, and Mexico), Europe (Germany, France, and Italy), APAC (Japan, South Korea, and China), South America (Brazil, Argentina, and Colombia), Middle East and Africa (Saudi Arabia, Turkey, and UAE), and Rest of World (ROW)

Published: May 2026 260 Pages SKU: IRTNTR81256

Market Overview at a Glance

$378.8 Mn
Market Opportunity
4.3%
CAGR 2025 - 2030
43.2%
North America Growth
$700 Mn
Trail segment 2024

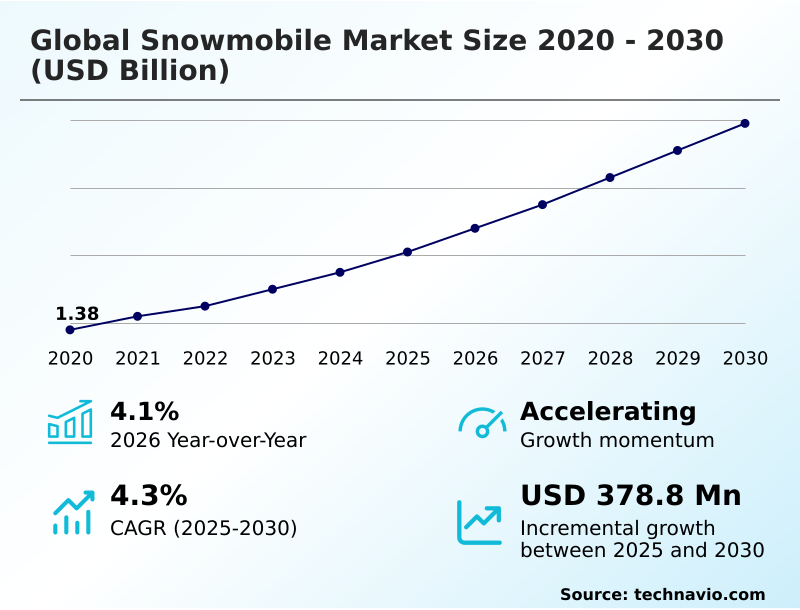
Snowmobile Market Size 2026-2030

The Snowmobile Market size was valued at USD 1.61 billion in 2025, growing at a CAGR of 4.3% during the forecast period 2026-2030.

Major Market Trends & Insights

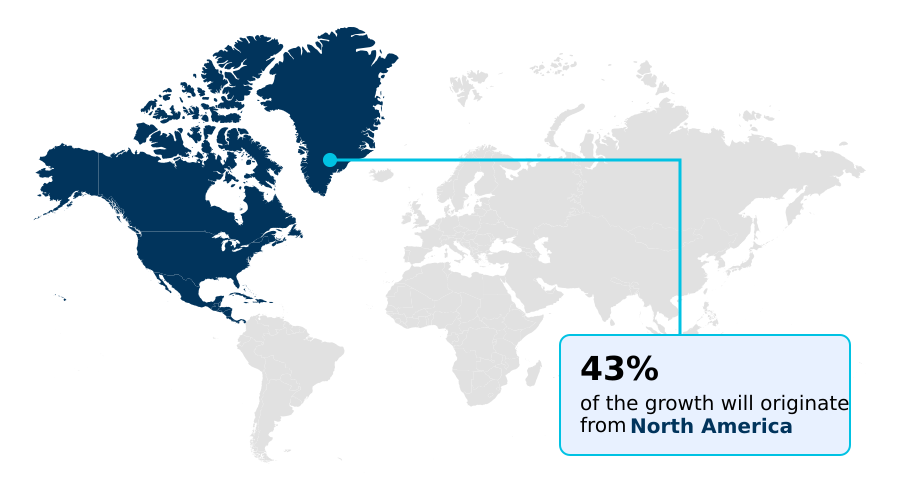
  • North America dominated the market and accounted for a 43.2% growth during the forecast period.
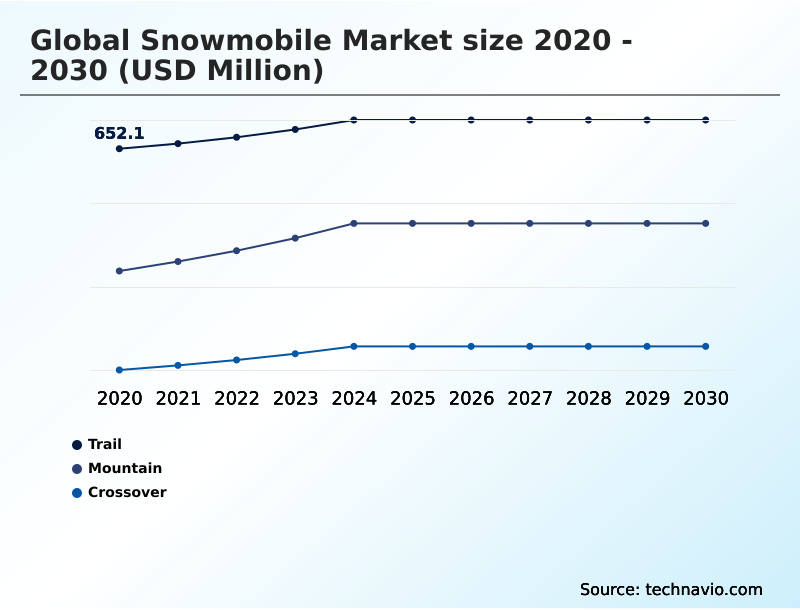
  • By Type - Trail segment was valued at USD 700 million in 2024
  • By Application - Recreation segment accounted for the largest market revenue share in 2024

Market Size & Forecast

  • Historic Market Opportunities 2020-2024: USD 608.2 million
  • Market Future Opportunities 2025-2030: USD 378.8 million
  • CAGR from 2025 to 2030 : 4.3%

Market Summary

  • The snowmobile market is characterized by a high degree of regional concentration, with over 82% of all units sold annually in the United States and Canada. This geographic focus heavily influences OEM supply chain strategies, where manufacturers optimize logistics for North American dealership networks to manage seasonal inventory surges and provide robust aftermarket support.
  • A key driver is the expansion of winter tourism, which has increased demand for rental fleets by over 15% in certain resort areas, pushing innovation in durable, user-friendly utility snowmobiles. Conversely, the industry faces the significant challenge of climate change, as shortening winters threaten the viability of the sport by reducing the operational season.
  • The high cost of ownership, exacerbated by inflation, also acts as a restraint, making it difficult to attract younger demographics and creating a reliance on an established, aging consumer base.

What will be the Size of the Snowmobile Market during the forecast period?

Get Key Insights on Market Forecast (PDF) Request Free Sample

How is the Snowmobile Market Segmented?

The snowmobile industry research report provides comprehensive data (region-wise segment analysis), with forecasts and analysis for the period 2026-2030, as well as historical data from 2020-2024 for the following segments.

  • Type
    • Trail
    • Mountain
    • Crossover
  • Application
    • Recreation
    • Utility
  • Engine capacity
    • 2-stroke
    • 4-stroke
  • Geography
    • North America
      • US
      • Canada
      • Mexico
    • Europe
      • Germany
      • France
      • Italy
    • APAC
      • Japan
      • South Korea
      • China
    • South America
      • Brazil
      • Argentina
      • Colombia
    • Middle East and Africa
      • Saudi Arabia
      • Turkey
      • UAE
    • Rest of World (ROW)

How is the Snowmobile Market Segmented by Type?

The trail segment is estimated to witness significant growth during the forecast period.

The trail snowmobile segment, a cornerstone of the market, captures over 45% of total sales, driven by an extensive network of groomed trails in North America and Europe.

These machines are engineered for stability and rider comfort, featuring advanced semi-active suspension systems that can reduce rider fatigue by up to 25% on long-distance excursions.

The focus on this segment is on handling precision for packed surfaces, utilizing shorter lug tracks and cleaner-burning four-stroke engines to comply with noise and emission standards near populated areas.

Development is geared toward ergonomic improvements and the integration of digital displays for navigation, which supports the significant economic impact of trail riding tourism and appeals to a broad demographic seeking reliable, high-performance recreational sleds.

Request Free Sample

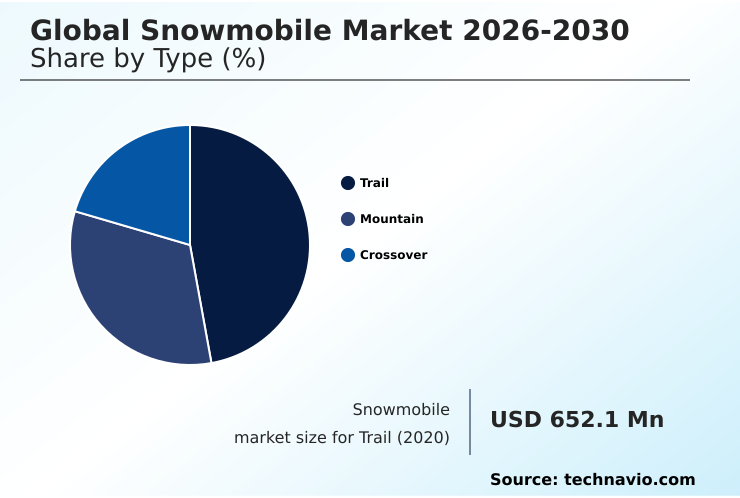
The Trail segment was valued at USD 700 million in 2024 and showed a gradual increase during the forecast period.

Request Free Sample

How demand for the Snowmobile market is rising in the leading region?

North America is estimated to contribute 43.2% to the growth of the global market during the forecast period.Technavio’s analysts have elaborately explained the regional trends and drivers that shape the market during the forecast period.

See How Snowmobile Market demand is rising in North America Request Free Sample

The geographic landscape of the global snowmobile market is heavily concentrated in North America, which accounts for over 43% of the market opportunity, a share more than 12% larger than that of Europe.

This dominance is driven by the United States and Canada, which together represent more than 80% of annual unit sales, supported by extensive groomed trail networks and a robust dealership network for aftermarket support.

In contrast, the European market, led by Nordic countries, is more focused on utility applications like reindeer herding and forestry management, leading to a demand for four-stroke engines that are up to 20% more fuel-efficient than their two-stroke counterparts.

The APAC market, while smaller, is the fastest-growing region, with a CAGR of 5.5% being driven by government-led winter tourism initiatives in China. This regional variance in the winter tourism economy requires distinct go-to-market strategies.

What are the key Drivers, Trends, and Challenges in the Snowmobile Market?

Our researchers analyzed the data with 2025 as the base year, along with the key drivers, trends, and challenges. A holistic analysis of drivers will help companies refine their marketing strategies to gain a competitive advantage.

  • Strategic decisions within the snowmobile industry are increasingly shaped by nuanced consumer demands, moving beyond simple performance metrics. Prospective buyers frequently research the best snowmobile for deep powder riding, highlighting the importance of specialized mountain snowmobile models with high power-to-weight ratios.
  • The query 'electric snowmobile range in cold' points to a critical adoption barrier for electric powertrains, where current battery technology offers up to 30% less range in sub-zero temperatures compared to traditional internal combustion engines. This performance gap influences purchasing decisions, especially for backcountry riders.
  • Furthermore, analysis of search queries like 'snowmobile utility vehicle towing capacity' reveals a strong commercial and prosumer market segment where functionality outweighs recreational features; these utility snowmobile models often boast towing capacities exceeding 1,500 pounds.
  • Understanding 'crossover vs trail snowmobile differences' is vital for manufacturers, as the crossover snowmobile segment is the fastest-growing, appealing to buyers who want a single, versatile machine.
  • Finally, 'snowmobile maintenance for longevity' is a key concern reflecting the high cost of ownership, pushing aftermarket support providers to offer service packages that can extend vehicle life by over five years, thereby influencing brand loyalty and total cost of ownership calculations.

What are the key market drivers leading to the rise in the adoption of Snowmobile Industry?

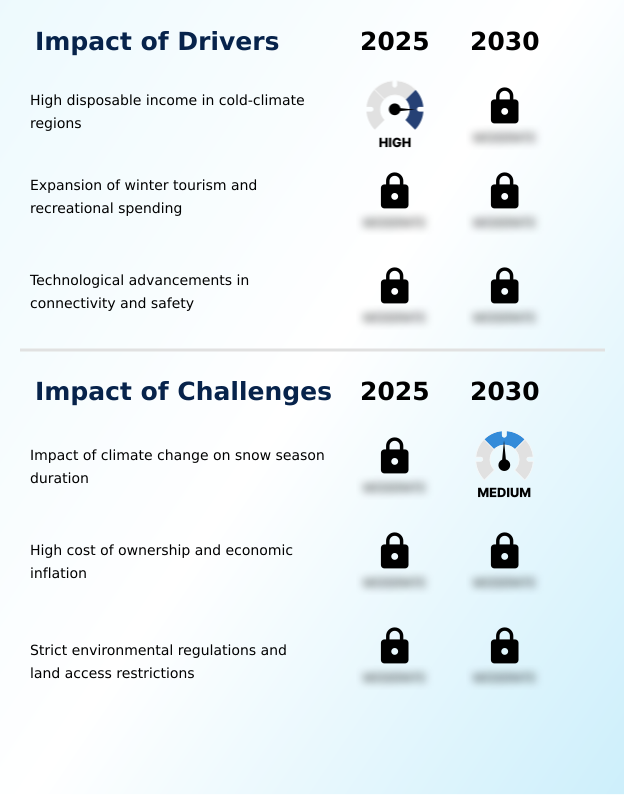
  • High disposable income levels within cold-climate regions are a primary driver, enabling greater consumer investment in high-cost recreational vehicles and related winter lifestyle activities.

  • Robust demand in the snowmobile market is significantly driven by the expansion of winter tourism and recreational spending, which has led to a 15% increase in guided tour offerings in key North American and Nordic regions.
  • This growth in the winter experiential travel economy provides a crucial entry point for new riders through rental programs, often leading to future ownership. Another major driver is the continuous integration of advanced technology.
  • The inclusion of features like ride-command systems and semi-active suspension has been shown to increase rider endurance by up to 25%, allowing for longer excursions.
  • This technological push stimulates replacement demand and attracts tech-savvy consumers, allowing manufacturers to maintain premium pricing in a competitive powersports supply chain.

What are the market trends shaping the Snowmobile Industry?

  • The market is undergoing a significant transition toward electrification and sustainable powertrains, a shift driven by stringent environmental regulations and growing consumer demand for eco-friendly recreational options.

  • A primary trend reshaping the snowmobile industry is the surge in demand for crossover and multi-utility vehicles, which now outpace sales growth of specialized models by nearly 10%. This consumer preference is driven by a desire for versatile machines capable of handling both groomed trail networks and deep powder riding.
  • This trend is coupled with the rapid integration of smart rider-assist systems, with over 60% of new high-end models featuring large digital displays with GPS navigation and vehicle-to-vehicle communication. This technology enhances safety in remote backcountry terrain. The most transformative trend, however, is the move toward electrification.
  • Driven by environmental regulations and a demand for noise pollution reduction, manufacturers are developing electric powertrain models that offer silent operation and instant torque, appealing to a new segment of eco-conscious consumers.

What challenges does the Snowmobile Industry face during its growth?

  • The impact of climate change on the duration and predictability of the snow season presents a significant challenge to industry growth by limiting the operational window for snowmobiling.

  • The most significant challenge for the snowmobile market is the impact of unpredictable winter weather patterns, which can shorten the riding season by up to 30% in some regions, creating inventory surpluses for the dealership network. This environmental volatility directly correlates with sales figures.
  • A second major challenge is the high cost of ownership, which, when combined with ancillary expenses, creates a substantial financial barrier. This economic pressure disproportionately affects younger demographics, with the average age of a snowmobile owner being over 45 years.
  • Stricter environmental regulations and land access restrictions also constrain the market, as trail closures limit the areas available for legal riding, thereby diminishing the value proposition of owning a snowmobile and affecting the winter tourism economy.

Exclusive Technavio Analysis on Customer Landscape

The snowmobile market forecasting report includes the adoption lifecycle of the market, covering from the innovator’s stage to the laggard’s stage. It focuses on adoption rates in different regions based on penetration. Furthermore, the snowmobile market report also includes key purchase criteria and drivers of price sensitivity to help companies evaluate and develop their market growth analysis strategies.

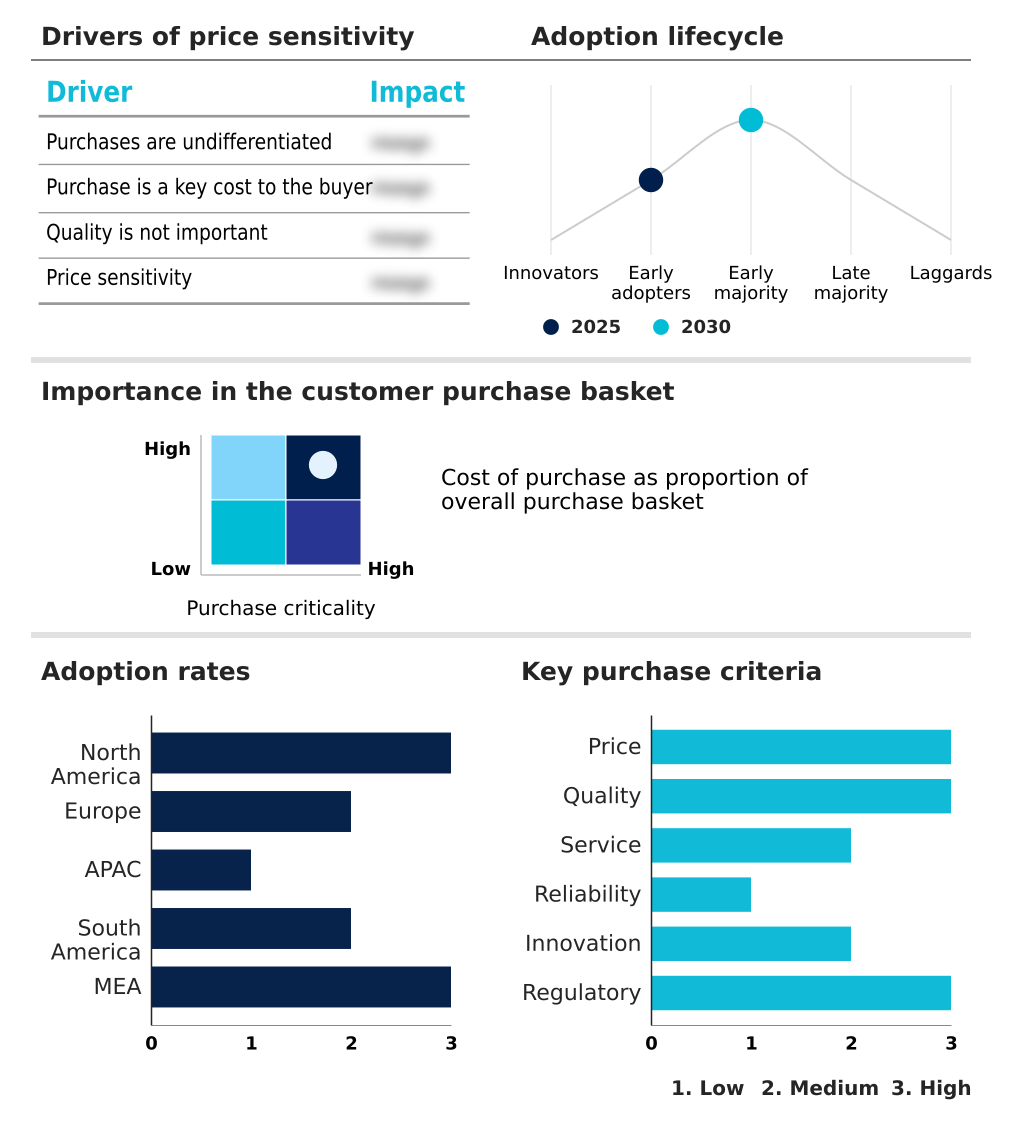
Customer Landscape of Snowmobile Industry

Competitive Landscape

Companies are implementing various strategies, such as strategic alliances, snowmobile market forecast, partnerships, mergers and acquisitions, geographical expansion, and product/service launches, to enhance their presence in the industry.

Alpina Snowmobiles - The company’s portfolio is distinguished by its comprehensive snowmobile lineup, offering specialized platforms for every terrain from deep snow to touring and utility applications.

The industry research and growth report includes detailed analyses of the competitive landscape of the market and information about key companies, including:

  • Alpina Snowmobiles
  • Bombardier Recreational Products Inc.
  • Polaris Inc.
  • Textron Inc.
  • Vidde Mobility

Qualitative and quantitative analysis of companies has been conducted to help clients understand the wider business environment as well as the strengths and weaknesses of key industry players. Data is qualitatively analyzed to categorize companies as pure play, category-focused, industry-focused, and diversified; it is quantitatively analyzed to categorize companies as dominant, leading, strong, tentative, and weak.

Market Intelligence Radar: High-Impact Developments & Growth Signals

  • In the Leisure Products industry, a significant increase in dual-income households has boosted discretionary spending on high-cost recreational items, directly fueling demand for new and technologically advanced snowmobiles.
  • A growing consumer preference for experiential travel and outdoor adventures has amplified the winter tourism economy, prompting ski resorts and lodges to expand their snowmobile rental fleets and guided tour offerings.
  • The imposition of new trade barriers and tariffs has disrupted the powersports supply chain, increasing the cost of raw materials and imported components, which in turn elevates the final price of snowmobiles for consumers.
  • Heightened environmental awareness and stricter regulatory compliances regarding noise and emissions are compelling manufacturers to accelerate R&D in electric powertrains and cleaner four-stroke engine technology.

Dive into Technavio’s robust research methodology, blending expert interviews, extensive data synthesis, and validated models for unparalleled Snowmobile Market insights. See full methodology.

Market Scope
Page number 260
Base year 2025
Historic period 2020-2024
Forecast period 2026-2030
Growth momentum & CAGR Accelerate at a CAGR of 4.3%
Market growth 2026-2030 USD 378.8 million
Market structure Concentrated
YoY growth 2025-2026(%) 4.1%
Key countries US, Canada, Mexico, Germany, France, Italy, UK, Spain, The Netherlands, Japan, South Korea, China, Australia, India, Indonesia, Brazil, Argentina, Colombia, Saudi Arabia, Turkey, UAE, South Africa and Israel
Competitive landscape Leading Companies, Market Positioning of Companies, Competitive Strategies, and Industry Risks

Request Free Sample

Research Analyst Overview

  • The snowmobile market ecosystem is a specialized value chain where a few key OEMs command over 90% of the market share. These manufacturers rely on a global network of suppliers for critical inputs like high-performance engines, semi-active suspension systems, and increasingly, semiconductor-based telematics. The shift toward electric powertrain technology is introducing new players from the battery sector.
  • Distribution is handled through a highly seasonal dealership network, which also provides vital aftermarket support. End-users are segmented into recreational riders, who drive demand for high-performance recreational sleds, and commercial operators in sectors like the winter tourism economy.
  • Regulatory bodies influence product design through emissions standards, mandating the use of four-stroke engines that now account for nearly 35% of new sales in certain regions.

What are the Key Data Covered in this Snowmobile Market Research and Growth Report?

  • What is the expected growth of the Snowmobile Market between 2026 and 2030?

    • The Snowmobile Market is expected to grow by USD 378.8 million during 2026-2030, registering a CAGR of 4.3%. Year-over-year growth in 2026 is estimated at 4.1%%. This acceleration is shaped by high disposable income in cold-climate regions, which is intensifying demand across multiple end-use verticals covered in the report.

  • What segmentation does the market report cover?

    • The report is segmented by Type (Trail, Mountain, and Crossover), Application (Recreation, and Utility), Engine Capacity (2-stroke, and 4-stroke) and Geography (North America, Europe, APAC, South America, Middle East and Africa). Among these, the Trail segment is estimated to witness significant growth during the forecast period, driven by rising adoption across key application areas. Each segment includes detailed qualitative and quantitative analysis, along with historical data from 2020-2024 and forecasts through 2030 with year-over-year growth rates.

  • Which regions are analyzed in the report?

    • The report covers North America, Europe, APAC, South America and Middle East and Africa. North America is estimated to contribute 43.2% to market growth during the forecast period. Country-level analysis includes US, Canada, Mexico, Germany, France, Italy, UK, Spain, The Netherlands, Japan, South Korea, China, Australia, India, Indonesia, Brazil, Argentina, Colombia, Saudi Arabia, Turkey, UAE, South Africa and Israel, with dedicated market size tables and year-over-year growth for each.

  • What are the key growth drivers and market challenges?

    • The primary driver is high disposable income in cold-climate regions, which is accelerating investment and industry demand. The main challenge is impact of climate change on snow season duration, creating operational barriers for key market participants. The report quantifies the impact of each driver and challenge across 2026 and 2030 with comparative analysis.

  • Who are the major players in the Snowmobile Market?

    • Key vendors include Alpina Snowmobiles, Bombardier Recreational Products Inc., Polaris Inc., Textron Inc. and Vidde Mobility. The report provides qualitative and quantitative analysis categorizing companies as dominant, leading, strong, tentative, and weak based on their market positioning. Company profiles include business segment analysis, SWOT assessment, key offerings, and recent strategic developments.

Market Research Insights

  • The competitive landscape of the snowmobile market is highly consolidated, with the top three players accounting for over 90% of global sales. Key vendors such as Bombardier Recreational Products Inc. (BRP) and Polaris Inc. continue to drive innovation, focusing on high-performance engine technology and integrated digital displays.
  • For instance, BRP has refined its chassis platforms, while Polaris has emphasized rider-assist systems, which have improved backcountry safety by up to 20% with real-time group tracking features. Textron Inc.’s Arctic Cat brand is streamlining its product line around its Catalyst platform to engage its core enthusiast base.
  • A notable development is the strategic exit of Yamaha from the market, a move expected to redistribute market share among the remaining incumbents. These companies are adapting to the challenge of land access restrictions by developing quieter, low-emission vehicles and engaging in advocacy for shared-use land policies.

We can help! Our analysts can customize this snowmobile market research report to meet your requirements.

Get in touch

1. Executive Summary

1.1 Market overview

Executive Summary - Chart on Market Overview
Executive Summary - Data Table on Market Overview
Executive Summary - Chart on Global Market Characteristics
Executive Summary - Chart on Market by Geography
Executive Summary - Chart on Market Segmentation by Type
Executive Summary - Chart on Market Segmentation by Application
Executive Summary - Chart on Market Segmentation by Engine Capacity
Executive Summary - Chart on Incremental Growth
Executive Summary - Data Table on Incremental Growth
Executive Summary - Chart on Company Market Positioning

2. Technavio Analysis

2.1 Analysis of price sensitivity, lifecycle, customer purchase basket, adoption rates, and purchase criteria

2.2 Criticality of inputs and Factors of differentiation

Chart on Overview on criticality of inputs and factors of differentiation

2.3 Factors of disruption

Chart on Overview on factors of disruption

2.4 Impact of drivers and challenges

Chart on Impact of drivers and challenges in 2025 and 2030

3. Market Landscape

3.1 Market ecosystem

Chart on Parent Market
Data Table on - Parent Market

3.2 Market characteristics

Chart on Market characteristics analysis

3.3 Value chain analysis

Chart on Value chain analysis

4. Market Sizing

4.1 Market definition

Data Table on Offerings of companies included in the market definition

4.2 Market segment analysis

Market segments

4.3 Market size 2025

4.4 Market outlook: Forecast for 2025-2030

Chart on Global - Market size and forecast 2025-2030 ($ million)
Data Table on Global - Market size and forecast 2025-2030 ($ million)
Chart on Global Market: Year-over-year growth 2025-2030 (%)
Data Table on Global Market: Year-over-year growth 2025-2030 (%)

5. Historic Market Size

5.1 Global Snowmobile Market 2020 - 2024

Historic Market Size - Data Table on Global Snowmobile Market 2020 - 2024 ($ million)

5.2 Type segment analysis 2020 - 2024

Historic Market Size - Type Segment 2020 - 2024 ($ million)

5.3 Application segment analysis 2020 - 2024

Historic Market Size - Application Segment 2020 - 2024 ($ million)

5.4 Engine Capacity segment analysis 2020 - 2024

Historic Market Size - Engine Capacity Segment 2020 - 2024 ($ million)

5.5 Geography segment analysis 2020 - 2024

Historic Market Size - Geography Segment 2020 - 2024 ($ million)

5.6 Country segment analysis 2020 - 2024

Historic Market Size - Country Segment 2020 - 2024 ($ million)

6. Qualitative Analysis

6.1 Impact of AI on the Global Snowmobile Market

7. Five Forces Analysis

7.1 Five forces summary

Five forces analysis - Comparison between 2025 and 2030

7.2 Bargaining power of buyers

Bargaining power of buyers - Impact of key factors 2025 and 2030

7.3 Bargaining power of suppliers

Bargaining power of suppliers - Impact of key factors in 2025 and 2030

7.4 Threat of new entrants

Threat of new entrants - Impact of key factors in 2025 and 2030

7.5 Threat of substitutes

Threat of substitutes - Impact of key factors in 2025 and 2030

7.6 Threat of rivalry

Threat of rivalry - Impact of key factors in 2025 and 2030

7.7 Market condition

Chart on Market condition - Five forces 2025 and 2030

8. Market Segmentation by Type

8.1 Market segments

Chart on Type - Market share 2025-2030 (%)
Data Table on Type - Market share 2025-2030 (%)

8.2 Comparison by Type

Chart on Comparison by Type
Data Table on Comparison by Type

8.3 Trail - Market size and forecast 2025-2030

Chart on Trail - Market size and forecast 2025-2030 ($ million)
Data Table on Trail - Market size and forecast 2025-2030 ($ million)
Chart on Trail - Year-over-year growth 2025-2030 (%)
Data Table on Trail - Year-over-year growth 2025-2030 (%)

8.4 Mountain - Market size and forecast 2025-2030

Chart on Mountain - Market size and forecast 2025-2030 ($ million)
Data Table on Mountain - Market size and forecast 2025-2030 ($ million)
Chart on Mountain - Year-over-year growth 2025-2030 (%)
Data Table on Mountain - Year-over-year growth 2025-2030 (%)

8.5 Crossover - Market size and forecast 2025-2030

Chart on Crossover - Market size and forecast 2025-2030 ($ million)
Data Table on Crossover - Market size and forecast 2025-2030 ($ million)
Chart on Crossover - Year-over-year growth 2025-2030 (%)
Data Table on Crossover - Year-over-year growth 2025-2030 (%)

8.6 Market opportunity by Type

Market opportunity by Type ($ million)
Data Table on Market opportunity by Type ($ million)

9. Market Segmentation by Application

9.1 Market segments

Chart on Application - Market share 2025-2030 (%)
Data Table on Application - Market share 2025-2030 (%)

9.2 Comparison by Application

Chart on Comparison by Application
Data Table on Comparison by Application

9.3 Recreation - Market size and forecast 2025-2030

Chart on Recreation - Market size and forecast 2025-2030 ($ million)
Data Table on Recreation - Market size and forecast 2025-2030 ($ million)
Chart on Recreation - Year-over-year growth 2025-2030 (%)
Data Table on Recreation - Year-over-year growth 2025-2030 (%)

9.4 Utility - Market size and forecast 2025-2030

Chart on Utility - Market size and forecast 2025-2030 ($ million)
Data Table on Utility - Market size and forecast 2025-2030 ($ million)
Chart on Utility - Year-over-year growth 2025-2030 (%)
Data Table on Utility - Year-over-year growth 2025-2030 (%)

9.5 Market opportunity by Application

Market opportunity by Application ($ million)
Data Table on Market opportunity by Application ($ million)

10. Market Segmentation by Engine Capacity

10.1 Market segments

Chart on Engine Capacity - Market share 2025-2030 (%)
Data Table on Engine Capacity - Market share 2025-2030 (%)

10.2 Comparison by Engine Capacity

Chart on Comparison by Engine Capacity
Data Table on Comparison by Engine Capacity

10.3 2-stroke - Market size and forecast 2025-2030

Chart on 2-stroke - Market size and forecast 2025-2030 ($ million)
Data Table on 2-stroke - Market size and forecast 2025-2030 ($ million)
Chart on 2-stroke - Year-over-year growth 2025-2030 (%)
Data Table on 2-stroke - Year-over-year growth 2025-2030 (%)

10.4 4-stroke - Market size and forecast 2025-2030

Chart on 4-stroke - Market size and forecast 2025-2030 ($ million)
Data Table on 4-stroke - Market size and forecast 2025-2030 ($ million)
Chart on 4-stroke - Year-over-year growth 2025-2030 (%)
Data Table on 4-stroke - Year-over-year growth 2025-2030 (%)

10.5 Market opportunity by Engine Capacity

Market opportunity by Engine Capacity ($ million)
Data Table on Market opportunity by Engine Capacity ($ million)

11. Customer Landscape

11.1 Customer landscape overview

Analysis of price sensitivity, lifecycle, customer purchase basket, adoption rates, and purchase criteria

12. Geographic Landscape

12.1 Geographic segmentation

Chart on Market share by geography 2025-2030 (%)
Data Table on Market share by geography 2025-2030 (%)

12.2 Geographic comparison

Chart on Geographic comparison
Data Table on Geographic comparison

12.3 North America - Market size and forecast 2025-2030

Chart on North America - Market size and forecast 2025-2030 ($ million)
Data Table on North America - Market size and forecast 2025-2030 ($ million)
Chart on North America - Year-over-year growth 2025-2030 (%)
Data Table on North America - Year-over-year growth 2025-2030 (%)
Chart on Regional Comparison - North America
Data Table on Regional Comparison - North America

12.3.1 US - Market size and forecast 2025-2030

Chart on US - Market size and forecast 2025-2030 ($ million)
Data Table on US - Market size and forecast 2025-2030 ($ million)
Chart on US - Year-over-year growth 2025-2030 (%)
Data Table on US - Year-over-year growth 2025-2030 (%)

12.3.2 Canada - Market size and forecast 2025-2030

Chart on Canada - Market size and forecast 2025-2030 ($ million)
Data Table on Canada - Market size and forecast 2025-2030 ($ million)
Chart on Canada - Year-over-year growth 2025-2030 (%)
Data Table on Canada - Year-over-year growth 2025-2030 (%)

12.3.3 Mexico - Market size and forecast 2025-2030

Chart on Mexico - Market size and forecast 2025-2030 ($ million)
Data Table on Mexico - Market size and forecast 2025-2030 ($ million)
Chart on Mexico - Year-over-year growth 2025-2030 (%)
Data Table on Mexico - Year-over-year growth 2025-2030 (%)

12.4 Europe - Market size and forecast 2025-2030

Chart on Europe - Market size and forecast 2025-2030 ($ million)
Data Table on Europe - Market size and forecast 2025-2030 ($ million)
Chart on Europe - Year-over-year growth 2025-2030 (%)
Data Table on Europe - Year-over-year growth 2025-2030 (%)
Chart on Regional Comparison - Europe
Data Table on Regional Comparison - Europe

12.4.1 Germany - Market size and forecast 2025-2030

Chart on Germany - Market size and forecast 2025-2030 ($ million)
Data Table on Germany - Market size and forecast 2025-2030 ($ million)
Chart on Germany - Year-over-year growth 2025-2030 (%)
Data Table on Germany - Year-over-year growth 2025-2030 (%)

12.4.2 France - Market size and forecast 2025-2030

Chart on France - Market size and forecast 2025-2030 ($ million)
Data Table on France - Market size and forecast 2025-2030 ($ million)
Chart on France - Year-over-year growth 2025-2030 (%)
Data Table on France - Year-over-year growth 2025-2030 (%)

12.4.3 Italy - Market size and forecast 2025-2030

Chart on Italy - Market size and forecast 2025-2030 ($ million)
Data Table on Italy - Market size and forecast 2025-2030 ($ million)
Chart on Italy - Year-over-year growth 2025-2030 (%)
Data Table on Italy - Year-over-year growth 2025-2030 (%)

12.4.4 UK - Market size and forecast 2025-2030

Chart on UK - Market size and forecast 2025-2030 ($ million)
Data Table on UK - Market size and forecast 2025-2030 ($ million)
Chart on UK - Year-over-year growth 2025-2030 (%)
Data Table on UK - Year-over-year growth 2025-2030 (%)

12.4.5 Spain - Market size and forecast 2025-2030

Chart on Spain - Market size and forecast 2025-2030 ($ million)
Data Table on Spain - Market size and forecast 2025-2030 ($ million)
Chart on Spain - Year-over-year growth 2025-2030 (%)
Data Table on Spain - Year-over-year growth 2025-2030 (%)

12.4.6 The Netherlands - Market size and forecast 2025-2030

Chart on The Netherlands - Market size and forecast 2025-2030 ($ million)
Data Table on The Netherlands - Market size and forecast 2025-2030 ($ million)
Chart on The Netherlands - Year-over-year growth 2025-2030 (%)
Data Table on The Netherlands - Year-over-year growth 2025-2030 (%)

12.5 APAC - Market size and forecast 2025-2030

Chart on APAC - Market size and forecast 2025-2030 ($ million)
Data Table on APAC - Market size and forecast 2025-2030 ($ million)
Chart on APAC - Year-over-year growth 2025-2030 (%)
Data Table on APAC - Year-over-year growth 2025-2030 (%)
Chart on Regional Comparison - APAC
Data Table on Regional Comparison - APAC

12.5.1 Japan - Market size and forecast 2025-2030

Chart on Japan - Market size and forecast 2025-2030 ($ million)
Data Table on Japan - Market size and forecast 2025-2030 ($ million)
Chart on Japan - Year-over-year growth 2025-2030 (%)
Data Table on Japan - Year-over-year growth 2025-2030 (%)

12.5.2 South Korea - Market size and forecast 2025-2030

Chart on South Korea - Market size and forecast 2025-2030 ($ million)
Data Table on South Korea - Market size and forecast 2025-2030 ($ million)
Chart on South Korea - Year-over-year growth 2025-2030 (%)
Data Table on South Korea - Year-over-year growth 2025-2030 (%)

12.5.3 China - Market size and forecast 2025-2030

Chart on China - Market size and forecast 2025-2030 ($ million)
Data Table on China - Market size and forecast 2025-2030 ($ million)
Chart on China - Year-over-year growth 2025-2030 (%)
Data Table on China - Year-over-year growth 2025-2030 (%)

12.5.4 Australia - Market size and forecast 2025-2030

Chart on Australia - Market size and forecast 2025-2030 ($ million)
Data Table on Australia - Market size and forecast 2025-2030 ($ million)
Chart on Australia - Year-over-year growth 2025-2030 (%)
Data Table on Australia - Year-over-year growth 2025-2030 (%)

12.5.5 India - Market size and forecast 2025-2030

Chart on India - Market size and forecast 2025-2030 ($ million)
Data Table on India - Market size and forecast 2025-2030 ($ million)
Chart on India - Year-over-year growth 2025-2030 (%)
Data Table on India - Year-over-year growth 2025-2030 (%)

12.5.6 Indonesia - Market size and forecast 2025-2030

Chart on Indonesia - Market size and forecast 2025-2030 ($ million)
Data Table on Indonesia - Market size and forecast 2025-2030 ($ million)
Chart on Indonesia - Year-over-year growth 2025-2030 (%)
Data Table on Indonesia - Year-over-year growth 2025-2030 (%)

12.6 South America - Market size and forecast 2025-2030

Chart on South America - Market size and forecast 2025-2030 ($ million)
Data Table on South America - Market size and forecast 2025-2030 ($ million)
Chart on South America - Year-over-year growth 2025-2030 (%)
Data Table on South America - Year-over-year growth 2025-2030 (%)
Chart on Regional Comparison - South America
Data Table on Regional Comparison - South America

12.6.1 Brazil - Market size and forecast 2025-2030

Chart on Brazil - Market size and forecast 2025-2030 ($ million)
Data Table on Brazil - Market size and forecast 2025-2030 ($ million)
Chart on Brazil - Year-over-year growth 2025-2030 (%)
Data Table on Brazil - Year-over-year growth 2025-2030 (%)

12.6.2 Argentina - Market size and forecast 2025-2030

Chart on Argentina - Market size and forecast 2025-2030 ($ million)
Data Table on Argentina - Market size and forecast 2025-2030 ($ million)
Chart on Argentina - Year-over-year growth 2025-2030 (%)
Data Table on Argentina - Year-over-year growth 2025-2030 (%)

12.6.3 Colombia - Market size and forecast 2025-2030

Chart on Colombia - Market size and forecast 2025-2030 ($ million)
Data Table on Colombia - Market size and forecast 2025-2030 ($ million)
Chart on Colombia - Year-over-year growth 2025-2030 (%)
Data Table on Colombia - Year-over-year growth 2025-2030 (%)

12.7 Middle East and Africa - Market size and forecast 2025-2030

Chart on Middle East and Africa - Market size and forecast 2025-2030 ($ million)
Data Table on Middle East and Africa - Market size and forecast 2025-2030 ($ million)
Chart on Middle East and Africa - Year-over-year growth 2025-2030 (%)
Data Table on Middle East and Africa - Year-over-year growth 2025-2030 (%)
Chart on Regional Comparison - Middle East and Africa
Data Table on Regional Comparison - Middle East and Africa

12.7.1 Saudi Arabia - Market size and forecast 2025-2030

Chart on Saudi Arabia - Market size and forecast 2025-2030 ($ million)
Data Table on Saudi Arabia - Market size and forecast 2025-2030 ($ million)
Chart on Saudi Arabia - Year-over-year growth 2025-2030 (%)
Data Table on Saudi Arabia - Year-over-year growth 2025-2030 (%)

12.7.2 Turkey - Market size and forecast 2025-2030

Chart on Turkey - Market size and forecast 2025-2030 ($ million)
Data Table on Turkey - Market size and forecast 2025-2030 ($ million)
Chart on Turkey - Year-over-year growth 2025-2030 (%)
Data Table on Turkey - Year-over-year growth 2025-2030 (%)

12.7.3 UAE - Market size and forecast 2025-2030

Chart on UAE - Market size and forecast 2025-2030 ($ million)
Data Table on UAE - Market size and forecast 2025-2030 ($ million)
Chart on UAE - Year-over-year growth 2025-2030 (%)
Data Table on UAE - Year-over-year growth 2025-2030 (%)

12.7.4 South Africa - Market size and forecast 2025-2030

Chart on South Africa - Market size and forecast 2025-2030 ($ million)
Data Table on South Africa - Market size and forecast 2025-2030 ($ million)
Chart on South Africa - Year-over-year growth 2025-2030 (%)
Data Table on South Africa - Year-over-year growth 2025-2030 (%)

12.7.5 Israel - Market size and forecast 2025-2030

Chart on Israel - Market size and forecast 2025-2030 ($ million)
Data Table on Israel - Market size and forecast 2025-2030 ($ million)
Chart on Israel - Year-over-year growth 2025-2030 (%)
Data Table on Israel - Year-over-year growth 2025-2030 (%)

12.8 Market opportunity by geography

Market opportunity by geography ($ million)
Data Tables on Market opportunity by geography ($ million)

13. Drivers, Challenges, and Opportunity

13.1 Market drivers

High disposable income in cold-climate regions
Expansion of winter tourism and recreational spending
Technological advancements in connectivity and safety

13.2 Market challenges

Impact of climate change on snow season duration
High cost of ownership and economic inflation
Strict environmental regulations and land access restrictions

13.3 Impact of drivers and challenges

Impact of drivers and challenges in 2025 and 2030

13.4 Market opportunities

Transition toward electrification and sustainable powertrains
Integration of smart rider assistance systems
Surge in demand for crossover and multi-utility vehicles

14. Competitive Landscape

14.1 Overview

14.2

Overview on criticality of inputs and factors of differentiation

14.3 Landscape disruption

Overview on factors of disruption

14.4 Industry risks

Impact of key risks on business

15. Competitive Analysis

15.1 Companies profiled

Companies covered

15.2 Company ranking index

15.3 Market positioning of companies

Matrix on companies position and classification

15.4 Alpina Snowmobiles

Alpina Snowmobiles - Overview
Alpina Snowmobiles - Product / Service
Alpina Snowmobiles - Key offerings
SWOT

15.5 Bombardier Recreational Products Inc.

Bombardier Recreational Products Inc. - Overview
Bombardier Recreational Products Inc. - Business segments
Bombardier Recreational Products Inc. - Key offerings
Bombardier Recreational Products Inc. - Segment focus
SWOT

15.6 Polaris Inc.

Polaris Inc. - Overview
Polaris Inc. - Business segments
Polaris Inc. - Key news
Polaris Inc. - Key offerings
Polaris Inc. - Segment focus
SWOT

15.7 Textron Inc.

Textron Inc. - Overview
Textron Inc. - Business segments
Textron Inc. - Key offerings
Textron Inc. - Segment focus
SWOT

15.8 Vidde Mobility

Vidde Mobility - Overview
Vidde Mobility - Product / Service
Vidde Mobility - Key offerings
SWOT

16. Appendix

16.1 Scope of the report

Market definition
Objectives
Notes and caveats

16.2 Inclusions and exclusions checklist

Inclusions checklist
Exclusions checklist

16.3 Currency conversion rates for US$

16.4 Research methodology

16.5 Data procurement

Information sources

16.6 Data validation

16.7 Validation techniques employed for market sizing

16.8 Data synthesis

16.9 360 degree market analysis

16.10 List of abbreviations

Research Methodology

Technavio presents a detailed picture of the market by way of study, synthesis, and summation of data from multiple sources. The analysts have presented the various facets of the market with a particular focus on identifying the key industry influencers. The data thus presented is comprehensive, reliable, and the result of extensive research, both primary and secondary.

INFORMATION SOURCES

Primary sources

  • Manufacturers and suppliers
  • Channel partners
  • Industry experts
  • Strategic decision makers

Secondary sources

  • Industry journals and periodicals
  • Government data
  • Financial reports of key industry players
  • Historical data
  • Press releases

DATA ANALYSIS

Data Synthesis

  • Collation of data
  • Estimation of key figures
  • Analysis of derived insights

Data Validation

  • Triangulation with data models
  • Reference against proprietary databases
  • Corroboration with industry experts

REPORT WRITING

Qualitative

  • Market drivers
  • Market challenges
  • Market trends
  • Five forces analysis

Quantitative

  • Market size and forecast
  • Market segmentation
  • Geographical insights
  • Competitive landscape

Interested in this report?

Get your sample now to see our research methodology and insights!

Download Now

Frequently Asked Questions

Snowmobile market growth will increase by USD 378.8 million during 2026-2030.

The Snowmobile market is expected to grow at a CAGR of 4.3% during 2026-2030.

Snowmobile market is segmented by Type (Trail, Mountain, Crossover) Application (Recreation, Utility) Engine capacity (2-stroke, 4-stroke)

Alpina Snowmobiles, Bombardier Recreational Products Inc., Polaris Inc., Textron Inc., Vidde Mobility are a few of the key vendors in the Snowmobile market.

North America will register the highest growth rate of 43.2% among the other regions. Therefore, the Snowmobile market in North America is expected to garner significant business opportunities for the vendors during the forecast period.

US, Canada, Mexico, Germany, France, Italy, UK, Spain, The Netherlands, Japan, South Korea, China, Australia, India, Indonesia, Brazil, Argentina, Colombia, Saudi Arabia, Turkey, UAE, South Africa, Israel

  • High disposable income in cold-climate regions is the driving factor this market.

The Snowmobile market vendors should focus on grabbing business opportunities from the Type segment as it accounted for the largest market share in the base year.
RIA - Research AI Assistant
Ask RIA