North America Smart Home Water Sensor And Controller Market Size 2026-2030
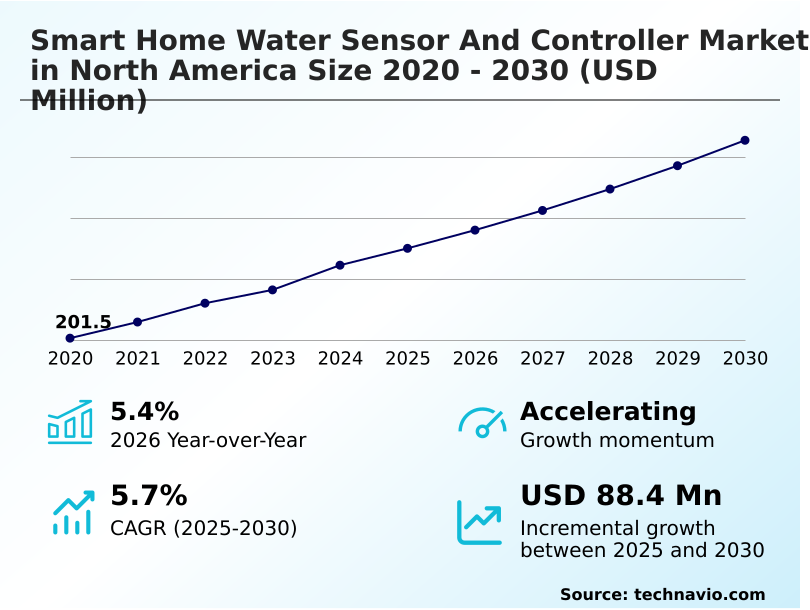
The North America Smart Home Water Sensor And Controller Market size was valued at USD 275 million in 2025, growing at a CAGR of 5.7% during the forecast period 2026-2030.
Major Market Trends & Insights
- By Type - Wi-Fi segment was valued at USD 176.6 million in 2024
- By Application - Commercial and industrial segment accounted for the largest market revenue share in 2024
Market Size & Forecast
- Historic Market Opportunities 2020-2024: USD 161.9 million
- Market Future Opportunities 2025-2030: USD 88.4 million
- CAGR from 2025 to 2030 : 5.7%
Market Summary
- The market for smart home water sensors and controllers is defined by a critical need for proactive property protection, where devices prevent an average of 93% of water damage claims when installed. These systems utilize Wi-Fi or Zigbee technologies to monitor plumbing for leaks and automatically shut off the main water supply, sending real-time mobile alerts to homeowners.
- For instance, a residential developer might integrate whole-home water protection systems as a standard feature, which reduces long-term maintenance liabilities and lowers homeowner insurance premiums by up to 15%. A key driver is the increasing frequency of water damage incidents and the high cost of repairs, pushing consumers toward preventive solutions.
- However, the high initial cost of the devices and associated professional installation remains a significant challenge, limiting adoption to tech-savvy consumers and high-value properties.
What will be the Size of the North America Smart Home Water Sensor And Controller Market during the forecast period?
Get Key Insights on Market Forecast (PDF) Request Free Sample
How is the North America Smart Home Water Sensor And Controller Market Segmented?
The north america smart home water sensor and controller industry research report provides comprehensive data (region-wise segment analysis), with forecasts and analysis for the period 2026-2030, as well as historical data from 2020-2024 for the following segments.
- Type
- Wi-Fi
- Zigbee
- Others
- Application
- Commercial and industrial
- Residential
- Distribution channel
- Offline
- Online
- Geography
- North America
- US
- Canada
- Mexico
- North America
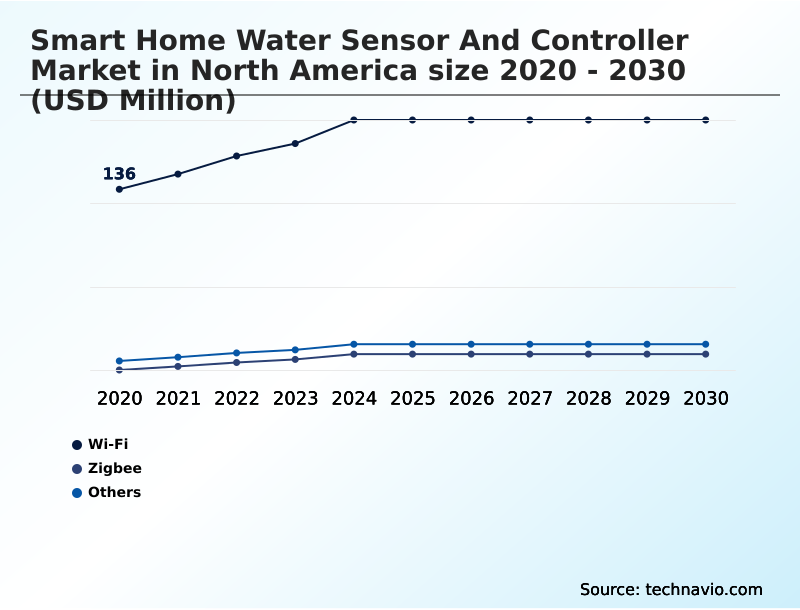
How is the North America Smart Home Water Sensor And Controller Market Segmented by Type?
The wi-fi segment is estimated to witness significant growth during the forecast period.
The market is segmented by technology, with Wi-Fi-based devices holding a dominant share, representing over 67% of sales due to a hub-free architecture and ease of DIY water sensor installation.
This segment’s growth is fueled by consumer preference for direct cloud connectivity, enabling remote water management and real-time mobile alerts.
In contrast, Zigbee and Z-Wave communication protocol devices, while a smaller segment, are critical for large-scale professional installations requiring robust mesh networking. For instance, these protocols are preferred for multi-unit residential monitoring.
The 'Others' segment, including Bluetooth Low Energy (BLE) connectivity and LoRaWAN sensor technology, caters to niche applications, with non-invasive pipe sensor designs for temporary setups and long-range solutions for expansive properties.
This differentiation impacts product strategy, focusing on either user-friendly smart home ecosystem integration or specialized plumbing system diagnostics.
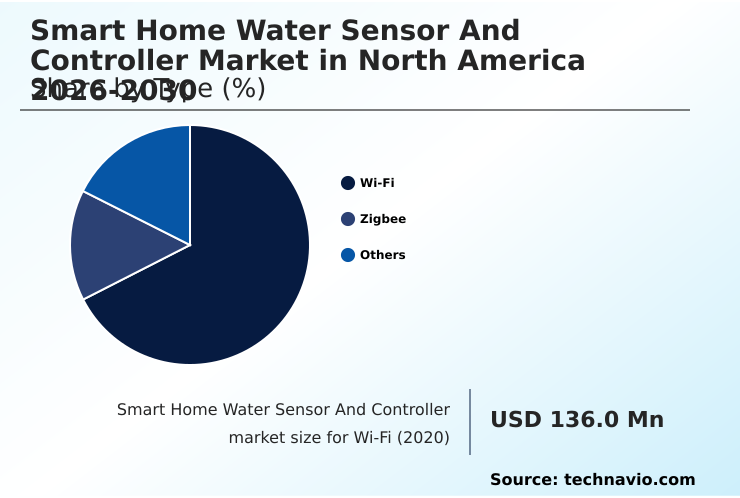
The Wi-Fi segment was valued at USD 176.6 million in 2024 and showed a gradual increase during the forecast period.
What are the key Drivers, Trends, and Challenges in the North America Smart Home Water Sensor And Controller Market?
Our researchers analyzed the data with 2025 as the base year, along with the key drivers, trends, and challenges. A holistic analysis of drivers will help companies refine their marketing strategies to gain a competitive advantage.
- Homeowners evaluating the best smart water shut off valve for homes are increasingly looking beyond basic alerts to systems offering comprehensive whole-home water protection. A key consideration is the installation process, leading many to research how to install a whole house water monitor and weighing the benefits of professional setup versus DIY-friendly models.
- The market has responded with advanced Wi-Fi water leak detector with automatic shutoff systems that integrate seamlessly into existing smart home platforms. When comparing Zigbee vs Z-Wave water sensors, consumers often find that Zigbee offers wider compatibility with mainstream hubs, while Z-Wave provides a less crowded frequency for potentially more reliable communication.
- The benefits of AI-powered leak detection systems are a significant factor, as these platforms use machine learning to differentiate between normal use and a catastrophic leak, reducing false alarms by over 40%.
- For targeted protection, a smart water sensor for basement flood prevention is a popular choice, often representing the first step for consumers in building a more resilient home water management strategy. The shift towards proactive solutions is clear, as systems with automated shutoff capabilities can prevent more than nine out of ten major water damage incidents.
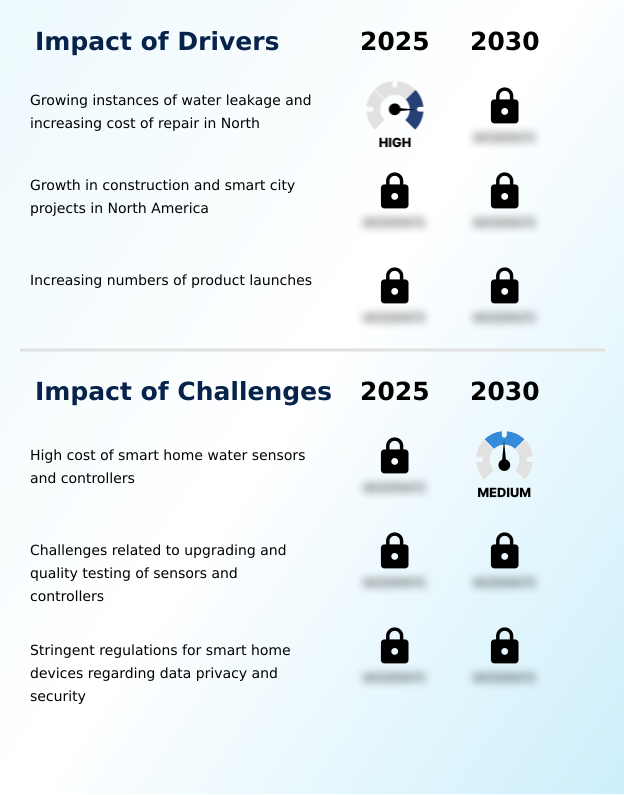
What are the key market drivers leading to the rise in the adoption of North America Smart Home Water Sensor And Controller Industry?
- The increasing instances of water leakage and the rising cost of associated repairs across North America are a key driver for the market.
- The market is heavily driven by the financial burdens of water damage, with insurance data showing that whole-home water protection systems with an automated water shutoff and smart water valve actuator see up to a 93% reduction in claim costs.
- This compelling ROI is fueling adoption, particularly as construction firms incorporate smart building integration into new builds. The increasing availability of property insurance incentives further motivates consumers.
- New devices offering real-time flow monitoring and water consumption tracking appeal to sustainability-conscious users seeking better water conservation reporting, ensuring more resilient infrastructure.
What are the market trends shaping the North America Smart Home Water Sensor And Controller Industry?
- Key market trends are centered on advancements in smart home water sensors and controllers, including innovations in sensing precision, communication capability, and automated response systems.
- A significant trend is the integration of advanced technologies, which improves device autonomy and precision, with the use of machine learning leak detection and predictive water analytics now allowing systems to reduce false alerts by over 40% compared to previous-generation models. This shift is driven by the need for more reliable proactive water mitigation.
- Advancements in Matter-compatible protocol support and smart home ecosystem integration enable seamless voice-activated control and inclusion in a home automation scene. This enhances user convenience and makes remote water management more intuitive, contributing to better preventive home maintenance and overall asset protection technology.
What challenges does the North America Smart Home Water Sensor And Controller Industry face during its growth?
- The high cost associated with smart home water sensors and controllers presents a key challenge affecting industry growth and wider market adoption.
- A primary challenge is the high upfront cost, which can be 3-5 times higher for systems requiring professional plumbing integration compared to DIY water sensor installation kits. This barrier is compounded by the technical complexities of upgrading legacy systems, as firmware over-the-air (FOTA) updates can fail on older hardware.
- Ensuring robust data privacy compliance adds significant R&D overhead, particularly for systems utilizing cloud-based data analytics and subscription-based monitoring. These factors slow the mass-market adoption of advanced features like ultrasonic water monitoring and micro-leak detection algorithms, confining them to premium segments and limiting the scaling of LoRaWAN sensor technology for multi-unit residential monitoring.
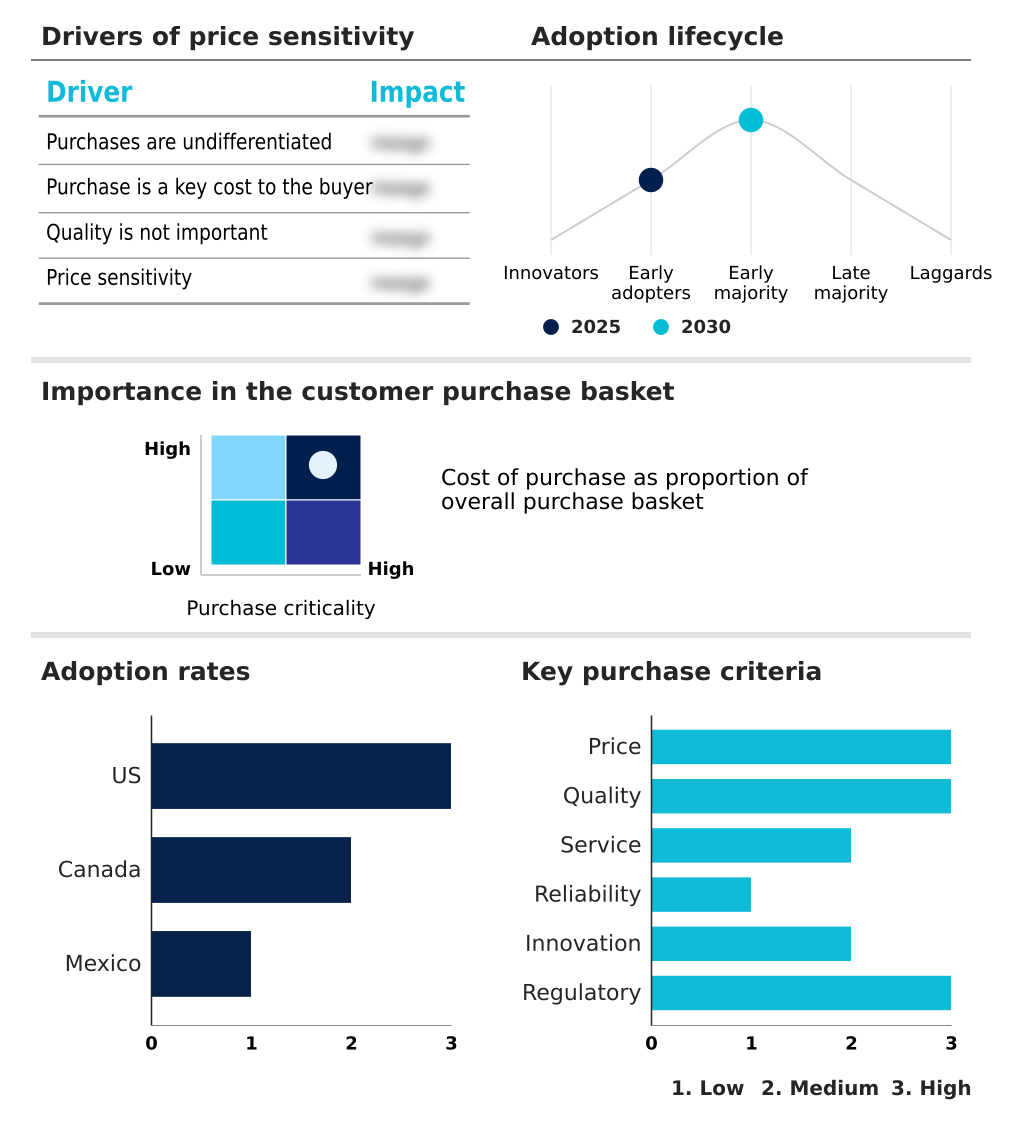
Exclusive Technavio Analysis on Customer Landscape
The north america smart home water sensor and controller market forecasting report includes the adoption lifecycle of the market, covering from the innovator’s stage to the laggard’s stage. It focuses on adoption rates in different regions based on penetration. Furthermore, the north america smart home water sensor and controller market report also includes key purchase criteria and drivers of price sensitivity to help companies evaluate and develop their market growth analysis strategies.
Customer Landscape of North America Smart Home Water Sensor And Controller Industry
Competitive Landscape
Companies are implementing various strategies, such as strategic alliances, north america smart home water sensor and controller market forecast, partnerships, mergers and acquisitions, geographical expansion, and product/service launches, to enhance their presence in the industry.
Conservation Labs Inc. - Delivering affordable IoT smart water monitors designed to manage consumption and mitigate risks from water-related incidents.
The industry research and growth report includes detailed analyses of the competitive landscape of the market and information about key companies, including:
- Conservation Labs Inc.
- D Link Corp.
- EcoNet Controls Inc.
- Flume Inc.
- Honeywell International Inc.
- Moen Inc.
- OVAL Digital Inc.
- Phyn LLC
- Sencentric Inc.
- Simplisafe Inc.
- Smartlabs Inc.
- SwitchBot
- Vivint Smart Home Inc.
- Wasserstein Home
- Waxman Industries Inc.
- Zircon Corp.
- Resideo Technologies Inc.
Qualitative and quantitative analysis of companies has been conducted to help clients understand the wider business environment as well as the strengths and weaknesses of key industry players. Data is qualitatively analyzed to categorize companies as pure play, category-focused, industry-focused, and diversified; it is quantitatively analyzed to categorize companies as dominant, leading, strong, tentative, and weak.
Market Intelligence Radar: High-Impact Developments & Growth Signals
- In the Household Appliances industry, the integration of IoT and AI into everyday products has accelerated, directly creating demand for interconnected devices like the smart home water sensor and controller that align with smart home ecosystem integration.
- Stringent energy efficiency and sustainability standards for new household appliances are expanding to include water conservation, compelling manufacturers to incorporate advanced water consumption tracking and management features.
- Persistent volatility in the price of semiconductors and plastics, critical components for all modern household appliances, directly impacts the production costs and final retail price of smart water management systems.
- A consumer shift toward product premiumization and convenience in home management has increased discretionary spending on advanced safety systems, boosting adoption of solutions offering proactive water mitigation and asset protection technology.
Dive into Technavio’s robust research methodology, blending expert interviews, extensive data synthesis, and validated models for unparalleled North America Smart Home Water Sensor And Controller Market insights. See full methodology.
| Market Scope | |
|---|---|
| Page number | 193 |
| Base year | 2025 |
| Historic period | 2020-2024 |
| Forecast period | 2026-2030 |
| Growth momentum & CAGR | Accelerate at a CAGR of 5.7% |
| Market growth 2026-2030 | USD 88.4 million |
| Market structure | Fragmented |
| YoY growth 2025-2026(%) | 5.4% |
| Key countries | US, Canada and Mexico |
| Competitive landscape | Leading Companies, Market Positioning of Companies, Competitive Strategies, and Industry Risks |
Research Analyst Overview
- The smart home water sensor and controller ecosystem involves a multi-layered value chain, with over 60% of device value derived from sophisticated semiconductor and sensor component suppliers. Manufacturers then integrate these components into finished products featuring Wi-Fi enabled water controller technology and automated water shutoff mechanisms.
- Distribution is bifurcated, with professional plumbing integration channels handling complex installations while direct-to-consumer online sales cater to the DIY market. Regulatory bodies and property insurance providers influence product standards and adoption rates, often providing incentives that reduce homeowner costs by 10-20%.
- End-users, ranging from individual homeowners to large-scale property managers, drive demand for water damage prevention and proactive water mitigation solutions, closing the loop.
What are the Key Data Covered in this North America Smart Home Water Sensor And Controller Market Research and Growth Report?
-
What is the expected growth of the North America Smart Home Water Sensor And Controller Market between 2026 and 2030?
-
The North America Smart Home Water Sensor And Controller Market is expected to grow by USD 88.4 million during 2026-2030, registering a CAGR of 5.7%. Year-over-year growth in 2026 is estimated at 5.4%%. This acceleration is shaped by growing instances of water leakage and increasing cost of repair in north, which is intensifying demand across multiple end-use verticals covered in the report.
-
-
What segmentation does the market report cover?
-
The report is segmented by Type (Wi-Fi, Zigbee, and Others), Application (Commercial and industrial, and Residential), Distribution Channel (Offline, and Online) and Geography (North America). Among these, the Wi-Fi segment is estimated to witness significant growth during the forecast period, driven by rising adoption across key application areas. Each segment includes detailed qualitative and quantitative analysis, along with historical data from 2020-2024 and forecasts through 2030 with year-over-year growth rates.
-
-
Which regions are analyzed in the report?
-
The report covers North America. Country-level analysis includes US, Canada and Mexico, with dedicated market size tables and year-over-year growth for each.
-
-
What are the key growth drivers and market challenges?
-
The primary driver is growing instances of water leakage and increasing cost of repair in north, which is accelerating investment and industry demand. The main challenge is high cost of smart home water sensors and controllers, creating operational barriers for key market participants. The report quantifies the impact of each driver and challenge across 2026 and 2030 with comparative analysis.
-
-
Who are the major players in the North America Smart Home Water Sensor And Controller Market?
-
Key vendors include Conservation Labs Inc., D Link Corp., EcoNet Controls Inc., Flume Inc., Honeywell International Inc., Moen Inc., OVAL Digital Inc., Phyn LLC, Sencentric Inc., Simplisafe Inc., Smartlabs Inc., SwitchBot, Vivint Smart Home Inc., Wasserstein Home, Waxman Industries Inc., Zircon Corp. and Resideo Technologies Inc.. The report provides qualitative and quantitative analysis categorizing companies as dominant, leading, strong, tentative, and weak based on their market positioning. Company profiles include business segment analysis, SWOT assessment, key offerings, and recent strategic developments.
-
Market Research Insights
- The competitive landscape for the smart home water sensor and controller market in North America is highly active, with the top three vendors commanding over 40% of the market share. Key players like Moen Inc. and Resideo Technologies Inc. are focused on enhancing their portfolios with AI-driven predictive capabilities.
- For example, recent product refinements include machine learning leak detection that can identify microscopic leaks, a feature that directly addresses growing consumer demand for proactive property management. These advancements align with a broader industry shift toward creating integrated smart home ecosystems.
- This innovation is crucial as vendors navigate the primary challenge of high product costs, compelling them to balance advanced features with affordability to expand their customer base beyond early adopters.
We can help! Our analysts can customize this north america smart home water sensor and controller market research report to meet your requirements.
 RIA -
RIA - 
