Smart Fitting Room Market Analysis, Size, and Forecast 2026-2030: North America (US, Canada, and Mexico), Europe (Germany, UK, and France), APAC (China, Japan, and India), Middle East and Africa (UAE, Saudi Arabia, and South Africa), South America (Brazil, Argentina, and Colombia), and Rest of World (ROW)

Smart Fitting Room Market Analysis, Size, and Forecast 2026-2030:
North America (US, Canada, and Mexico), Europe (Germany, UK, and France), APAC (China, Japan, and India), Middle East and Africa (UAE, Saudi Arabia, and South Africa), South America (Brazil, Argentina, and Colombia), and Rest of World (ROW)

Published: May 2026 291 Pages SKU: IRTNTR81327

Market Overview at a Glance

$2.18 B
Market Opportunity
18.2%
CAGR 2025 - 2030
40%
North America Growth
$473.7 Mn
AR and VR rooms segment 2024

Smart Fitting Room Market Size and Growth Forecast 2026-2030

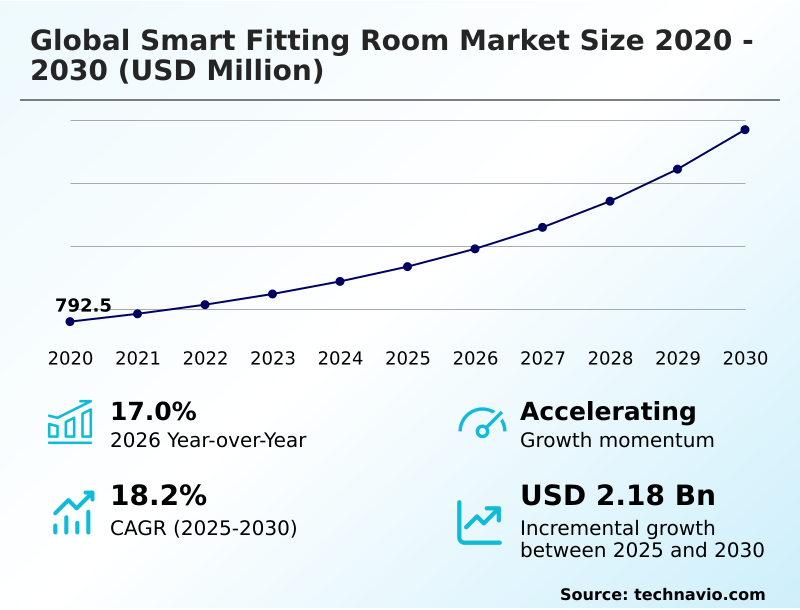
The Smart Fitting Room Market size was valued at USD 1.67 billion in 2025 growing at a CAGR of 18.2% during the forecast period 2026-2030.

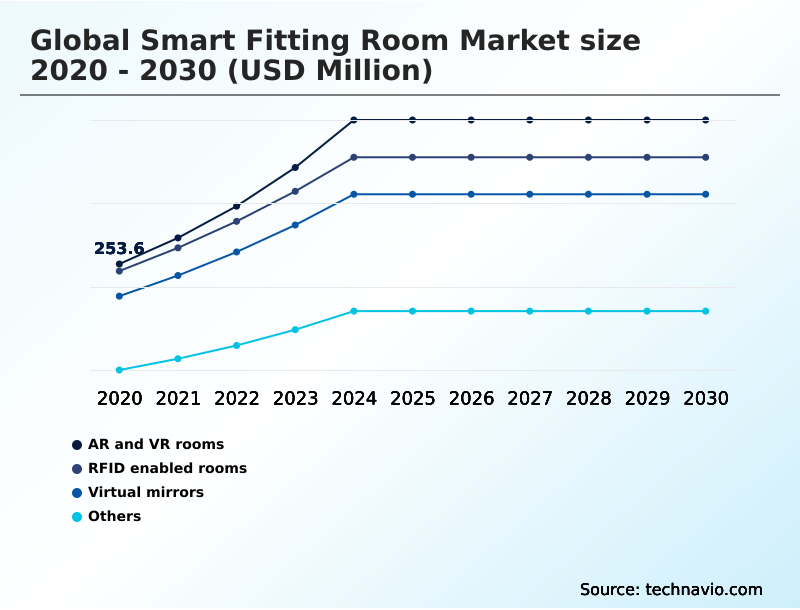
North America accounts for 40% of incremental growth during the forecast period. The AR and VR rooms segment by Technology was valued at USD 473.7 million in 2024, while the Hardware segment holds the largest revenue share by Component.

The market is projected to grow by USD 3.05 billion from 2020 to 2030, with USD 2.18 billion of the growth expected during the forecast period of 2025 to 2030.

Get Key Insights on Market Forecast (PDF) Request Free Sample

Smart Fitting Room Market Overview

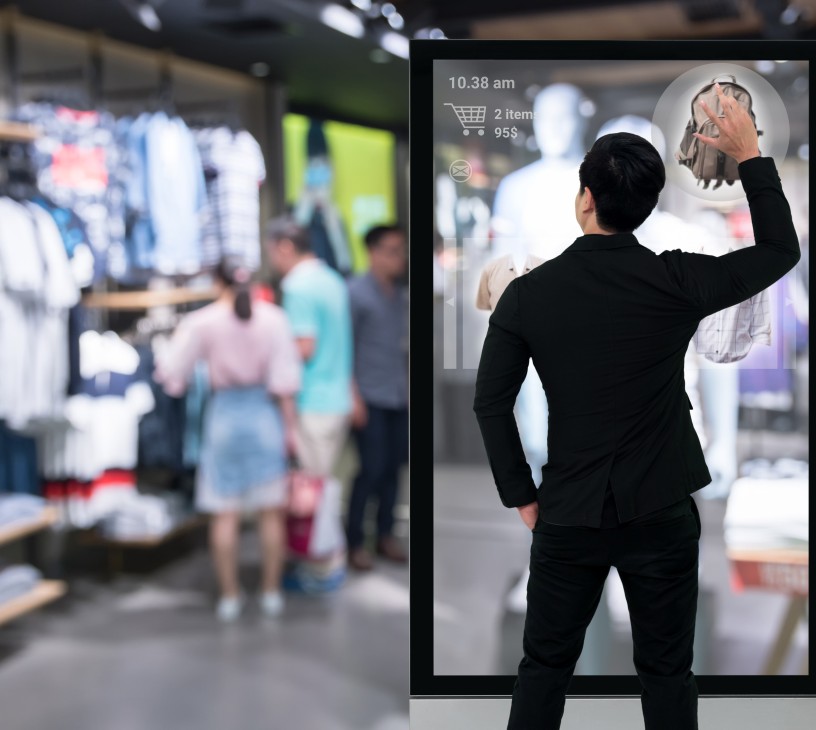
The Smart Fitting Room Market is experiencing a structural evolution, driven by a 17.0% year-over-year growth rate as retailers adopt technologies to merge physical and digital shopping. North America contributes nearly 40% of the incremental growth, with retailers in the region rapidly deploying solutions to reduce high e-commerce return rates. A key application is the use of augmented reality mirrors and virtual try-on engines to provide a hyper-personalized shopping experience. For example, a high-end apparel retailer in a flagship location can use 3D body scanning to create a customer's digital twin in seconds. This allows the shopper to use gesture controls to try on dozens of outfits virtually, with the system's computer vision algorithms showing how different fabrics drape and move, ultimately reducing size-related returns by up to 80%. This phygital retail synergy not only enhances the in-store customer experience but also provides valuable data for inventory management and design refinement, justifying the capital expenditure for advanced RFID sensors and generative AI avatars.

Drivers, Trends, and Challenges in the Smart Fitting Room Market

Strategic decision-making in the smart fitting room market is increasingly tied to achieving sustainability goals and improving operational efficiency through technology. Key to this is reducing e-commerce return rates, which can be up to 80% lower for retailers that effectively implement virtual try-on solutions compared to the industry average, where return rates can reach 40% for online apparel.

This makes smart fitting room ROI analysis a critical exercise for CFOs. For instance, a fast-fashion retailer struggling with the high cost of returns and unsold inventory can leverage these platforms for better in-store customer experience analytics. The process involves creating high-fidelity digital twins of garments, a crucial step for Digital Product Passport readiness.

This phygital retail platform integration allows customers to visualize fit accurately, directly impacting fitting room conversion. By ensuring a better initial fit, brands not only enhance customer satisfaction but also make significant strides in circular economy logistics, reducing the carbon footprint associated with reverse logistics and aligning with global sustainability mandates.

This operational shift is fundamental for long-term profitability and brand reputation in a competitive market.

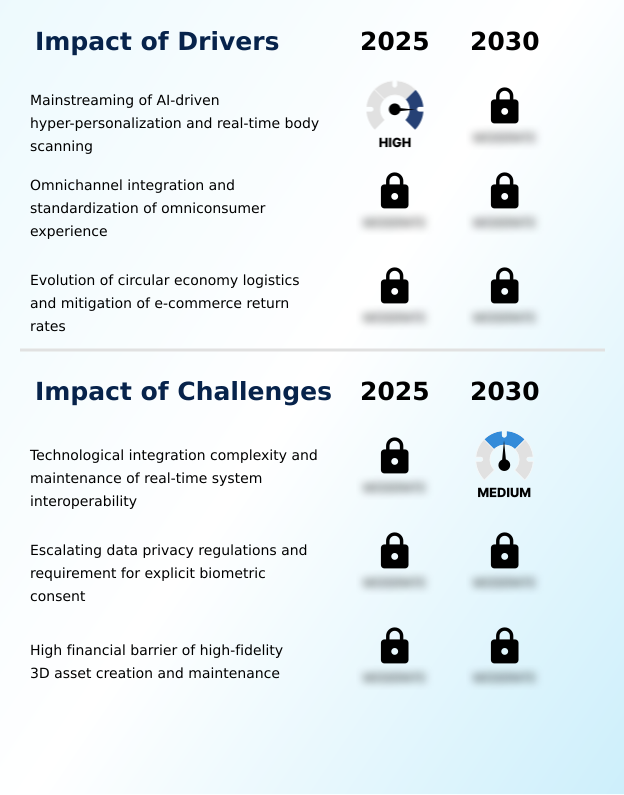
Primary Growth Driver: The mainstreaming of AI-driven hyper-personalization and real-time body scanning to enhance fit accuracy is a primary market driver.

A significant driver is the mainstreaming of AI-driven hyper-personalization, enabled by real-time 3D body scanning. In mature retail markets, consumers demand precise fit accuracy to eliminate size inconsistencies across brands.

Advanced computer vision algorithms and generative AI avatars can create a customer's digital twin in seconds, providing proactive styling suggestions and fit adjustments. This transforms the traditional mirror into an intelligent, data-rich hub.

By providing detailed fit analytics, such as heat maps on virtual avatars, retailers de-risk the purchase decision, which is particularly vital for high-end apparel where fit is paramount, and has been shown to reduce size-related returns by up to 80%.

Emerging Market Trend: A key market trend is the strategic adoption of circular commerce, supported by sustainability-driven fit analytics to address environmental concerns.

A primary trend influencing the market is the strategic shift toward circular commerce and sustainability. Retailers are deploying smart fitting room technology not just for customer convenience but as a tool to combat the high environmental and financial costs of product returns.

By leveraging high-precision 3D body scanning and virtual try-on engines, consumers can achieve a more accurate fit prediction, which directly correlates to a significant reduction in return rates. This evolution repositions the smart fitting room as a critical component of a brand’s Environmental, Social, and Governance (ESG) strategy, appealing to a growing segment of eco-conscious consumers who prioritize waste reduction.

Key Industry Challenge: The complexity of technological integration and the maintenance of real-time system interoperability pose a key challenge to industry growth.

A major challenge for the market is navigating the complex and escalating landscape of data privacy regulations, particularly concerning biometric data. Technologies like 3D body scanning and AI-driven facial analysis, used in augmented reality mirrors, generate highly sensitive personal data.

This falls under the stringent purview of laws such as Europe's General Data Protection Regulation (GDPR) and the California Consumer Privacy Act (CCPA). These regulations impose mandatory transparency and explicit consent requirements, which can disrupt the fluid customer experience.

For multinational brands, this creates a significant administrative burden to ensure localized data sovereignty and encryption protocols, restraining the seamless deployment of a standardized omnichannel integration.

Explore Full Market Dynamics Analysis Request Free Sample

Smart Fitting Room Market Segmentation

The smart fitting room industry research report provides comprehensive data including region-wise segment analysis, with forecasts and analysis for the period 2026-2030, as well as historical data from 2020-2024 for the following segments.

Market Segment by Technology
  • AR and VR rooms
  • RFID enabled rooms
  • Virtual mirrors
  • Others
Market Segment by Component
  • Hardware
  • Software
  • Services
Market Segment by End-user
  • Physical stores
  • Virtual and e-commerce stores
Market Segment by Geography
North America
US, Canada, Mexico
Europe
Germany, UK, France, Italy, Spain, The Netherlands
APAC
China, Japan, India, South Korea, Australia, Indonesia
Middle East and Africa
UAE, Saudi Arabia, South Africa, Israel, Turkey
South America
Brazil, Argentina, Colombia

Technology Segment Analysis

The ar and vr rooms segment is estimated to witness significant growth during the forecast period.

The AR and VR rooms segment, which accounts for approximately 33.8% of the market, is shifting toward immersive retail environments.

This segment utilizes high-fidelity 3D modeling and real-time motion tracking, where generative AI avatars can simulate how apparel fits various body types.

The expansion of 5G connectivity minimizes latency for the rendering of complex virtual garments, making the experience more intuitive for the end-user.

As fashion houses continue to invest in digital transformation, these technologies are evolving from novelty features into essential strategic assets for phygital retail synergy.

Retailers leverage computer vision algorithms and virtual try-on engines to enhance customer engagement and bolster conversion rates across both physical and digital storefronts, addressing the core issue of fit-related returns.

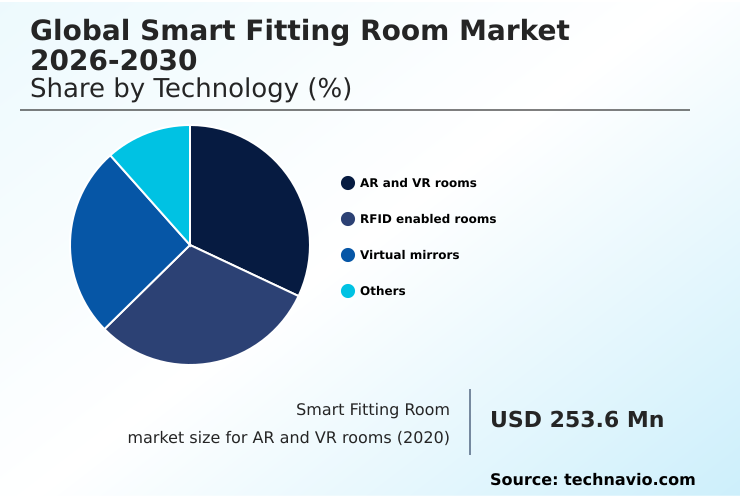
The AR and VR rooms segment was valued at USD 473.7 million in 2024 and showed a gradual increase during the forecast period.

Smart Fitting Room Market by Region: North America Leads with 40% Growth Share

North America is estimated to contribute 40% to the growth of the global market during the forecast period.

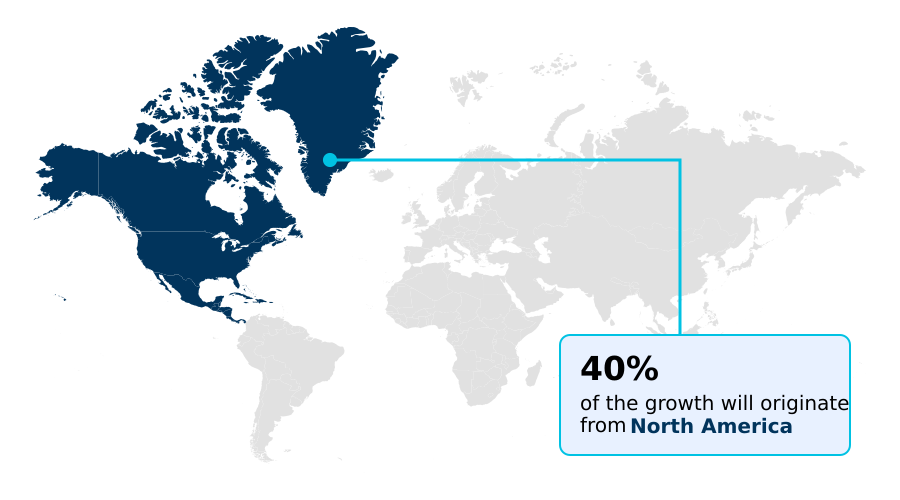
The geographic landscape of the market is led by North America, which represents the largest opportunity at nearly 40%. This maturity is driven by high retail technology adoption and a focus on reducing return-related costs.

In contrast, the APAC region is projected to exhibit the fastest growth, with a CAGR of 19.2%, fueled by a tech-savvy middle class and rapid urbanization in countries like China and India.

Europe, while growing steadily at 17.1%, places a strong emphasis on regulatory compliance, with the General Data Protection Regulation (GDPR) heavily influencing the design of systems that handle biometric data from 3D body scanning.

This requires vendors to prioritize data privacy in their virtual try-on engines and augmented reality mirrors, shaping product development for this key region.

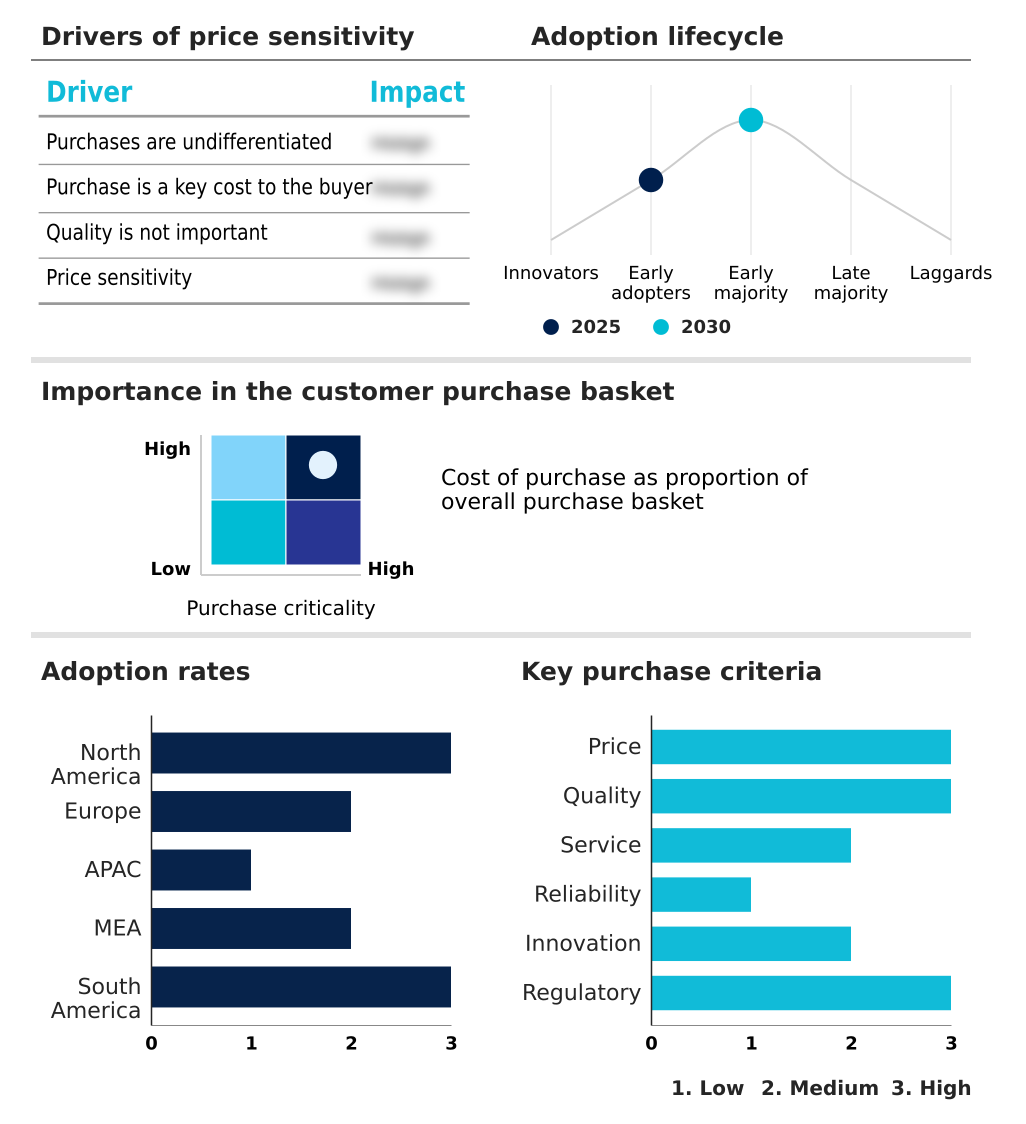
Customer Landscape Analysis for the Smart Fitting Room Market

The smart fitting room market forecasting report includes the adoption lifecycle of the market, covering from the innovator’s stage to the laggard’s stage. It focuses on adoption rates in different regions based on penetration. Furthermore, the smart fitting room market report also includes key purchase criteria and drivers of price sensitivity to help companies evaluate and develop their market growth analysis strategies.

Competitive Landscape of the Smart Fitting Room Market

Companies are implementing various strategies, such as strategic alliances, partnerships, mergers and acquisitions, geographical expansion, and product/service launches, to enhance their presence in the smart fitting room market industry.

3DLOOK Inc. - Offerings center on AI-powered virtual fitting platforms that generate personalized 3D avatars and precise size recommendations, aiming to reduce uncertainty in fashion e-commerce.

The industry research and growth report includes detailed analyses of the competitive landscape of the market and information about key companies, including:

  • 3DLOOK Inc.
  • Autumn Rock Ltd.
  • Cisco Systems Inc.
  • Else Corp.
  • Fit match
  • Fitle.
  • FXGear Inc.
  • Johnson Controls International
  • K3 Business Technology Group.
  • Magic Mirror
  • MIRRORSIZE US INC.
  • mysizeid
  • Panasonic Holdings Corp.
  • Raydiant
  • Samsung Electronics Co. Ltd.
  • SIZEBAY
  • Streamoid Technologies Inc.
  • Style.me
  • Syte
  • Virtusize Co.Ltd.

Qualitative and quantitative analysis of companies has been conducted to help clients understand the wider business environment as well as the strengths and weaknesses of key industry players. Data is qualitatively analyzed to categorize companies as pure play, category-focused, industry-focused, and diversified; it is quantitatively analyzed to categorize companies as dominant, leading, strong, tentative, and weak.

Recent Developments in the Smart Fitting Room Market

  • In May 2025, Amazon Style expanded its physical retail presence by introducing biometric scanners within fitting rooms across its California locations to provide hyper-personalized size recommendations.
  • In February 2025, the Inditex Group announced a comprehensive partnership with a leading European technology firm to install radio frequency identification enabled mirrors in all Zara flagship locations in Paris to streamline inventory tracking.
  • In July 2025, the Chilean retail giant Falabella implemented a network of interactive virtual try-on kiosks across major shopping centers in Santiago to bridge the gap between digital discovery and physical purchase.
  • In September 2025, Fast Retailing, the parent company of Uniqlo, launched a flagship store in Tokyo that featured a fully contactless fitting room system utilizing gesture control and light detection and ranging sensors.

Research Analyst Overview: Smart Fitting Room Market

The smart fitting room market's trajectory is defined by the strategic imperative to mitigate the financial impact of apparel returns through technological intervention. Boardroom decisions are now focused on the total cost of ownership of deploying systems that integrate 3D body scanning and computer vision algorithms, weighed against the high costs of reverse logistics.

A primary focus is on the adoption of virtual try-on engines powered by generative AI avatars, which can simulate garment fit with high precision. This is not merely a customer experience enhancement; it is a core operational tool.

For example, compliance with emerging standards like the EU's Digital Product Passport requires brands to create accurate digital twins of their products, a process streamlined by virtual fitting technologies. With North America contributing 40% of the market's incremental growth, the adoption of augmented reality mirrors and RFID sensors has become a competitive necessity.

This technology stack enables a phygital retail synergy that transforms the fitting room from a cost center into a data-rich hub for personalization and conversion optimization.

Dive into Technavio’s robust research methodology, blending expert interviews, extensive data synthesis, and validated models for unparalleled Smart Fitting Room Market insights. See full methodology.

Request Free Sample

Market Scope
Page number 291
Base year 2025
Historic period 2020-2024
Forecast period 2026-2030
Growth momentum & CAGR Accelerate at a CAGR of 18.2%
Market growth 2026-2030 USD 2178.5 million
Market structure Fragmented
YoY growth 2025-2026(%) 17.0%
Key countries US, Canada, Mexico, Germany, UK, France, Italy, Spain, The Netherlands, China, Japan, India, South Korea, Australia, Indonesia, UAE, Saudi Arabia, South Africa, Israel, Turkey, Brazil, Argentina and Colombia
Competitive landscape Leading Companies, Market Positioning of Companies, Competitive Strategies, and Industry Risks

Smart Fitting Room Market: Key Questions Answered in This Report

  • What is the expected growth of the Smart Fitting Room Market between 2026 and 2030?

    • The Smart Fitting Room Market is expected to grow by USD 2.18 billion during 2026-2030, registering a CAGR of 18.2%. Year-over-year growth in 2026 is estimated at 17.0%%. This acceleration is shaped by mainstreaming of ai-driven hyper-personalization and real-time body scanning, which is intensifying demand across multiple end-use verticals covered in the report.

  • What segmentation does the market report cover?

    • The report is segmented by Technology (AR and VR rooms, RFID enabled rooms, Virtual mirrors, and Others), Component (Hardware, Software, and Services), End-user (Physical stores, and Virtual and e-commerce stores) and Geography (North America, Europe, APAC, Middle East and Africa, South America). Among these, the AR and VR rooms segment is estimated to witness significant growth during the forecast period, driven by rising adoption across key application areas. Each segment includes detailed qualitative and quantitative analysis, along with historical data from 2020-2024 and forecasts through 2030 with year-over-year growth rates.

  • Which regions are analyzed in the report?

    • The report covers North America, Europe, APAC, Middle East and Africa and South America. North America is estimated to contribute 40% to market growth during the forecast period. Country-level analysis includes US, Canada, Mexico, Germany, UK, France, Italy, Spain, The Netherlands, China, Japan, India, South Korea, Australia, Indonesia, UAE, Saudi Arabia, South Africa, Israel, Turkey, Brazil, Argentina and Colombia, with dedicated market size tables and year-over-year growth for each.

  • What are the key growth drivers and market challenges?

    • The primary driver is mainstreaming of ai-driven hyper-personalization and real-time body scanning, which is accelerating investment and industry demand. The main challenge is technological integration complexity and maintenance of real-time system interoperability, creating operational barriers for key market participants. The report quantifies the impact of each driver and challenge across 2026 and 2030 with comparative analysis.

  • Who are the major players in the Smart Fitting Room Market?

    • Key vendors include 3DLOOK Inc., Autumn Rock Ltd., Cisco Systems Inc., Else Corp., Fit match, Fitle., FXGear Inc., Johnson Controls International, K3 Business Technology Group., Magic Mirror, MIRRORSIZE US INC., mysizeid, Panasonic Holdings Corp., Raydiant, Samsung Electronics Co. Ltd., SIZEBAY, Streamoid Technologies Inc., Style.me, Syte and Virtusize Co.Ltd.. The report provides qualitative and quantitative analysis categorizing companies as dominant, leading, strong, tentative, and weak based on their market positioning. Company profiles include business segment analysis, SWOT assessment, key offerings, and recent strategic developments.

Smart Fitting Room Market Research Insights

Market dynamics are increasingly shaped by the push for seamless omnichannel integration. Retailers are deploying smart fitting room technology to create a cohesive customer journey, linking online wishlists with in-store try-ons. This is driven by a need to improve fitting room conversion and manage circular economy logistics more effectively.

The integration of conversational commerce ecosystems provides personalized styling advice, further enhancing the hyper-personalized shopping experience. However, this data-centric approach must navigate strict regulations like the California Consumer Privacy Act (CCPA), which governs the use of biometric data and requires transparent consent mechanisms. Balancing technological innovation with regulatory compliance is critical for successful market participation.

We can help! Our analysts can customize this smart fitting room market research report to meet your requirements.

Get in touch

1. Executive Summary

1.1 Market overview

Executive Summary - Chart on Market Overview
Executive Summary - Data Table on Market Overview
Executive Summary - Chart on Global Market Characteristics
Executive Summary - Chart on Market by Geography
Executive Summary - Chart on Market Segmentation by Technology
Executive Summary - Chart on Market Segmentation by Component
Executive Summary - Chart on Market Segmentation by End-user
Executive Summary - Chart on Incremental Growth
Executive Summary - Data Table on Incremental Growth
Executive Summary - Chart on Company Market Positioning

2. Technavio Analysis

2.1 Analysis of price sensitivity, lifecycle, customer purchase basket, adoption rates, and purchase criteria

2.2 Criticality of inputs and Factors of differentiation

Chart on Overview on criticality of inputs and factors of differentiation

2.3 Factors of disruption

Chart on Overview on factors of disruption

2.4 Impact of drivers and challenges

Chart on Impact of drivers and challenges in 2025 and 2030

3. Market Landscape

3.1 Market ecosystem

Chart on Parent Market
Data Table on - Parent Market

3.2 Market characteristics

Chart on Market characteristics analysis

3.3 Value chain analysis

Chart on Value chain analysis

4. Market Sizing

4.1 Market definition

Data Table on Offerings of companies included in the market definition

4.2 Market segment analysis

Market segments

4.3 Market size 2025

4.4 Market outlook: Forecast for 2025-2030

Chart on Global - Market size and forecast 2025-2030 ($ million)
Data Table on Global - Market size and forecast 2025-2030 ($ million)
Chart on Global Market: Year-over-year growth 2025-2030 (%)
Data Table on Global Market: Year-over-year growth 2025-2030 (%)

5. Historic Market Size

5.1 Global Smart Fitting Room Market 2020 - 2024

Historic Market Size - Data Table on Global Smart Fitting Room Market 2020 - 2024 ($ million)

5.2 Technology segment analysis 2020 - 2024

Historic Market Size - Technology Segment 2020 - 2024 ($ million)

5.3 Component segment analysis 2020 - 2024

Historic Market Size - Component Segment 2020 - 2024 ($ million)

5.4 End-user segment analysis 2020 - 2024

Historic Market Size - End-user Segment 2020 - 2024 ($ million)

5.5 Geography segment analysis 2020 - 2024

Historic Market Size - Geography Segment 2020 - 2024 ($ million)

5.6 Country segment analysis 2020 - 2024

Historic Market Size - Country Segment 2020 - 2024 ($ million)

6. Qualitative Analysis

6.1 The AI impact on Global Smart Fitting Room Market

7. Five Forces Analysis

7.1 Five forces summary

Five forces analysis - Comparison between 2025 and 2030

7.2 Bargaining power of buyers

Bargaining power of buyers - Impact of key factors 2025 and 2030

7.3 Bargaining power of suppliers

Bargaining power of suppliers - Impact of key factors in 2025 and 2030

7.4 Threat of new entrants

Threat of new entrants - Impact of key factors in 2025 and 2030

7.5 Threat of substitutes

Threat of substitutes - Impact of key factors in 2025 and 2030

7.6 Threat of rivalry

Threat of rivalry - Impact of key factors in 2025 and 2030

7.7 Market condition

Chart on Market condition - Five forces 2025 and 2030

8. Market Segmentation by Technology

8.1 Market segments

Chart on Technology - Market share 2025-2030 (%)
Data Table on Technology - Market share 2025-2030 (%)

8.2 Comparison by Technology

Chart on Comparison by Technology
Data Table on Comparison by Technology

8.3 AR and VR rooms - Market size and forecast 2025-2030

Chart on AR and VR rooms - Market size and forecast 2025-2030 ($ million)
Data Table on AR and VR rooms - Market size and forecast 2025-2030 ($ million)
Chart on AR and VR rooms - Year-over-year growth 2025-2030 (%)
Data Table on AR and VR rooms - Year-over-year growth 2025-2030 (%)

8.4 RFID enabled rooms - Market size and forecast 2025-2030

Chart on RFID enabled rooms - Market size and forecast 2025-2030 ($ million)
Data Table on RFID enabled rooms - Market size and forecast 2025-2030 ($ million)
Chart on RFID enabled rooms - Year-over-year growth 2025-2030 (%)
Data Table on RFID enabled rooms - Year-over-year growth 2025-2030 (%)

8.5 Virtual mirrors - Market size and forecast 2025-2030

Chart on Virtual mirrors - Market size and forecast 2025-2030 ($ million)
Data Table on Virtual mirrors - Market size and forecast 2025-2030 ($ million)
Chart on Virtual mirrors - Year-over-year growth 2025-2030 (%)
Data Table on Virtual mirrors - Year-over-year growth 2025-2030 (%)

8.6 Others - Market size and forecast 2025-2030

Chart on Others - Market size and forecast 2025-2030 ($ million)
Data Table on Others - Market size and forecast 2025-2030 ($ million)
Chart on Others - Year-over-year growth 2025-2030 (%)
Data Table on Others - Year-over-year growth 2025-2030 (%)

8.7 Market opportunity by Technology

Market opportunity by Technology ($ million)
Data Table on Market opportunity by Technology ($ million)

9. Market Segmentation by Component

9.1 Market segments

Chart on Component - Market share 2025-2030 (%)
Data Table on Component - Market share 2025-2030 (%)

9.2 Comparison by Component

Chart on Comparison by Component
Data Table on Comparison by Component

9.3 Hardware - Market size and forecast 2025-2030

Chart on Hardware - Market size and forecast 2025-2030 ($ million)
Data Table on Hardware - Market size and forecast 2025-2030 ($ million)
Chart on Hardware - Year-over-year growth 2025-2030 (%)
Data Table on Hardware - Year-over-year growth 2025-2030 (%)

9.4 Software - Market size and forecast 2025-2030

Chart on Software - Market size and forecast 2025-2030 ($ million)
Data Table on Software - Market size and forecast 2025-2030 ($ million)
Chart on Software - Year-over-year growth 2025-2030 (%)
Data Table on Software - Year-over-year growth 2025-2030 (%)

9.5 Services - Market size and forecast 2025-2030

Chart on Services - Market size and forecast 2025-2030 ($ million)
Data Table on Services - Market size and forecast 2025-2030 ($ million)
Chart on Services - Year-over-year growth 2025-2030 (%)
Data Table on Services - Year-over-year growth 2025-2030 (%)

9.6 Market opportunity by Component

Market opportunity by Component ($ million)
Data Table on Market opportunity by Component ($ million)

10. Market Segmentation by End-user

10.1 Market segments

Chart on End-user - Market share 2025-2030 (%)
Data Table on End-user - Market share 2025-2030 (%)

10.2 Comparison by End-user

Chart on Comparison by End-user
Data Table on Comparison by End-user

10.3 Physical stores - Market size and forecast 2025-2030

Chart on Physical stores - Market size and forecast 2025-2030 ($ million)
Data Table on Physical stores - Market size and forecast 2025-2030 ($ million)
Chart on Physical stores - Year-over-year growth 2025-2030 (%)
Data Table on Physical stores - Year-over-year growth 2025-2030 (%)

10.4 Virtual and e-commerce stores - Market size and forecast 2025-2030

Chart on Virtual and e-commerce stores - Market size and forecast 2025-2030 ($ million)
Data Table on Virtual and e-commerce stores - Market size and forecast 2025-2030 ($ million)
Chart on Virtual and e-commerce stores - Year-over-year growth 2025-2030 (%)
Data Table on Virtual and e-commerce stores - Year-over-year growth 2025-2030 (%)

10.5 Market opportunity by End-user

Market opportunity by End-user ($ million)
Data Table on Market opportunity by End-user ($ million)

11. Customer Landscape

11.1 Customer landscape overview

Analysis of price sensitivity, lifecycle, customer purchase basket, adoption rates, and purchase criteria

12. Geographic Landscape

12.1 Geographic segmentation

Chart on Market share by geography 2025-2030 (%)
Data Table on Market share by geography 2025-2030 (%)

12.2 Geographic comparison

Chart on Geographic comparison
Data Table on Geographic comparison

12.3 North America - Market size and forecast 2025-2030

Chart on North America - Market size and forecast 2025-2030 ($ million)
Data Table on North America - Market size and forecast 2025-2030 ($ million)
Chart on North America - Year-over-year growth 2025-2030 (%)
Data Table on North America - Year-over-year growth 2025-2030 (%)
Chart on Regional Comparison - North America
Data Table on Regional Comparison - North America

12.3.1 US - Market size and forecast 2025-2030

Chart on US - Market size and forecast 2025-2030 ($ million)
Data Table on US - Market size and forecast 2025-2030 ($ million)
Chart on US - Year-over-year growth 2025-2030 (%)
Data Table on US - Year-over-year growth 2025-2030 (%)

12.3.2 Canada - Market size and forecast 2025-2030

Chart on Canada - Market size and forecast 2025-2030 ($ million)
Data Table on Canada - Market size and forecast 2025-2030 ($ million)
Chart on Canada - Year-over-year growth 2025-2030 (%)
Data Table on Canada - Year-over-year growth 2025-2030 (%)

12.3.3 Mexico - Market size and forecast 2025-2030

Chart on Mexico - Market size and forecast 2025-2030 ($ million)
Data Table on Mexico - Market size and forecast 2025-2030 ($ million)
Chart on Mexico - Year-over-year growth 2025-2030 (%)
Data Table on Mexico - Year-over-year growth 2025-2030 (%)

12.4 Europe - Market size and forecast 2025-2030

Chart on Europe - Market size and forecast 2025-2030 ($ million)
Data Table on Europe - Market size and forecast 2025-2030 ($ million)
Chart on Europe - Year-over-year growth 2025-2030 (%)
Data Table on Europe - Year-over-year growth 2025-2030 (%)
Chart on Regional Comparison - Europe
Data Table on Regional Comparison - Europe

12.4.1 Germany - Market size and forecast 2025-2030

Chart on Germany - Market size and forecast 2025-2030 ($ million)
Data Table on Germany - Market size and forecast 2025-2030 ($ million)
Chart on Germany - Year-over-year growth 2025-2030 (%)
Data Table on Germany - Year-over-year growth 2025-2030 (%)

12.4.2 UK - Market size and forecast 2025-2030

Chart on UK - Market size and forecast 2025-2030 ($ million)
Data Table on UK - Market size and forecast 2025-2030 ($ million)
Chart on UK - Year-over-year growth 2025-2030 (%)
Data Table on UK - Year-over-year growth 2025-2030 (%)

12.4.3 France - Market size and forecast 2025-2030

Chart on France - Market size and forecast 2025-2030 ($ million)
Data Table on France - Market size and forecast 2025-2030 ($ million)
Chart on France - Year-over-year growth 2025-2030 (%)
Data Table on France - Year-over-year growth 2025-2030 (%)

12.4.4 Italy - Market size and forecast 2025-2030

Chart on Italy - Market size and forecast 2025-2030 ($ million)
Data Table on Italy - Market size and forecast 2025-2030 ($ million)
Chart on Italy - Year-over-year growth 2025-2030 (%)
Data Table on Italy - Year-over-year growth 2025-2030 (%)

12.4.5 Spain - Market size and forecast 2025-2030

Chart on Spain - Market size and forecast 2025-2030 ($ million)
Data Table on Spain - Market size and forecast 2025-2030 ($ million)
Chart on Spain - Year-over-year growth 2025-2030 (%)
Data Table on Spain - Year-over-year growth 2025-2030 (%)

12.4.6 The Netherlands - Market size and forecast 2025-2030

Chart on The Netherlands - Market size and forecast 2025-2030 ($ million)
Data Table on The Netherlands - Market size and forecast 2025-2030 ($ million)
Chart on The Netherlands - Year-over-year growth 2025-2030 (%)
Data Table on The Netherlands - Year-over-year growth 2025-2030 (%)

12.5 APAC - Market size and forecast 2025-2030

Chart on APAC - Market size and forecast 2025-2030 ($ million)
Data Table on APAC - Market size and forecast 2025-2030 ($ million)
Chart on APAC - Year-over-year growth 2025-2030 (%)
Data Table on APAC - Year-over-year growth 2025-2030 (%)
Chart on Regional Comparison - APAC
Data Table on Regional Comparison - APAC

12.5.1 China - Market size and forecast 2025-2030

Chart on China - Market size and forecast 2025-2030 ($ million)
Data Table on China - Market size and forecast 2025-2030 ($ million)
Chart on China - Year-over-year growth 2025-2030 (%)
Data Table on China - Year-over-year growth 2025-2030 (%)

12.5.2 Japan - Market size and forecast 2025-2030

Chart on Japan - Market size and forecast 2025-2030 ($ million)
Data Table on Japan - Market size and forecast 2025-2030 ($ million)
Chart on Japan - Year-over-year growth 2025-2030 (%)
Data Table on Japan - Year-over-year growth 2025-2030 (%)

12.5.3 India - Market size and forecast 2025-2030

Chart on India - Market size and forecast 2025-2030 ($ million)
Data Table on India - Market size and forecast 2025-2030 ($ million)
Chart on India - Year-over-year growth 2025-2030 (%)
Data Table on India - Year-over-year growth 2025-2030 (%)

12.5.4 South Korea - Market size and forecast 2025-2030

Chart on South Korea - Market size and forecast 2025-2030 ($ million)
Data Table on South Korea - Market size and forecast 2025-2030 ($ million)
Chart on South Korea - Year-over-year growth 2025-2030 (%)
Data Table on South Korea - Year-over-year growth 2025-2030 (%)

12.5.5 Australia - Market size and forecast 2025-2030

Chart on Australia - Market size and forecast 2025-2030 ($ million)
Data Table on Australia - Market size and forecast 2025-2030 ($ million)
Chart on Australia - Year-over-year growth 2025-2030 (%)
Data Table on Australia - Year-over-year growth 2025-2030 (%)

12.5.6 Indonesia - Market size and forecast 2025-2030

Chart on Indonesia - Market size and forecast 2025-2030 ($ million)
Data Table on Indonesia - Market size and forecast 2025-2030 ($ million)
Chart on Indonesia - Year-over-year growth 2025-2030 (%)
Data Table on Indonesia - Year-over-year growth 2025-2030 (%)

12.6 Middle East and Africa - Market size and forecast 2025-2030

Chart on Middle East and Africa - Market size and forecast 2025-2030 ($ million)
Data Table on Middle East and Africa - Market size and forecast 2025-2030 ($ million)
Chart on Middle East and Africa - Year-over-year growth 2025-2030 (%)
Data Table on Middle East and Africa - Year-over-year growth 2025-2030 (%)
Chart on Regional Comparison - Middle East and Africa
Data Table on Regional Comparison - Middle East and Africa

12.6.1 UAE - Market size and forecast 2025-2030

Chart on UAE - Market size and forecast 2025-2030 ($ million)
Data Table on UAE - Market size and forecast 2025-2030 ($ million)
Chart on UAE - Year-over-year growth 2025-2030 (%)
Data Table on UAE - Year-over-year growth 2025-2030 (%)

12.6.2 Saudi Arabia - Market size and forecast 2025-2030

Chart on Saudi Arabia - Market size and forecast 2025-2030 ($ million)
Data Table on Saudi Arabia - Market size and forecast 2025-2030 ($ million)
Chart on Saudi Arabia - Year-over-year growth 2025-2030 (%)
Data Table on Saudi Arabia - Year-over-year growth 2025-2030 (%)

12.6.3 South Africa - Market size and forecast 2025-2030

Chart on South Africa - Market size and forecast 2025-2030 ($ million)
Data Table on South Africa - Market size and forecast 2025-2030 ($ million)
Chart on South Africa - Year-over-year growth 2025-2030 (%)
Data Table on South Africa - Year-over-year growth 2025-2030 (%)

12.6.4 Israel - Market size and forecast 2025-2030

Chart on Israel - Market size and forecast 2025-2030 ($ million)
Data Table on Israel - Market size and forecast 2025-2030 ($ million)
Chart on Israel - Year-over-year growth 2025-2030 (%)
Data Table on Israel - Year-over-year growth 2025-2030 (%)

12.6.5 Turkey - Market size and forecast 2025-2030

Chart on Turkey - Market size and forecast 2025-2030 ($ million)
Data Table on Turkey - Market size and forecast 2025-2030 ($ million)
Chart on Turkey - Year-over-year growth 2025-2030 (%)
Data Table on Turkey - Year-over-year growth 2025-2030 (%)

12.7 South America - Market size and forecast 2025-2030

Chart on South America - Market size and forecast 2025-2030 ($ million)
Data Table on South America - Market size and forecast 2025-2030 ($ million)
Chart on South America - Year-over-year growth 2025-2030 (%)
Data Table on South America - Year-over-year growth 2025-2030 (%)
Chart on Regional Comparison - South America
Data Table on Regional Comparison - South America

12.7.1 Brazil - Market size and forecast 2025-2030

Chart on Brazil - Market size and forecast 2025-2030 ($ million)
Data Table on Brazil - Market size and forecast 2025-2030 ($ million)
Chart on Brazil - Year-over-year growth 2025-2030 (%)
Data Table on Brazil - Year-over-year growth 2025-2030 (%)

12.7.2 Argentina - Market size and forecast 2025-2030

Chart on Argentina - Market size and forecast 2025-2030 ($ million)
Data Table on Argentina - Market size and forecast 2025-2030 ($ million)
Chart on Argentina - Year-over-year growth 2025-2030 (%)
Data Table on Argentina - Year-over-year growth 2025-2030 (%)

12.7.3 Colombia - Market size and forecast 2025-2030

Chart on Colombia - Market size and forecast 2025-2030 ($ million)
Data Table on Colombia - Market size and forecast 2025-2030 ($ million)
Chart on Colombia - Year-over-year growth 2025-2030 (%)
Data Table on Colombia - Year-over-year growth 2025-2030 (%)

12.8 Market opportunity by geography

Market opportunity by geography ($ million)
Data Tables on Market opportunity by geography ($ million)

13. Drivers, Challenges, and Opportunity

13.1 Market drivers

Mainstreaming of AI-driven hyper-personalization and real-time body scanning
Omnichannel integration and standardization of omniconsumer experience
Evolution of circular economy logistics and mitigation of e-commerce return rates

13.2 Market challenges

Technological integration complexity and maintenance of real-time system interoperability
Escalating data privacy regulations and requirement for explicit biometric consent
High financial barrier of high-fidelity 3D asset creation and maintenance

13.3 Impact of drivers and challenges

Impact of drivers and challenges in 2025 and 2030

13.4 Market opportunities

Strategic adoption of circular commerce and sustainability-driven fit analytics
Integration of agentic AI stylists and conversational commerce ecosystems
Expansion of phygital retail synergy through RFID and mobile point-of-sale integration

14. Competitive Landscape

14.1 Overview

14.2

Overview on criticality of inputs and factors of differentiation

14.3 Landscape disruption

Overview on factors of disruption

14.4 Industry risks

Impact of key risks on business

15. Competitive Analysis

15.1 Companies profiled

Companies covered

15.2 Company ranking index

15.3 Market positioning of companies

Matrix on companies position and classification

15.4 3DLOOK Inc.

3DLOOK Inc. - Overview
3DLOOK Inc. - Product / Service
3DLOOK Inc. - Key offerings
SWOT

15.5 Autumn Rock Ltd.

Autumn Rock Ltd. - Overview
Autumn Rock Ltd. - Product / Service
Autumn Rock Ltd. - Key offerings
SWOT

15.6 Cisco Systems Inc.

Cisco Systems Inc. - Overview
Cisco Systems Inc. - Business segments
Cisco Systems Inc. - Key news
Cisco Systems Inc. - Key offerings
Cisco Systems Inc. - Segment focus
SWOT

15.7 Else Corp.

Else Corp. - Overview
Else Corp. - Product / Service
Else Corp. - Key offerings
SWOT

15.8 Fit match

Fit match - Overview
Fit match - Product / Service
Fit match - Key offerings
SWOT

15.9 Fitle.

Fitle. - Overview
Fitle. - Product / Service
Fitle. - Key offerings
SWOT

15.10 FXGear Inc.

FXGear Inc. - Overview
FXGear Inc. - Product / Service
FXGear Inc. - Key offerings
SWOT

15.11 Johnson Controls International

Johnson Controls International - Overview
Johnson Controls International - Business segments
Johnson Controls International - Key news
Johnson Controls International - Key offerings
Johnson Controls International - Segment focus
SWOT

15.12 K3 Business Technology Group.

K3 Business Technology Group. - Overview
K3 Business Technology Group. - Product / Service
K3 Business Technology Group. - Key offerings
SWOT

15.13 Magic Mirror

Magic Mirror - Overview
Magic Mirror - Product / Service
Magic Mirror - Key offerings
SWOT

15.14 MIRRORSIZE US INC.

MIRRORSIZE US INC. - Overview
MIRRORSIZE US INC. - Product / Service
MIRRORSIZE US INC. - Key offerings
SWOT

15.15 mysizeid

mysizeid - Overview
mysizeid - Product / Service
mysizeid - Key offerings
SWOT

15.16 Panasonic Holdings Corp.

Panasonic Holdings Corp. - Overview
Panasonic Holdings Corp. - Business segments
Panasonic Holdings Corp. - Key news
Panasonic Holdings Corp. - Key offerings
Panasonic Holdings Corp. - Segment focus
SWOT

15.17 Raydiant

Raydiant - Overview
Raydiant - Product / Service
Raydiant - Key offerings
SWOT

15.18 Samsung Electronics Co. Ltd.

Samsung Electronics Co. Ltd. - Overview
Samsung Electronics Co. Ltd. - Business segments
Samsung Electronics Co. Ltd. - Key news
Samsung Electronics Co. Ltd. - Key offerings
Samsung Electronics Co. Ltd. - Segment focus
SWOT

16. Appendix

16.1 Scope of the report

Market definition
Objectives
Notes and caveats

16.2 Inclusions and exclusions checklist

Inclusions checklist
Exclusions checklist

16.3 Currency conversion rates for US$

16.4 Research methodology

16.5 Data procurement

Information sources

16.6 Data validation

16.7 Validation techniques employed for market sizing

16.8 Data synthesis

16.9 360 degree market analysis

16.10 List of abbreviations

Research Methodology

Technavio presents a detailed picture of the market by way of study, synthesis, and summation of data from multiple sources. The analysts have presented the various facets of the market with a particular focus on identifying the key industry influencers. The data thus presented is comprehensive, reliable, and the result of extensive research, both primary and secondary.

INFORMATION SOURCES

Primary sources

  • Manufacturers and suppliers
  • Channel partners
  • Industry experts
  • Strategic decision makers

Secondary sources

  • Industry journals and periodicals
  • Government data
  • Financial reports of key industry players
  • Historical data
  • Press releases

DATA ANALYSIS

Data Synthesis

  • Collation of data
  • Estimation of key figures
  • Analysis of derived insights

Data Validation

  • Triangulation with data models
  • Reference against proprietary databases
  • Corroboration with industry experts

REPORT WRITING

Qualitative

  • Market drivers
  • Market challenges
  • Market trends
  • Five forces analysis

Quantitative

  • Market size and forecast
  • Market segmentation
  • Geographical insights
  • Competitive landscape

Interested in this report?

Get your sample now to see our research methodology and insights!

Download Now

Frequently Asked Questions

Smart Fitting Room market growth will increase by USD 2178.5 million during 2026-2030.

The Smart Fitting Room market is expected to grow at a CAGR of 18.2% during 2026-2030.

Smart Fitting Room market is segmented by Technology (AR and VR rooms, RFID enabled rooms, Virtual mirrors, Others) Component (Hardware, Software, Services) End-user (Physical stores, Virtual and e-commerce stores)

3DLOOK Inc., Autumn Rock Ltd., Cisco Systems Inc., Else Corp., Fit match, Fitle., FXGear Inc., Johnson Controls International, K3 Business Technology Group., Magic Mirror, MIRRORSIZE US INC., mysizeid, Panasonic Holdings Corp., Raydiant, Samsung Electronics Co. Ltd., SIZEBAY, Streamoid Technologies Inc., Style.me, Syte, Virtusize Co.Ltd. are a few of the key vendors in the Smart Fitting Room market.

North America will register the highest growth rate of 40% among the other regions. Therefore, the Smart Fitting Room market in North America is expected to garner significant business opportunities for the vendors during the forecast period.

US, Canada, Mexico, Germany, UK, France, Italy, Spain, The Netherlands, China, Japan, India, South Korea, Australia, Indonesia, UAE, Saudi Arabia, South Africa, Israel, Turkey, Brazil, Argentina, Colombia

  • Mainstreaming of AI-driven hyper-personalization and real-time body scanning is the driving factor this market.

The Smart Fitting Room market vendors should focus on grabbing business opportunities from the Technology segment as it accounted for the largest market share in the base year.
RIA - Research AI Assistant
Ask RIA