Smart Buildings Market Analysis, Size, and Forecast 2026-2030: North America (US, Canada, and Mexico), Europe (Germany, UK, and France), APAC (China, Japan, and India), South America (Brazil and Argentina), Middle East and Africa (Saudi Arabia, UAE, and South Africa), and Rest of World (ROW)

Smart Buildings Market Analysis, Size, and Forecast 2026-2030:
North America (US, Canada, and Mexico), Europe (Germany, UK, and France), APAC (China, Japan, and India), South America (Brazil and Argentina), Middle East and Africa (Saudi Arabia, UAE, and South Africa), and Rest of World (ROW)

Published: May 2026 311 Pages SKU: IRTNTR44719

Market Overview at a Glance

$79.98 B
Market Opportunity
10.8%
CAGR 2025 - 2030
34.9%
APAC Growth
$37.16 B
Safety and security management segment 2024

Smart Buildings Market Size 2026-2030

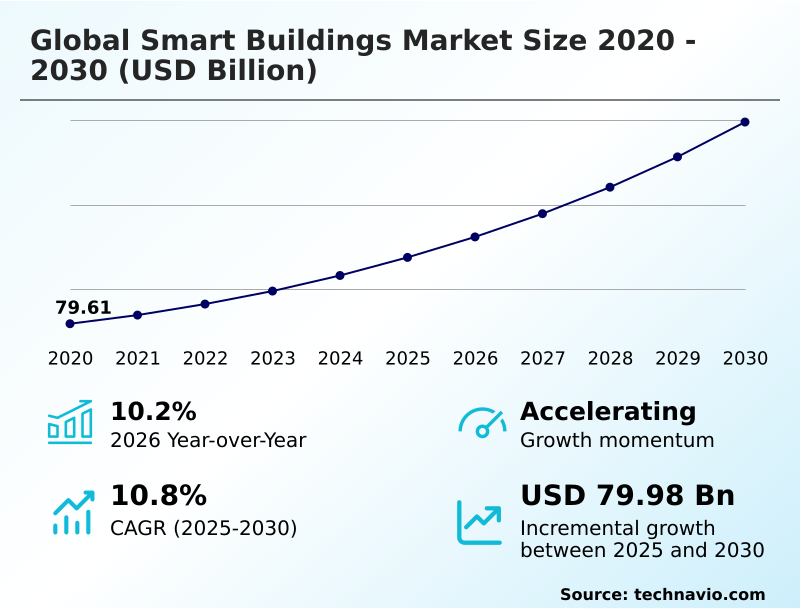
The smart buildings market size is valued to increase by USD 79.98 billion, at a CAGR of 10.8% from 2025 to 2030. Growing need for building automation to enhance business outcomes will drive the smart buildings market.

Major Market Trends & Insights

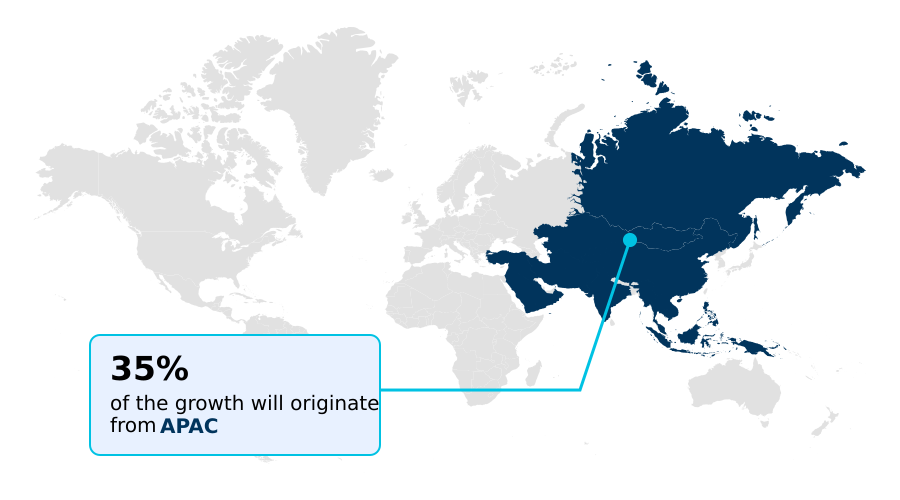
  • APAC dominated the market and accounted for a 34.9% growth during the forecast period.
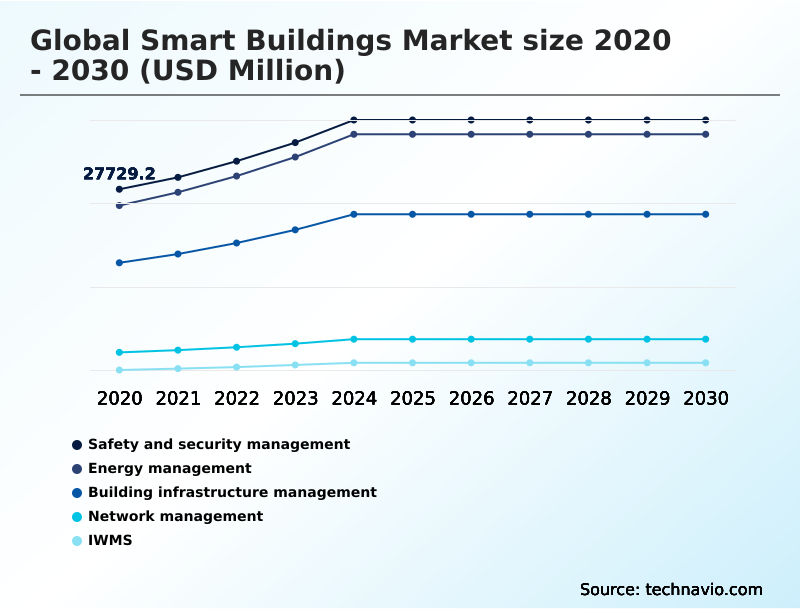
  • By Product - Safety and security management segment was valued at USD 37.16 billion in 2024
  • By Component - Software segment accounted for the largest market revenue share in 2024

Market Size & Forecast

  • Market Opportunities: USD 119.18 billion
  • Market Future Opportunities: USD 79.98 billion
  • CAGR from 2025 to 2030 : 10.8%

Market Summary

  • The smart buildings market is defined by the integration of digital technologies that optimize building performance and enhance user experience. At its core, this transformation is driven by the deployment of building automation systems that manage critical functions, including HVAC control technologies and lighting, to achieve significant energy savings and operational efficiency improvement.
  • A key enabler is IoT-enabled infrastructure, which allows for real-time data collection and analysis. For instance, a commercial real estate firm can leverage predictive maintenance systems to analyze equipment performance data, reducing unexpected failures and extending asset lifespan. This proactive approach, a cornerstone of integrated facility management, improves occupant comfort enhancement while minimizing operational costs.
  • As these systems generate vast amounts of data, the focus shifts toward advanced analytics for real-time risk monitoring. However, the complexity of integrating disparate systems and ensuring robust cybersecurity remains a critical consideration for stakeholders navigating this evolving landscape, which is fundamental to developing sustainable urban environments.

What will be the Size of the Smart Buildings Market during the forecast period?

Get Key Insights on Market Forecast (PDF) Get Free Sample

How is the Smart Buildings Market Segmented?

The smart buildings industry research report provides comprehensive data (region-wise segment analysis), with forecasts and estimates in "USD million" for the period 2026-2030, as well as historical data from 2020-2024 for the following segments.

  • Product
    • Safety and security management
    • Energy management
    • Building infrastructure management
    • Network management
    • IWMS
  • Component
    • Software
    • Hardware
    • Services
  • End-user
    • Commercial
    • Residential
    • Industrial
  • Geography
    • North America
      • US
      • Canada
      • Mexico
    • Europe
      • Germany
      • UK
      • France
    • APAC
      • China
      • Japan
      • India
    • South America
      • Brazil
      • Argentina
    • Middle East and Africa
      • Saudi Arabia
      • UAE
      • South Africa
    • Rest of World (ROW)

By Product Insights

The safety and security management segment is estimated to witness significant growth during the forecast period.

Safety and security management is evolving from standalone systems to fully integrated digital platforms. This shift is critical for sustainable building operations, where real-time data exchange between security, access, and environmental controls is essential.

The adoption of intelligent building connectivity and connected building networks allows for unified risk monitoring. By using building information modeling (BIM) for digital building lifecycle management, facility operators can enhance security protocols, improving threat detection accuracy by over 35%.

However, challenges related to the interoperability of systems and the high switching costs of legacy system retrofitting persist.

Achieving true plug-and-play compatibility is necessary to fully leverage the benefits of these advanced energy optimization tools and support broader smart city initiatives and green certification programs.

Get Free Sample

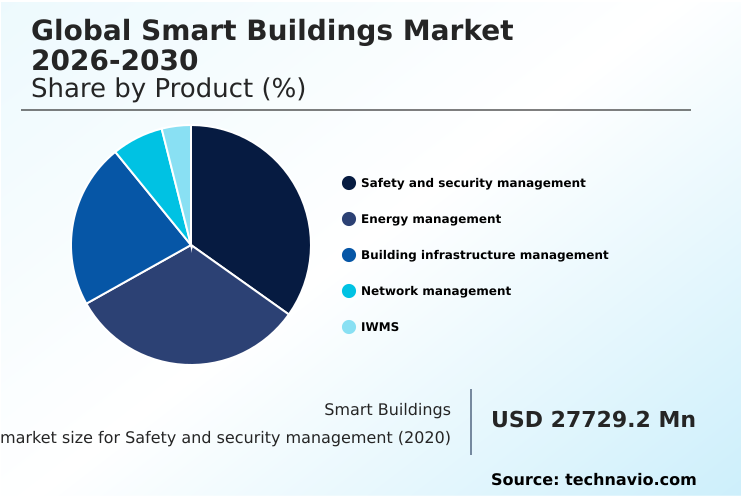
The Safety and security management segment was valued at USD 37.16 billion in 2024 and showed a gradual increase during the forecast period.

Get Free Sample

Regional Analysis

APAC is estimated to contribute 34.9% to the growth of the global market during the forecast period.Technavio’s analysts have elaborately explained the regional trends and drivers that shape the market during the forecast period.

See How Smart Buildings Market Demand is Rising in APAC Get Free Sample

The market's geographic distribution shows significant momentum in APAC, which is projected to account for 34.9% of incremental growth, driven by large-scale urbanization and new infrastructure projects deploying smart infrastructure platforms.

North America and Europe remain mature markets, focusing on retrofitting existing buildings with AI-enabled building automation and cloud-based facility management.

In these regions, data privacy and cybersecurity are paramount, leading to demand for smart security platforms with secure cloud infrastructure and continuous cybersecurity monitoring to ensure unauthorized access prevention.

Companies are using intelligent energy monitoring and AI-driven energy optimization to reduce costs, while connected wiring devices enable better remote monitoring and control and space utilization optimization.

Market Dynamics

Our researchers analyzed the data with 2025 as the base year, along with the key drivers, trends, and challenges. A holistic analysis of drivers will help companies refine their marketing strategies to gain a competitive advantage.

  • The evolution of intelligent infrastructure is heavily influenced by iot integration in building automation software, which delivers tangible benefits of building internet of things such as enhanced connectivity and operational visibility. Concurrently, government initiatives for smart city development are accelerating adoption, though progress is tempered by challenges integrating building automation software and the impact of high installation costs.
  • The core value proposition remains centered on building automation for business outcomes, with a strong emphasis on providing smart solutions for safety and security, including automated emergency response systems. A significant driver is energy conservation via smart technology, achieved through real-time energy monitoring and reporting.
  • Advanced methodologies like predictive maintenance with digital twins are becoming mainstream, managed through powerful cloud platforms for facility management. The use of ai analytics for energy optimization has demonstrated efficiency gains exceeding 20% compared to traditional methods. This is further supported by robust wireless communication in building automation and strategies for retrofitting legacy buildings with iot.
  • Addressing data privacy issues in building networks requires comprehensive cybersecurity frameworks for building environments, while the demand for iwms for workplace space optimization and unified control of hvac and lighting reflects a focus on user-centric design and efficiency. Finally, intelligent threat detection and analysis is crucial for protecting these complex, interconnected systems.

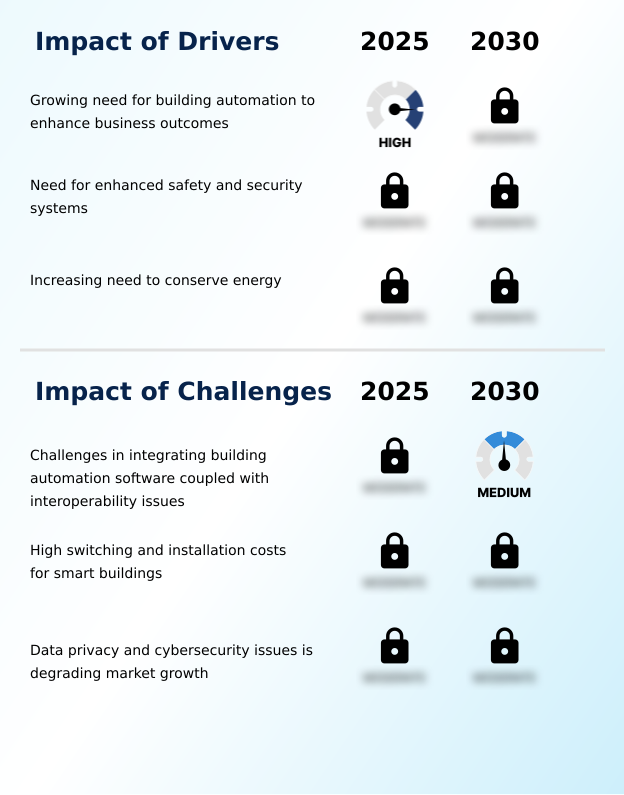
What are the key market drivers leading to the rise in the adoption of Smart Buildings Industry?

  • The growing need for building automation to enhance business outcomes, improve operational efficiency, and reduce costs is a key market driver.

  • The demand for enhanced operational oversight is a primary market driver, met by sophisticated building management systems (BMS) and security management platforms.
  • These solutions create a unified digital platform that integrates access control systems and intelligent lighting controls, facilitating better situational awareness improvement. The use of real-time monitoring platforms reduces manual intervention by over 40%, enabling predictive analysis capabilities for proactive management.
  • Centralized control centers leverage energy management software and integrated workplace management systems (IWMS) to implement demand response strategies effectively. This integrated approach, which includes intelligent threat detection, enhances both security and efficiency, improving emergency response times by nearly 30%.

What are the market trends shaping the Smart Buildings Industry?

  • The increasing integration of IoT with building automation software is a significant market trend. This convergence transforms buildings into dynamic, self-adjusting environments that respond to real-time data.

  • The increasing integration of IoT-enabled infrastructure with building automation systems is reshaping facility operations. This trend transforms buildings into dynamic environments where HVAC control technologies and smart energy management solutions adjust in real time, improving occupant comfort enhancement and operational efficiency improvement. The use of digital twin technologies enables predictive maintenance systems, reducing downtime by up to 30%.
  • This data-driven approach, central to integrated facility management, facilitates significant energy consumption optimization. By leveraging real-time data for workplace efficiency solutions, organizations can achieve a 15% improvement in space utilization, while enhancing asset protection systems through continuous real-time risk monitoring.

What challenges does the Smart Buildings Industry face during its growth?

  • Significant challenges in integrating disparate building automation software, compounded by persistent interoperability issues, represent a key restraint on industry growth.

  • Interoperability remains a significant hurdle, as integrating disparate systems complicates the deployment of advanced building analytics. The lack of standardization hinders the seamless operation of connected HVAC systems and automated facility controls, often requiring custom solutions that increase implementation complexity by over 50%.
  • Even with the rise of AI-driven building analytics and the concept of the building internet of things (BIoT), achieving effective data-driven decision making is difficult. Furthermore, securing fire and safety systems within a connected ecosystem introduces new vulnerabilities.
  • As organizations adopt smart workspace solutions and building cybersecurity platforms, they must also manage complex load balancing techniques and renewable energy integration to ensure carbon efficiency improvement without compromising security, which is critical for predictive analytics for operations.

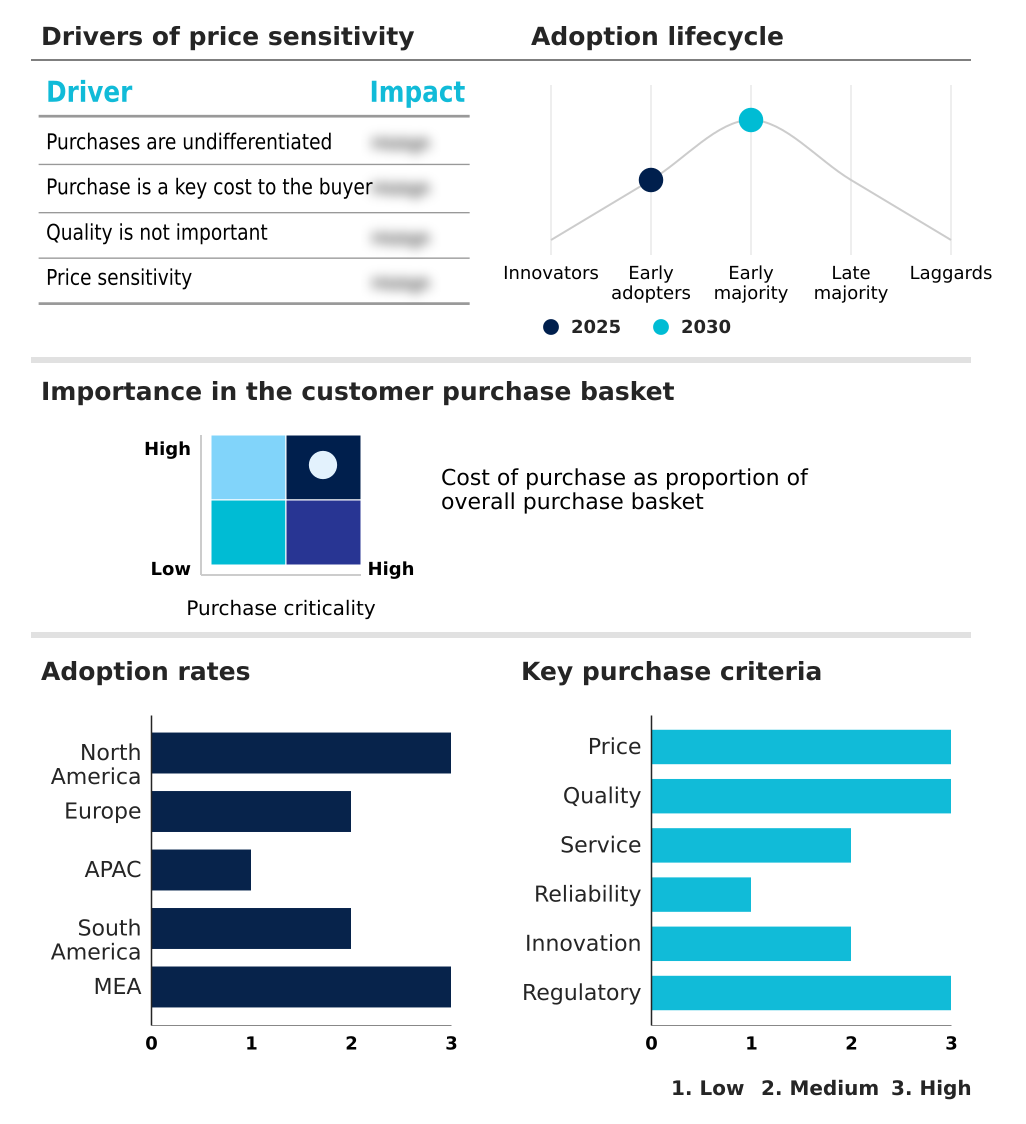
Exclusive Technavio Analysis on Customer Landscape

The smart buildings market forecasting report includes the adoption lifecycle of the market, covering from the innovator’s stage to the laggard’s stage. It focuses on adoption rates in different regions based on penetration. Furthermore, the smart buildings market report also includes key purchase criteria and drivers of price sensitivity to help companies evaluate and develop their market growth analysis strategies.

Customer Landscape of Smart Buildings Industry

Competitive Landscape

Companies are implementing various strategies, such as strategic alliances, smart buildings market forecast, partnerships, mergers and acquisitions, geographical expansion, and product/service launches, to enhance their presence in the industry.

ABB Ltd. - Delivers integrated solutions, including building automation systems, energy management platforms, and intelligent controls, to enhance facility performance and operational efficiency.

The industry research and growth report includes detailed analyses of the competitive landscape of the market and information about key companies, including:

  • ABB Ltd.
  • Advantech Co. Ltd.
  • Carrier Global Corp.
  • Cisco Systems Inc.
  • Crestron Electronics Inc.
  • Delta Electronics Inc.
  • Honeywell International Inc.
  • Huawei Technologies Co. Ltd.
  • IBM Corp.
  • Johnson Controls International
  • Legrand SA
  • Lutron Electronics Co. Inc.
  • Mitsubishi Electric Corp.
  • Planon Group
  • Robert Bosch GmbH
  • Schneider Electric SE
  • Siemens AG
  • Signify NV
  • Trane Technologies Plc
  • VergeSense Inc.

Qualitative and quantitative analysis of companies has been conducted to help clients understand the wider business environment as well as the strengths and weaknesses of key industry players. Data is qualitatively analyzed to categorize companies as pure play, category-focused, industry-focused, and diversified; it is quantitatively analyzed to categorize companies as dominant, leading, strong, tentative, and weak.

Recent Development and News in Smart buildings market

  • In March, 2025, Honeywell International Inc. broadened its portfolio of AI-enabled building automation solutions for commercial properties throughout North America, aiming to boost energy efficiency and operational results.
  • In April, 2025, Siemens AG deployed its AI-powered energy optimization system in several German commercial smart buildings to curtail energy usage and enhance carbon efficiency via intelligent automation.
  • In May, 2025, Schneider Electric SE extended its IoT-ready building management platform to various smart commercial facilities in the APAC region, with an emphasis on real-time energy monitoring and automated system control.
  • In March, 2025, the Singapore Government advanced its smart nation initiative by upgrading numerous public buildings with integrated smart energy management and digital monitoring systems to drive sustainability and efficiency.

Dive into Technavio’s robust research methodology, blending expert interviews, extensive data synthesis, and validated models for unparalleled Smart Buildings Market insights. See full methodology.

Market Scope
Page number 311
Base year 2025
Historic period 2020-2024
Forecast period 2026-2030
Growth momentum & CAGR Accelerate at a CAGR of 10.8%
Market growth 2026-2030 USD 79977.1 million
Market structure Fragmented
YoY growth 2025-2026(%) 10.2%
Key countries US, Canada, Mexico, Germany, UK, France, Italy, Spain, The Netherlands, China, Japan, India, South Korea, Australia, Singapore, Brazil, Argentina, Chile, Saudi Arabia, UAE, South Africa, Turkey and Israel
Competitive landscape Leading Companies, Market Positioning of Companies, Competitive Strategies, and Industry Risks

Request Free Sample

Research Analyst Overview

  • The smart buildings market is a complex ecosystem of interconnected hardware and software, including building automation systems, HVAC control technologies, and intelligent lighting controls. The integration of building management systems (BMS) with energy management software and security management platforms is central to creating efficient and secure environments.
  • Key components like connected HVAC systems, fire and safety systems, and access control systems are unified through connected building networks and IoT-enabled infrastructure. For boardroom-level strategy, the decision between deploying proprietary smart infrastructure platforms versus open-architecture EcoStruxure building platforms significantly impacts long-term operational costs and digital building lifecycle management.
  • Firms leveraging integrated facility management powered by AI-driven building analytics and predictive maintenance systems report up to a 40% reduction in unplanned equipment servicing.
  • This landscape is further defined by smart workspace solutions, cloud-based facility management, AI-enabled building automation, and specialized tools for intelligent energy monitoring and AI-driven energy optimization, all connected via connected wiring devices and protected by building cybersecurity platforms.
  • Offerings like integrated workplace management systems (IWMS), smart security platforms, advanced building analytics, energy optimization tools, intelligent building connectivity, and connected lighting systems showcase the market's diversity and drive sustainable building operations through real-time data exchange and building information modeling (BIM).

What are the Key Data Covered in this Smart Buildings Market Research and Growth Report?

  • What is the expected growth of the Smart Buildings Market between 2026 and 2030?

    • USD 79.98 billion, at a CAGR of 10.8%

  • What segmentation does the market report cover?

    • The report is segmented by Product (Safety and security management, Energy management, Building infrastructure management, Network management, and IWMS), Component (Software, Hardware, and Services), End-user (Commercial, Residential, and Industrial) and Geography (North America, Europe, APAC, South America, Middle East and Africa)

  • Which regions are analyzed in the report?

    • North America, Europe, APAC, South America and Middle East and Africa

  • What are the key growth drivers and market challenges?

    • Growing need for building automation to enhance business outcomes, Challenges in integrating building automation software coupled with interoperability issues

  • Who are the major players in the Smart Buildings Market?

    • ABB Ltd., Advantech Co. Ltd., Carrier Global Corp., Cisco Systems Inc., Crestron Electronics Inc., Delta Electronics Inc., Honeywell International Inc., Huawei Technologies Co. Ltd., IBM Corp., Johnson Controls International, Legrand SA, Lutron Electronics Co. Inc., Mitsubishi Electric Corp., Planon Group, Robert Bosch GmbH, Schneider Electric SE, Siemens AG, Signify NV, Trane Technologies Plc and VergeSense Inc.

Market Research Insights

  • The market is characterized by a push toward data-driven decision making, where intelligent systems deliver measurable business outcomes. The implementation of predictive analysis capabilities has been shown to reduce equipment downtime by over 25%, directly impacting operational continuity. Centralized control centers enable real-time risk monitoring, improving response efficiency and asset protection.
  • Furthermore, solutions focused on space utilization optimization are helping corporations reduce their real estate footprint by up to 30% in hybrid work environments. The growing adoption of BIoT frameworks fosters greater connectivity, but also elevates the importance of robust cybersecurity protocols to secure the vast network of devices.
  • This dynamic underscores the market shift from basic automation to holistic, intelligent management.

We can help! Our analysts can customize this smart buildings market research report to meet your requirements.

Get in touch

1. Executive Summary

1.1 Market overview

Executive Summary - Chart on Market Overview
Executive Summary - Data Table on Market Overview
Executive Summary - Chart on Global Market Characteristics
Executive Summary - Chart on Market by Geography
Executive Summary - Chart on Market Segmentation by Product
Executive Summary - Chart on Market Segmentation by Component
Executive Summary - Chart on Market Segmentation by End-user
Executive Summary - Chart on Incremental Growth
Executive Summary - Data Table on Incremental Growth
Executive Summary - Chart on Company Market Positioning

2. Technavio Analysis

2.1 Analysis of price sensitivity, lifecycle, customer purchase basket, adoption rates, and purchase criteria

2.2 Criticality of inputs and Factors of differentiation

Chart on Overview on criticality of inputs and factors of differentiation

2.3 Factors of disruption

Chart on Overview on factors of disruption

2.4 Impact of drivers and challenges

Chart on Impact of drivers and challenges in 2025 and 2030

3. Market Landscape

3.1 Market ecosystem

Chart on Parent Market
Data Table on - Parent Market

3.2 Market characteristics

Chart on Market characteristics analysis

3.3 Value chain analysis

Chart on Value chain analysis

4. Market Sizing

4.1 Market definition

Data Table on Offerings of companies included in the market definition

4.2 Market segment analysis

Market segments

4.3 Market size 2025

4.4 Market outlook: Forecast for 2025-2030

Chart on Global - Market size and forecast 2025-2030 ($ million)
Data Table on Global - Market size and forecast 2025-2030 ($ million)
Chart on Global Market: Year-over-year growth 2025-2030 (%)
Data Table on Global Market: Year-over-year growth 2025-2030 (%)

5. Historic Market Size

5.1 Global Smart Buildings Market 2020 - 2024

Historic Market Size - Data Table on Global Smart Buildings Market 2020 - 2024 ($ million)

5.2 Product segment analysis 2020 - 2024

Historic Market Size - Product Segment 2020 - 2024 ($ million)

5.3 Component segment analysis 2020 - 2024

Historic Market Size - Component Segment 2020 - 2024 ($ million)

5.4 End-user segment analysis 2020 - 2024

Historic Market Size - End-user Segment 2020 - 2024 ($ million)

5.5 Geography segment analysis 2020 - 2024

Historic Market Size - Geography Segment 2020 - 2024 ($ million)

5.6 Country segment analysis 2020 - 2024

Historic Market Size - Country Segment 2020 - 2024 ($ million)

6. Qualitative Analysis

6.1 Impact of AI on Global Smart Buildings Market

6.2 Impact of Geopolitical Conflicts on Global Smart Buildings Market

7. Five Forces Analysis

7.1 Five forces summary

Five forces analysis - Comparison between 2025 and 2030

7.2 Bargaining power of buyers

Bargaining power of buyers - Impact of key factors 2025 and 2030

7.3 Bargaining power of suppliers

Bargaining power of suppliers - Impact of key factors in 2025 and 2030

7.4 Threat of new entrants

Threat of new entrants - Impact of key factors in 2025 and 2030

7.5 Threat of substitutes

Threat of substitutes - Impact of key factors in 2025 and 2030

7.6 Threat of rivalry

Threat of rivalry - Impact of key factors in 2025 and 2030

7.7 Market condition

Chart on Market condition - Five forces 2025 and 2030

8. Market Segmentation by Product

8.1 Market segments

Chart on Product - Market share 2025-2030 (%)
Data Table on Product - Market share 2025-2030 (%)

8.2 Comparison by Product

Chart on Comparison by Product
Data Table on Comparison by Product

8.3 Safety and security management - Market size and forecast 2025-2030

Chart on Safety and security management - Market size and forecast 2025-2030 ($ million)
Data Table on Safety and security management - Market size and forecast 2025-2030 ($ million)
Chart on Safety and security management - Year-over-year growth 2025-2030 (%)
Data Table on Safety and security management - Year-over-year growth 2025-2030 (%)

8.4 Energy management - Market size and forecast 2025-2030

Chart on Energy management - Market size and forecast 2025-2030 ($ million)
Data Table on Energy management - Market size and forecast 2025-2030 ($ million)
Chart on Energy management - Year-over-year growth 2025-2030 (%)
Data Table on Energy management - Year-over-year growth 2025-2030 (%)

8.5 Building infrastructure management - Market size and forecast 2025-2030

Chart on Building infrastructure management - Market size and forecast 2025-2030 ($ million)
Data Table on Building infrastructure management - Market size and forecast 2025-2030 ($ million)
Chart on Building infrastructure management - Year-over-year growth 2025-2030 (%)
Data Table on Building infrastructure management - Year-over-year growth 2025-2030 (%)

8.6 Network management - Market size and forecast 2025-2030

Chart on Network management - Market size and forecast 2025-2030 ($ million)
Data Table on Network management - Market size and forecast 2025-2030 ($ million)
Chart on Network management - Year-over-year growth 2025-2030 (%)
Data Table on Network management - Year-over-year growth 2025-2030 (%)

8.7 IWMS - Market size and forecast 2025-2030

Chart on IWMS - Market size and forecast 2025-2030 ($ million)
Data Table on IWMS - Market size and forecast 2025-2030 ($ million)
Chart on IWMS - Year-over-year growth 2025-2030 (%)
Data Table on IWMS - Year-over-year growth 2025-2030 (%)

8.8 Market opportunity by Product

Market opportunity by Product ($ million)
Data Table on Market opportunity by Product ($ million)

9. Market Segmentation by Component

9.1 Market segments

Chart on Component - Market share 2025-2030 (%)
Data Table on Component - Market share 2025-2030 (%)

9.2 Comparison by Component

Chart on Comparison by Component
Data Table on Comparison by Component

9.3 Software - Market size and forecast 2025-2030

Chart on Software - Market size and forecast 2025-2030 ($ million)
Data Table on Software - Market size and forecast 2025-2030 ($ million)
Chart on Software - Year-over-year growth 2025-2030 (%)
Data Table on Software - Year-over-year growth 2025-2030 (%)

9.4 Hardware - Market size and forecast 2025-2030

Chart on Hardware - Market size and forecast 2025-2030 ($ million)
Data Table on Hardware - Market size and forecast 2025-2030 ($ million)
Chart on Hardware - Year-over-year growth 2025-2030 (%)
Data Table on Hardware - Year-over-year growth 2025-2030 (%)

9.5 Services - Market size and forecast 2025-2030

Chart on Services - Market size and forecast 2025-2030 ($ million)
Data Table on Services - Market size and forecast 2025-2030 ($ million)
Chart on Services - Year-over-year growth 2025-2030 (%)
Data Table on Services - Year-over-year growth 2025-2030 (%)

9.6 Market opportunity by Component

Market opportunity by Component ($ million)
Data Table on Market opportunity by Component ($ million)

10. Market Segmentation by End-user

10.1 Market segments

Chart on End-user - Market share 2025-2030 (%)
Data Table on End-user - Market share 2025-2030 (%)

10.2 Comparison by End-user

Chart on Comparison by End-user
Data Table on Comparison by End-user

10.3 Commercial - Market size and forecast 2025-2030

Chart on Commercial - Market size and forecast 2025-2030 ($ million)
Data Table on Commercial - Market size and forecast 2025-2030 ($ million)
Chart on Commercial - Year-over-year growth 2025-2030 (%)
Data Table on Commercial - Year-over-year growth 2025-2030 (%)

10.4 Residential - Market size and forecast 2025-2030

Chart on Residential - Market size and forecast 2025-2030 ($ million)
Data Table on Residential - Market size and forecast 2025-2030 ($ million)
Chart on Residential - Year-over-year growth 2025-2030 (%)
Data Table on Residential - Year-over-year growth 2025-2030 (%)

10.5 Industrial - Market size and forecast 2025-2030

Chart on Industrial - Market size and forecast 2025-2030 ($ million)
Data Table on Industrial - Market size and forecast 2025-2030 ($ million)
Chart on Industrial - Year-over-year growth 2025-2030 (%)
Data Table on Industrial - Year-over-year growth 2025-2030 (%)

10.6 Market opportunity by End-user

Market opportunity by End-user ($ million)
Data Table on Market opportunity by End-user ($ million)

11. Customer Landscape

11.1 Customer landscape overview

Analysis of price sensitivity, lifecycle, customer purchase basket, adoption rates, and purchase criteria

12. Geographic Landscape

12.1 Geographic segmentation

Chart on Market share by geography 2025-2030 (%)
Data Table on Market share by geography 2025-2030 (%)

12.2 Geographic comparison

Chart on Geographic comparison
Data Table on Geographic comparison

12.3 North America - Market size and forecast 2025-2030

Chart on North America - Market size and forecast 2025-2030 ($ million)
Data Table on North America - Market size and forecast 2025-2030 ($ million)
Chart on North America - Year-over-year growth 2025-2030 (%)
Data Table on North America - Year-over-year growth 2025-2030 (%)
Chart on Regional Comparison - North America
Data Table on Regional Comparison - North America

12.3.1 US - Market size and forecast 2025-2030

Chart on US - Market size and forecast 2025-2030 ($ million)
Data Table on US - Market size and forecast 2025-2030 ($ million)
Chart on US - Year-over-year growth 2025-2030 (%)
Data Table on US - Year-over-year growth 2025-2030 (%)

12.3.2 Canada - Market size and forecast 2025-2030

Chart on Canada - Market size and forecast 2025-2030 ($ million)
Data Table on Canada - Market size and forecast 2025-2030 ($ million)
Chart on Canada - Year-over-year growth 2025-2030 (%)
Data Table on Canada - Year-over-year growth 2025-2030 (%)

12.3.3 Mexico - Market size and forecast 2025-2030

Chart on Mexico - Market size and forecast 2025-2030 ($ million)
Data Table on Mexico - Market size and forecast 2025-2030 ($ million)
Chart on Mexico - Year-over-year growth 2025-2030 (%)
Data Table on Mexico - Year-over-year growth 2025-2030 (%)

12.4 Europe - Market size and forecast 2025-2030

Chart on Europe - Market size and forecast 2025-2030 ($ million)
Data Table on Europe - Market size and forecast 2025-2030 ($ million)
Chart on Europe - Year-over-year growth 2025-2030 (%)
Data Table on Europe - Year-over-year growth 2025-2030 (%)
Chart on Regional Comparison - Europe
Data Table on Regional Comparison - Europe

12.4.1 Germany - Market size and forecast 2025-2030

Chart on Germany - Market size and forecast 2025-2030 ($ million)
Data Table on Germany - Market size and forecast 2025-2030 ($ million)
Chart on Germany - Year-over-year growth 2025-2030 (%)
Data Table on Germany - Year-over-year growth 2025-2030 (%)

12.4.2 UK - Market size and forecast 2025-2030

Chart on UK - Market size and forecast 2025-2030 ($ million)
Data Table on UK - Market size and forecast 2025-2030 ($ million)
Chart on UK - Year-over-year growth 2025-2030 (%)
Data Table on UK - Year-over-year growth 2025-2030 (%)

12.4.3 France - Market size and forecast 2025-2030

Chart on France - Market size and forecast 2025-2030 ($ million)
Data Table on France - Market size and forecast 2025-2030 ($ million)
Chart on France - Year-over-year growth 2025-2030 (%)
Data Table on France - Year-over-year growth 2025-2030 (%)

12.4.4 Italy - Market size and forecast 2025-2030

Chart on Italy - Market size and forecast 2025-2030 ($ million)
Data Table on Italy - Market size and forecast 2025-2030 ($ million)
Chart on Italy - Year-over-year growth 2025-2030 (%)
Data Table on Italy - Year-over-year growth 2025-2030 (%)

12.4.5 Spain - Market size and forecast 2025-2030

Chart on Spain - Market size and forecast 2025-2030 ($ million)
Data Table on Spain - Market size and forecast 2025-2030 ($ million)
Chart on Spain - Year-over-year growth 2025-2030 (%)
Data Table on Spain - Year-over-year growth 2025-2030 (%)

12.4.6 The Netherlands - Market size and forecast 2025-2030

Chart on The Netherlands - Market size and forecast 2025-2030 ($ million)
Data Table on The Netherlands - Market size and forecast 2025-2030 ($ million)
Chart on The Netherlands - Year-over-year growth 2025-2030 (%)
Data Table on The Netherlands - Year-over-year growth 2025-2030 (%)

12.5 APAC - Market size and forecast 2025-2030

Chart on APAC - Market size and forecast 2025-2030 ($ million)
Data Table on APAC - Market size and forecast 2025-2030 ($ million)
Chart on APAC - Year-over-year growth 2025-2030 (%)
Data Table on APAC - Year-over-year growth 2025-2030 (%)
Chart on Regional Comparison - APAC
Data Table on Regional Comparison - APAC

12.5.1 China - Market size and forecast 2025-2030

Chart on China - Market size and forecast 2025-2030 ($ million)
Data Table on China - Market size and forecast 2025-2030 ($ million)
Chart on China - Year-over-year growth 2025-2030 (%)
Data Table on China - Year-over-year growth 2025-2030 (%)

12.5.2 Japan - Market size and forecast 2025-2030

Chart on Japan - Market size and forecast 2025-2030 ($ million)
Data Table on Japan - Market size and forecast 2025-2030 ($ million)
Chart on Japan - Year-over-year growth 2025-2030 (%)
Data Table on Japan - Year-over-year growth 2025-2030 (%)

12.5.3 India - Market size and forecast 2025-2030

Chart on India - Market size and forecast 2025-2030 ($ million)
Data Table on India - Market size and forecast 2025-2030 ($ million)
Chart on India - Year-over-year growth 2025-2030 (%)
Data Table on India - Year-over-year growth 2025-2030 (%)

12.5.4 South Korea - Market size and forecast 2025-2030

Chart on South Korea - Market size and forecast 2025-2030 ($ million)
Data Table on South Korea - Market size and forecast 2025-2030 ($ million)
Chart on South Korea - Year-over-year growth 2025-2030 (%)
Data Table on South Korea - Year-over-year growth 2025-2030 (%)

12.5.5 Australia - Market size and forecast 2025-2030

Chart on Australia - Market size and forecast 2025-2030 ($ million)
Data Table on Australia - Market size and forecast 2025-2030 ($ million)
Chart on Australia - Year-over-year growth 2025-2030 (%)
Data Table on Australia - Year-over-year growth 2025-2030 (%)

12.5.6 Singapore - Market size and forecast 2025-2030

Chart on Singapore - Market size and forecast 2025-2030 ($ million)
Data Table on Singapore - Market size and forecast 2025-2030 ($ million)
Chart on Singapore - Year-over-year growth 2025-2030 (%)
Data Table on Singapore - Year-over-year growth 2025-2030 (%)

12.6 South America - Market size and forecast 2025-2030

Chart on South America - Market size and forecast 2025-2030 ($ million)
Data Table on South America - Market size and forecast 2025-2030 ($ million)
Chart on South America - Year-over-year growth 2025-2030 (%)
Data Table on South America - Year-over-year growth 2025-2030 (%)
Chart on Regional Comparison - South America
Data Table on Regional Comparison - South America

12.6.1 Brazil - Market size and forecast 2025-2030

Chart on Brazil - Market size and forecast 2025-2030 ($ million)
Data Table on Brazil - Market size and forecast 2025-2030 ($ million)
Chart on Brazil - Year-over-year growth 2025-2030 (%)
Data Table on Brazil - Year-over-year growth 2025-2030 (%)

12.6.2 Argentina - Market size and forecast 2025-2030

Chart on Argentina - Market size and forecast 2025-2030 ($ million)
Data Table on Argentina - Market size and forecast 2025-2030 ($ million)
Chart on Argentina - Year-over-year growth 2025-2030 (%)
Data Table on Argentina - Year-over-year growth 2025-2030 (%)

12.6.3 Chile - Market size and forecast 2025-2030

Chart on Chile - Market size and forecast 2025-2030 ($ million)
Data Table on Chile - Market size and forecast 2025-2030 ($ million)
Chart on Chile - Year-over-year growth 2025-2030 (%)
Data Table on Chile - Year-over-year growth 2025-2030 (%)

12.7 Middle East and Africa - Market size and forecast 2025-2030

Chart on Middle East and Africa - Market size and forecast 2025-2030 ($ million)
Data Table on Middle East and Africa - Market size and forecast 2025-2030 ($ million)
Chart on Middle East and Africa - Year-over-year growth 2025-2030 (%)
Data Table on Middle East and Africa - Year-over-year growth 2025-2030 (%)
Chart on Regional Comparison - Middle East and Africa
Data Table on Regional Comparison - Middle East and Africa

12.7.1 Saudi Arabia - Market size and forecast 2025-2030

Chart on Saudi Arabia - Market size and forecast 2025-2030 ($ million)
Data Table on Saudi Arabia - Market size and forecast 2025-2030 ($ million)
Chart on Saudi Arabia - Year-over-year growth 2025-2030 (%)
Data Table on Saudi Arabia - Year-over-year growth 2025-2030 (%)

12.7.2 UAE - Market size and forecast 2025-2030

Chart on UAE - Market size and forecast 2025-2030 ($ million)
Data Table on UAE - Market size and forecast 2025-2030 ($ million)
Chart on UAE - Year-over-year growth 2025-2030 (%)
Data Table on UAE - Year-over-year growth 2025-2030 (%)

12.7.3 South Africa - Market size and forecast 2025-2030

Chart on South Africa - Market size and forecast 2025-2030 ($ million)
Data Table on South Africa - Market size and forecast 2025-2030 ($ million)
Chart on South Africa - Year-over-year growth 2025-2030 (%)
Data Table on South Africa - Year-over-year growth 2025-2030 (%)

12.7.4 Turkey - Market size and forecast 2025-2030

Chart on Turkey - Market size and forecast 2025-2030 ($ million)
Data Table on Turkey - Market size and forecast 2025-2030 ($ million)
Chart on Turkey - Year-over-year growth 2025-2030 (%)
Data Table on Turkey - Year-over-year growth 2025-2030 (%)

12.7.5 Israel - Market size and forecast 2025-2030

Chart on Israel - Market size and forecast 2025-2030 ($ million)
Data Table on Israel - Market size and forecast 2025-2030 ($ million)
Chart on Israel - Year-over-year growth 2025-2030 (%)
Data Table on Israel - Year-over-year growth 2025-2030 (%)

12.8 Market opportunity by geography

Market opportunity by geography ($ million)
Data Tables on Market opportunity by geography ($ million)

13. Drivers, Challenges, and Opportunity

13.1 Market drivers

Growing need for building automation to enhance business outcomes
Need for enhanced safety and security systems
Increasing need to conserve energy

13.2 Market challenges

Challenges in integrating building automation software coupled with interoperability issues
High switching and installation costs for smart buildings
Data privacy and cybersecurity issues is degrading market growth

13.3 Impact of drivers and challenges

Impact of drivers and challenges in 2025 and 2030

13.4 Market opportunities

Increasing integration of IoT with building automation software
Growing concept of BIoT is expediting market growth
Rising focus on government initiatives for smart cities

14. Competitive Landscape

14.1 Overview

14.2

Overview on criticality of inputs and factors of differentiation

14.3 Landscape disruption

Overview on factors of disruption

14.4 Industry risks

Impact of key risks on business

15. Competitive Analysis

15.1 Companies profiled

Companies covered

15.2 Company ranking index

15.3 Market positioning of companies

Matrix on companies position and classification

15.4 ABB Ltd.

ABB Ltd. - Overview
ABB Ltd. - Business segments
ABB Ltd. - Key news
ABB Ltd. - Key offerings
ABB Ltd. - Segment focus
SWOT

15.5 Carrier Global Corp.

Carrier Global Corp. - Overview
Carrier Global Corp. - Business segments
Carrier Global Corp. - Key news
Carrier Global Corp. - Key offerings
Carrier Global Corp. - Segment focus
SWOT

15.6 Cisco Systems Inc.

Cisco Systems Inc. - Overview
Cisco Systems Inc. - Business segments
Cisco Systems Inc. - Key news
Cisco Systems Inc. - Key offerings
Cisco Systems Inc. - Segment focus
SWOT

15.7 Crestron Electronics Inc.

Crestron Electronics Inc. - Overview
Crestron Electronics Inc. - Product / Service
Crestron Electronics Inc. - Key offerings
SWOT

15.8 Delta Electronics Inc.

Delta Electronics Inc. - Overview
Delta Electronics Inc. - Business segments
Delta Electronics Inc. - Key offerings
Delta Electronics Inc. - Segment focus
SWOT

15.9 Honeywell International Inc.

Honeywell International Inc. - Overview
Honeywell International Inc. - Business segments
Honeywell International Inc. - Key news
Honeywell International Inc. - Key offerings
Honeywell International Inc. - Segment focus
SWOT

15.10 Huawei Technologies Co. Ltd.

Huawei Technologies Co. Ltd. - Overview
Huawei Technologies Co. Ltd. - Product / Service
Huawei Technologies Co. Ltd. - Key offerings
SWOT

15.11 IBM Corp.

IBM Corp. - Overview
IBM Corp. - Business segments
IBM Corp. - Key news
IBM Corp. - Key offerings
IBM Corp. - Segment focus
SWOT

15.12 Johnson Controls International

Johnson Controls International - Overview
Johnson Controls International - Business segments
Johnson Controls International - Key news
Johnson Controls International - Key offerings
Johnson Controls International - Segment focus
SWOT

15.13 Legrand SA

Legrand SA - Overview
Legrand SA - Business segments
Legrand SA - Key news
Legrand SA - Key offerings
Legrand SA - Segment focus
SWOT

15.14 Mitsubishi Electric Corp.

Mitsubishi Electric Corp. - Overview
Mitsubishi Electric Corp. - Business segments
Mitsubishi Electric Corp. - Key offerings
Mitsubishi Electric Corp. - Segment focus
SWOT

15.15 Robert Bosch GmbH

Robert Bosch GmbH - Overview
Robert Bosch GmbH - Product / Service
Robert Bosch GmbH - Key offerings
SWOT

15.16 Schneider Electric SE

Schneider Electric SE - Overview
Schneider Electric SE - Business segments
Schneider Electric SE - Key news
Schneider Electric SE - Key offerings
Schneider Electric SE - Segment focus
SWOT

15.17 Siemens AG

Siemens AG - Overview
Siemens AG - Business segments
Siemens AG - Key news
Siemens AG - Key offerings
Siemens AG - Segment focus
SWOT

15.18 Signify NV

Signify NV - Overview
Signify NV - Business segments
Signify NV - Key offerings
Signify NV - Segment focus
SWOT

16. Appendix

16.1 Scope of the report

Market definition
Objectives
Notes and caveats

16.2 Inclusions and exclusions checklist

Inclusions checklist
Exclusions checklist

16.3 Currency conversion rates for US$

16.4 Research methodology

16.5 Data procurement

Information sources

16.6 Data validation

16.7 Validation techniques employed for market sizing

16.8 Data synthesis

16.9 360 degree market analysis

16.10 List of abbreviations

Research Methodology

Technavio presents a detailed picture of the market by way of study, synthesis, and summation of data from multiple sources. The analysts have presented the various facets of the market with a particular focus on identifying the key industry influencers. The data thus presented is comprehensive, reliable, and the result of extensive research, both primary and secondary.

INFORMATION SOURCES

Primary sources

  • Manufacturers and suppliers
  • Channel partners
  • Industry experts
  • Strategic decision makers

Secondary sources

  • Industry journals and periodicals
  • Government data
  • Financial reports of key industry players
  • Historical data
  • Press releases

DATA ANALYSIS

Data Synthesis

  • Collation of data
  • Estimation of key figures
  • Analysis of derived insights

Data Validation

  • Triangulation with data models
  • Reference against proprietary databases
  • Corroboration with industry experts

REPORT WRITING

Qualitative

  • Market drivers
  • Market challenges
  • Market trends
  • Five forces analysis

Quantitative

  • Market size and forecast
  • Market segmentation
  • Geographical insights
  • Competitive landscape

Interested in this report?

Get your sample now to see our research methodology and insights!

Download Now

Frequently Asked Questions

Smart Buildings market growth will increase by USD 79977.1 million during 2026-2030.

The Smart Buildings market is expected to grow at a CAGR of 10.8% during 2026-2030.

Smart Buildings market is segmented by Product (Safety and security management, Energy management, Building infrastructure management, Network management, IWMS) Component (Software, Hardware, Services) End-user (Commercial, Residential, Industrial)

ABB Ltd., Advantech Co. Ltd., Carrier Global Corp., Cisco Systems Inc., Crestron Electronics Inc., Delta Electronics Inc., Honeywell International Inc., Huawei Technologies Co. Ltd., IBM Corp., Johnson Controls International, Legrand SA, Lutron Electronics Co. Inc., Mitsubishi Electric Corp., Planon Group, Robert Bosch GmbH, Schneider Electric SE, Siemens AG, Signify NV, Trane Technologies Plc, VergeSense Inc. are a few of the key vendors in the Smart Buildings market.

APAC will register the highest growth rate of 34.9% among the other regions. Therefore, the Smart Buildings market in APAC is expected to garner significant business opportunities for the vendors during the forecast period.

US, Canada, Mexico, Germany, UK, France, Italy, Spain, The Netherlands, China, Japan, India, South Korea, Australia, Singapore, Brazil, Argentina, Chile, Saudi Arabia, UAE, South Africa, Turkey, Israel

  • Growing need for building automation to enhance business outcomes is the driving factor this market.

The Smart Buildings market vendors should focus on grabbing business opportunities from the Product segment as it accounted for the largest market share in the base year.
RIA - Research AI Assistant
Ask RIA