Secondhand Furniture Market Analysis, Size, and Forecast 2026-2030: North America (US, Canada, and Mexico), Europe (Germany, UK, and France), APAC (China, Japan, and India), Middle East and Africa (Saudi Arabia, UAE, and South Africa), South America (Brazil, Argentina, and Colombia), and Rest of World (ROW)

Secondhand Furniture Market Analysis, Size, and Forecast 2026-2030:
North America (US, Canada, and Mexico), Europe (Germany, UK, and France), APAC (China, Japan, and India), Middle East and Africa (Saudi Arabia, UAE, and South Africa), South America (Brazil, Argentina, and Colombia), and Rest of World (ROW)

Published: May 2026 294 Pages SKU: IRTNTR81249

Market Overview at a Glance

$11.24 B
Market Opportunity
5.4%
CAGR 2025 - 2030
38.2%
North America Growth
$17.96 B
Wood segment 2024

Secondhand Furniture Market Size and Growth Forecast 2026-2030

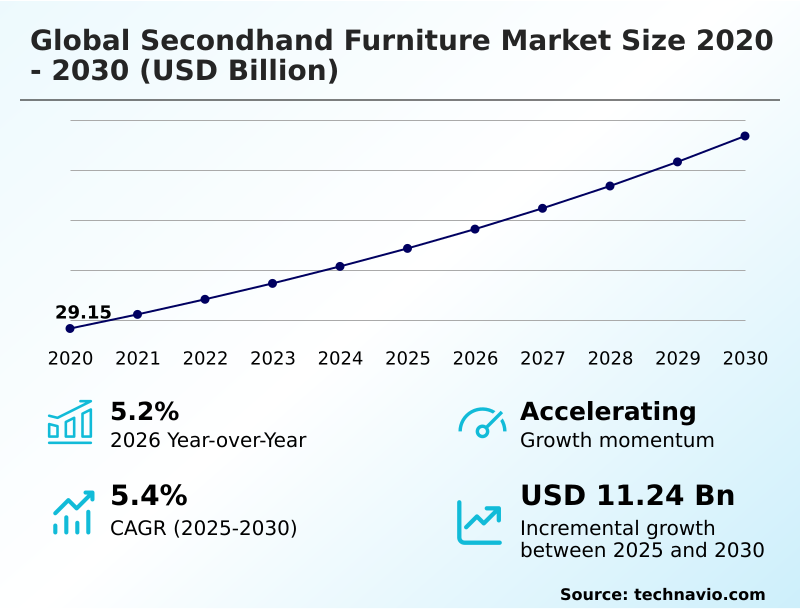
The Secondhand Furniture Market size was valued at USD 37.16 billion in 2025 growing at a CAGR of 5.4% during the forecast period 2026-2030.

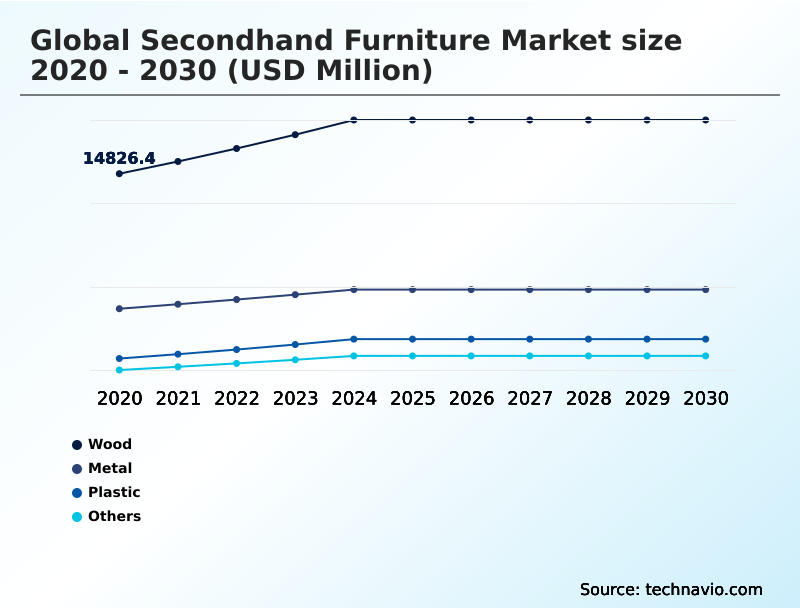
North America accounts for 38.2% of incremental growth during the forecast period. The Wood segment by Material was valued at USD 17.96 billion in 2024, while the Living room furniture segment holds the largest revenue share by Product Type.

The market is projected to grow by USD 19.25 billion from 2020 to 2030, with USD 11.24 billion of the growth expected during the forecast period of 2025 to 2030.

Get Key Insights on Market Forecast (PDF) Request Free Sample

Secondhand Furniture Market Overview

The secondhand furniture market is undergoing a structural evolution, driven by a convergence of economic pressures and a societal pivot towards the circular economy. This shift is replacing linear consumption with a robust recommerce framework built on reuse and refurbishment. A significant driver is the increasing adoption of corporate ESG mandates, which has professionalized B2B liquidation and asset decommissioning. For instance, a large financial services firm vacating a downtown office tower may engage a specialized reverse logistics partner to manage the removal of several thousand workstations. This partner ensures that over 90% of the pre-owned furniture is diverted from landfills through a combination of resale, donation, and recycling, providing the firm with auditable data for its sustainability reporting under frameworks like Extended Producer Responsibility (EPR). With North America contributing over 38% of the market's incremental growth and an overall year-over-year expansion of 5.2%, it is clear that demand for sustainable furnishings is no longer a niche preference but a core component of both consumer and corporate procurement strategies.

Drivers, Trends, and Challenges in the Secondhand Furniture Market

The global secondhand furniture market is maturing beyond simple peer-to-peer furniture exchange platforms into sophisticated circular economy business models. The growing awareness of fast furniture environmental impact is a primary driver, alongside the economic impact of inflation on furniture purchasing, which fuels consumer value-seeking behavior.

Furniture recommerce platform technology is evolving to address key industry friction points, particularly the complex logistics for bulky item resale and the need for robust secondhand furniture quality verification. This is especially true for online vintage furniture marketplaces, where secondhand luxury furniture authentication is critical for building trust.

The refurbished office chair market is also expanding due to increased B2B secondhand furniture procurement. Companies are utilizing corporate furniture decommissioning services for used office furniture liquidation, driven by mandates for sustainable furniture sourcing practices. The entire supply chain for refurbished furniture is being professionalized, with resale as a customer retention tool becoming a key strategy for original manufacturers.

Regulatory pressures, such as upcoming rules for a digital product passport for furniture and stricter enforcement of vintage furniture compliance standards under frameworks like the EU's Ecodesign for Sustainable Products Regulation, are forcing greater transparency. This is part of a broader push for extended producer responsibility for furniture, where manufacturers are accountable for the product's entire lifecycle.

In this environment, a company with a formalized take-back program can divert over 90% of its returned goods from landfills, a stark contrast to the less than 10% diversion rate common in informal disposal channels.

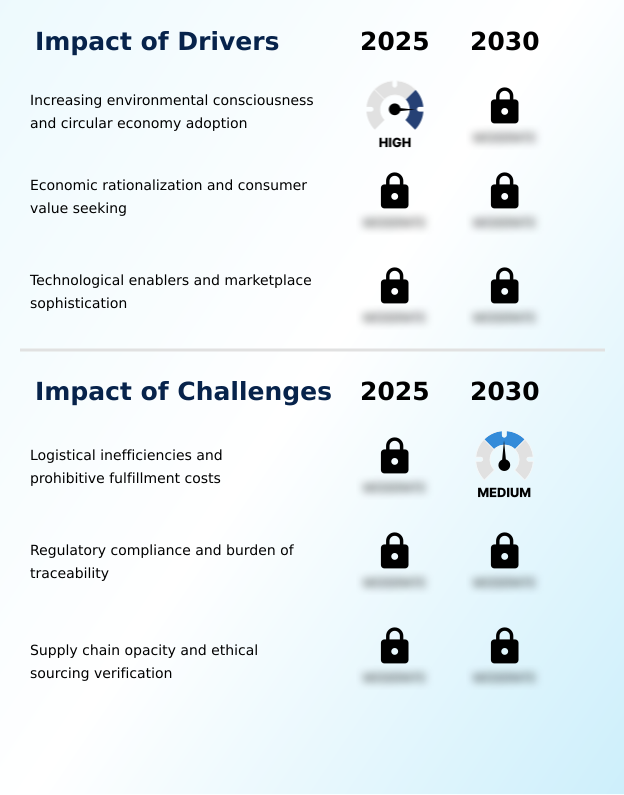
Primary Growth Driver: Increasing environmental consciousness and the adoption of the circular economy are key drivers, shifting consumer and corporate preferences toward sustainable, pre-owned goods.

The market's 5.2% year-over-year growth is fundamentally propelled by a global shift toward the circular economy and a heightened consumer focus on sustainable furnishings.

This eco-conscious mindset positions pre-owned furniture as a preferred choice, reinforced by regulatory pressures in Europe and North America. Economic factors, including rising living costs, amplify this driver, pushing consumers to seek items with high resale value retention.

The rapid maturation of recommerce technology is another critical catalyst, as advanced online marketplaces remove historical friction related to logistics and trust.

AI-driven tools for pricing and visual search, coupled with integrated payment and delivery solutions, have professionalized the sector, making the user experience for buying used goods comparable to new e-commerce and facilitating product-life extension.

Emerging Market Trend: A primary trend is the integration of recommerce into core retail strategy, as manufacturers and retailers launch proprietary resale programs to enhance customer retention and sustainability.

A dominant trend is the strategic pivot of original manufacturers toward recommerce, integrating take-back programs and resale into their core business models. This move is driven by the need to comply with emerging Extended Producer Responsibility (EPR) regulations and to capture value across the entire product lifecycle.

In the B2B sector, professionalization is accelerating, fueled by demand for corporate sustainability reporting. Large enterprises now require auditable data on landfill diversion from their B2B liquidation and asset decommissioning partners. This has led to the consolidation of the market around integrated firms that can manage large volumes of commercial-grade inventory.

The normalization of hybrid consumption, where consumers blend new and pre-owned items, further solidifies the market's position in mainstream retail, with value-based shopping becoming a key consumer driver.

Key Industry Challenge: Logistical inefficiencies and prohibitive fulfillment costs, particularly for bulky items, remain a key challenge affecting the scalability of the global market.

The primary challenge constraining market scalability is the complexity and high cost of reverse logistics, especially for non-conveyable packages like sofas and tables where last-mile delivery is a significant cost factor. The weight-to-value ratio often makes shipping economically unviable for non-local transactions. Regulatory compliance presents another significant hurdle.

The rollout of frameworks like the European Union's Digital Product Passport (DPP) creates a major challenge for resellers of older furniture who lack the original manufacturing data required for material traceability.

Furthermore, increasing demands for ethical sourcing and supply chain opacity reduction, mandated by laws combating forced labor, complicate the cross-border trade of high-value vintage items, as establishing a complete chain of custody for pre-owned goods is inherently difficult.

Explore Full Market Dynamics Analysis Request Free Sample

Secondhand Furniture Market Segmentation

The secondhand furniture industry research report provides comprehensive data including region-wise segment analysis, with forecasts and analysis for the period 2026-2030, as well as historical data from 2020-2024 for the following segments.

Market Segment by Material
  • Wood
  • Metal
  • Plastic
  • Others
Market Segment by Product type
  • Living room furniture
  • Beds and bedroom furniture
  • Office furniture
  • Kitchen and dining furniture
  • Others
Market Segment by Distribution channel
  • Offline
  • Online
Market Segment by Geography
North America
US, Canada, Mexico
Europe
Germany, UK, France, Italy, The Netherlands, Spain
APAC
China, Japan, India, South Korea, Australia, Indonesia
Middle East and Africa
Saudi Arabia, UAE, South Africa, Israel, Turkey
South America
Brazil, Argentina, Colombia

Material Segment Analysis

The wood segment is estimated to witness significant growth during the forecast period.

The wood segment is foundational to the market, driven by the durability and restoration potential of solid timber.

This category thrives on a robust refurbishment ecosystem, where vintage furniture is refinished, extending its lifecycle and supporting the demand for sustainable furnishings.

Unlike composite materials, high-quality wooden pieces are often viewed as having heirloom quality, accruing value and character over time. This preference rejects the disposability of fast furniture.

The segment's significance is underscored by its dominant market share, accounting for over 50% of revenue in 2025.

As regulatory frameworks evolve to demand greater material traceability, the inherent value and known provenance of solid wood pieces enhance their position in the circular economy, validating the commercial viability of this segment.

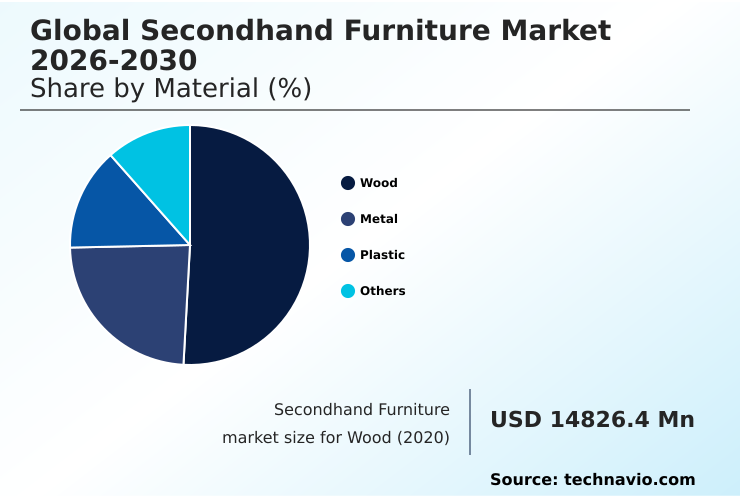
The Wood segment was valued at USD 17.96 billion in 2024 and showed a gradual increase during the forecast period.

Secondhand Furniture Market by Region: North America Leads with 38.2% Growth Share

North America is estimated to contribute 38.2% to the growth of the global market during the forecast period.

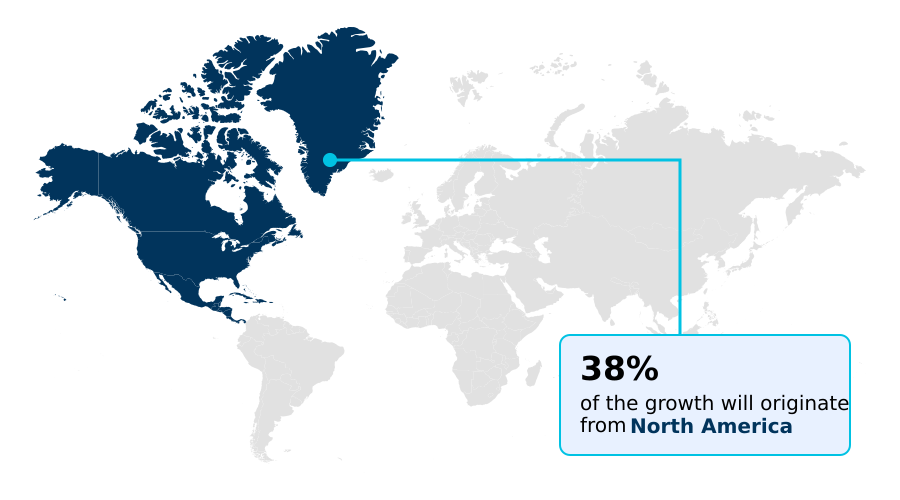
The geographic landscape is led by North America, which accounts for the largest market share, with the United States alone valued at over 10891.6 million in 2025.

This region's maturity is defined by a sophisticated recommerce ecosystem, featuring both high-volume peer-to-peer marketplaces and specialized managed marketplace platforms offering white-glove services.

Europe follows, with its growth structurally supported by government mandates like the EU's Circular Economy Action Plan, which incentivizes product-life extension.

In both regions, B2B liquidation is a significant contributor, with a steady flow of high-quality, commercial-grade inventory entering the secondary market from corporate decommissioning projects.

This supply is crucial for refurbishers and resellers catering to small businesses and startups seeking cost-effective, sustainable furnishing solutions.

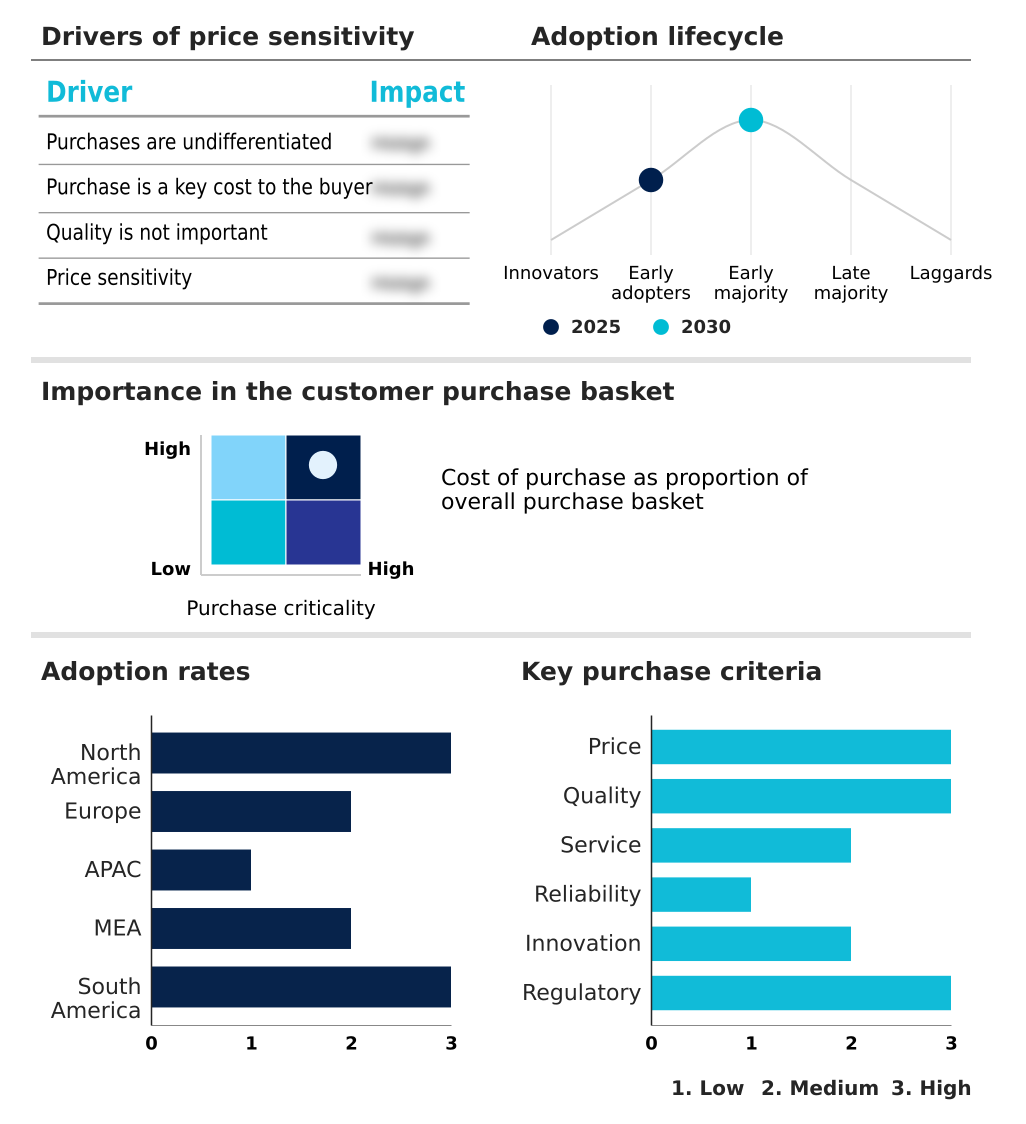
Customer Landscape Analysis for the Secondhand Furniture Market

The secondhand furniture market forecasting report includes the adoption lifecycle of the market, covering from the innovator’s stage to the laggard’s stage. It focuses on adoption rates in different regions based on penetration. Furthermore, the secondhand furniture market report also includes key purchase criteria and drivers of price sensitivity to help companies evaluate and develop their market growth analysis strategies.

Competitive Landscape of the Secondhand Furniture Market

Companies are implementing various strategies, such as strategic alliances, partnerships, mergers and acquisitions, geographical expansion, and product/service launches, to enhance their presence in the secondhand furniture market industry.

1stDibs.com Inc. - Key solutions feature a managed online marketplace for pre-owned furniture, which includes integrated logistics such as professional pickup, cleaning, and white-glove delivery to streamline transactions.

The industry research and growth report includes detailed analyses of the competitive landscape of the market and information about key companies, including:

  • 1stDibs.com Inc.
  • Almost Perfect Furniture Ltd.
  • AptDeco Inc.
  • Beverly Hills Chairs.
  • Business Furniture Warehouse
  • Carousell Pte. Ltd.
  • Chairish Inc.
  • Corporate Spec Ltd.
  • eBay Inc.
  • Envirotech
  • getkaiyo
  • Green Standards
  • Hock Siong and Co. Pte Ltd.
  • Inter IKEA Holding BV
  • National Office Interiors.
  • OneUp Furniture
  • Second Chance Furniture
  • SELENCY
  • SOS Office Furniture LLC.
  • Vinterior Group Ltd.

Qualitative and quantitative analysis of companies has been conducted to help clients understand the wider business environment as well as the strengths and weaknesses of key industry players. Data is qualitatively analyzed to categorize companies as pure play, category-focused, industry-focused, and diversified; it is quantitatively analyzed to categorize companies as dominant, leading, strong, tentative, and weak.

Recent Developments in the Secondhand Furniture Market

  • In August 2025, HNI Corporation entered into a definitive agreement to acquire Steelcase Inc. for approximately USD 2.2 billion, a move expected to consolidate the office furniture manufacturing sector and influence the downstream supply of commercial-grade inventory for the secondary market.
  • In February 2025, Ingka Group announced the nationwide expansion of its peer-to-peer resale marketplace, IKEA Preowned, across Spain and Norway, enabling customers to buy and sell used IKEA furniture directly through the brand's digital ecosystem.
  • In April 2025, Trove, a provider of branded resale technology, acquired the European circular trade platform reverse.Supply to unify its operating system for brands scaling their recommerce and trade-in programs across North America and Europe.
  • In May 2025, the reporting deadline for the second cycle under Canada's Fighting Against Forced Labour and Child Labour in Supply Chains Act passed, initiating stricter enforcement protocols and increasing compliance scrutiny on international platforms importing vintage furniture.

Research Analyst Overview: Secondhand Furniture Market

The operational core of the secondhand market is shifting from a fragmented peer-to-peer marketplace to a structured recommerce ecosystem underpinned by advanced recommerce technology. This evolution is driven by the formalization of the circular economy, impacting everything from product lifecycle management to reverse logistics.

Boardroom decisions now center on whether to build a proprietary managed marketplace or partner with a third-party platform for white-glove delivery and refurbishment services. This strategic choice is influenced by regulations like Canada's new supply chain act, which demands verifiable material traceability, making the consignment model for unverified antique furniture increasingly risky.

The wood segment, representing over 50% of market revenue, is particularly affected, as the demand for sustainable furnishings with clear provenance grows. Companies are leveraging upcycling and the trade of vintage furniture, including prized mid-century modern pieces, to meet landfill diversion targets under Extended Producer Responsibility (EPR) schemes.

The B2B liquidation of commercial-grade inventory and remanufactured office furniture through asset decommissioning is now a key supply channel, with some firms exploring furniture-as-a-service (FaaS) models to retain asset control. The forthcoming digital product passport (DPP) will further standardize this landscape for all pre-owned furniture.

Dive into Technavio’s robust research methodology, blending expert interviews, extensive data synthesis, and validated models for unparalleled Secondhand Furniture Market insights. See full methodology.

Request Free Sample

Market Scope
Page number 294
Base year 2025
Historic period 2020-2024
Forecast period 2026-2030
Growth momentum & CAGR Accelerate at a CAGR of 5.4%
Market growth 2026-2030 USD 11238.6 million
Market structure Fragmented
YoY growth 2025-2026(%) 5.2%
Key countries US, Canada, Mexico, Germany, UK, France, Italy, The Netherlands, Spain, China, Japan, India, South Korea, Australia, Indonesia, Saudi Arabia, UAE, South Africa, Israel, Turkey, Brazil, Argentina and Colombia
Competitive landscape Leading Companies, Market Positioning of Companies, Competitive Strategies, and Industry Risks

Secondhand Furniture Market: Key Questions Answered in This Report

  • What is the expected growth of the Secondhand Furniture Market between 2026 and 2030?

    • The Secondhand Furniture Market is expected to grow by USD 11.24 billion during 2026-2030, registering a CAGR of 5.4%. Year-over-year growth in 2026 is estimated at 5.2%%. This acceleration is shaped by increasing environmental consciousness and circular economy adoption, which is intensifying demand across multiple end-use verticals covered in the report.

  • What segmentation does the market report cover?

    • The report is segmented by Material (Wood, Metal, Plastic, and Others), Product Type (Living room furniture, Beds and bedroom furniture, Office furniture, Kitchen and dining furniture, and Others), Distribution Channel (Offline, and Online) and Geography (North America, Europe, APAC, Middle East and Africa, South America). Among these, the Wood segment is estimated to witness significant growth during the forecast period, driven by rising adoption across key application areas. Each segment includes detailed qualitative and quantitative analysis, along with historical data from 2020-2024 and forecasts through 2030 with year-over-year growth rates.

  • Which regions are analyzed in the report?

    • The report covers North America, Europe, APAC, Middle East and Africa and South America. North America is estimated to contribute 38.2% to market growth during the forecast period. Country-level analysis includes US, Canada, Mexico, Germany, UK, France, Italy, The Netherlands, Spain, China, Japan, India, South Korea, Australia, Indonesia, Saudi Arabia, UAE, South Africa, Israel, Turkey, Brazil, Argentina and Colombia, with dedicated market size tables and year-over-year growth for each.

  • What are the key growth drivers and market challenges?

    • The primary driver is increasing environmental consciousness and circular economy adoption, which is accelerating investment and industry demand. The main challenge is logistical inefficiencies and prohibitive fulfillment costs, creating operational barriers for key market participants. The report quantifies the impact of each driver and challenge across 2026 and 2030 with comparative analysis.

  • Who are the major players in the Secondhand Furniture Market?

    • Key vendors include 1stDibs.com Inc., Almost Perfect Furniture Ltd., AptDeco Inc., Beverly Hills Chairs., Business Furniture Warehouse, Carousell Pte. Ltd., Chairish Inc., Corporate Spec Ltd., eBay Inc., Envirotech, getkaiyo, Green Standards, Hock Siong and Co. Pte Ltd., Inter IKEA Holding BV, National Office Interiors., OneUp Furniture, Second Chance Furniture, SELENCY, SOS Office Furniture LLC. and Vinterior Group Ltd.. The report provides qualitative and quantitative analysis categorizing companies as dominant, leading, strong, tentative, and weak based on their market positioning. Company profiles include business segment analysis, SWOT assessment, key offerings, and recent strategic developments.

Secondhand Furniture Market Research Insights

Market dynamics are increasingly shaped by regulatory frameworks compelling manufacturers to adopt circular design principles and establish formal take-back programs. The EU's forthcoming Digital Product Passport (DPP) regulation, for example, will mandate material transparency, directly influencing resale value retention and bolstering consumer trust.

This contrasts with market development in the APAC region, which is growing at a faster rate of 6.1% compared to Europe's 4.8%, driven more by rapid urbanization than regulatory pressure. In practice, furniture manufacturers are now integrating resale platforms to manage returned inventory, which helps them meet ESG reporting requirements for landfill diversion and provides auditable proof of ethical sourcing.

This strategic shift transforms pre-owned goods from a disposal liability into a managed asset class.

We can help! Our analysts can customize this secondhand furniture market research report to meet your requirements.

Get in touch

1. Executive Summary

1.1 Market overview

Executive Summary - Chart on Market Overview
Executive Summary - Data Table on Market Overview
Executive Summary - Chart on Global Market Characteristics
Executive Summary - Chart on Market by Geography
Executive Summary - Chart on Market Segmentation by Material
Executive Summary - Chart on Market Segmentation by Product Type
Executive Summary - Chart on Market Segmentation by Distribution Channel
Executive Summary - Chart on Incremental Growth
Executive Summary - Data Table on Incremental Growth
Executive Summary - Chart on Company Market Positioning

2. Technavio Analysis

2.1 Analysis of price sensitivity, lifecycle, customer purchase basket, adoption rates, and purchase criteria

2.2 Criticality of inputs and Factors of differentiation

Chart on Overview on criticality of inputs and factors of differentiation

2.3 Factors of disruption

Chart on Overview on factors of disruption

2.4 Impact of drivers and challenges

Chart on Impact of drivers and challenges in 2025 and 2030

3. Market Landscape

3.1 Market ecosystem

Chart on Parent Market
Data Table on - Parent Market

3.2 Market characteristics

Chart on Market characteristics analysis

3.3 Value chain analysis

Chart on Value chain analysis

4. Market Sizing

4.1 Market definition

Data Table on Offerings of companies included in the market definition

4.2 Market segment analysis

Market segments

4.3 Market size 2025

4.4 Market outlook: Forecast for 2025-2030

Chart on Global - Market size and forecast 2025-2030 ($ million)
Data Table on Global - Market size and forecast 2025-2030 ($ million)
Chart on Global Market: Year-over-year growth 2025-2030 (%)
Data Table on Global Market: Year-over-year growth 2025-2030 (%)

5. Historic Market Size

5.1 Global Secondhand Furniture Market 2020 - 2024

Historic Market Size - Data Table on Global Secondhand Furniture Market 2020 - 2024 ($ million)

5.2 Material segment analysis 2020 - 2024

Historic Market Size - Material Segment 2020 - 2024 ($ million)

5.3 Product Type segment analysis 2020 - 2024

Historic Market Size - Product Type Segment 2020 - 2024 ($ million)

5.4 Distribution Channel segment analysis 2020 - 2024

Historic Market Size - Distribution Channel Segment 2020 - 2024 ($ million)

5.5 Geography segment analysis 2020 - 2024

Historic Market Size - Geography Segment 2020 - 2024 ($ million)

5.6 Country segment analysis 2020 - 2024

Historic Market Size - Country Segment 2020 - 2024 ($ million)

6. Qualitative Analysis

6.1 The AI impact on global secondhand furniture market

7. Five Forces Analysis

7.1 Five forces summary

Five forces analysis - Comparison between 2025 and 2030

7.2 Bargaining power of buyers

Bargaining power of buyers - Impact of key factors 2025 and 2030

7.3 Bargaining power of suppliers

Bargaining power of suppliers - Impact of key factors in 2025 and 2030

7.4 Threat of new entrants

Threat of new entrants - Impact of key factors in 2025 and 2030

7.5 Threat of substitutes

Threat of substitutes - Impact of key factors in 2025 and 2030

7.6 Threat of rivalry

Threat of rivalry - Impact of key factors in 2025 and 2030

7.7 Market condition

Chart on Market condition - Five forces 2025 and 2030

8. Market Segmentation by Material

8.1 Market segments

Chart on Material - Market share 2025-2030 (%)
Data Table on Material - Market share 2025-2030 (%)

8.2 Comparison by Material

Chart on Comparison by Material
Data Table on Comparison by Material

8.3 Wood - Market size and forecast 2025-2030

Chart on Wood - Market size and forecast 2025-2030 ($ million)
Data Table on Wood - Market size and forecast 2025-2030 ($ million)
Chart on Wood - Year-over-year growth 2025-2030 (%)
Data Table on Wood - Year-over-year growth 2025-2030 (%)

8.4 Metal - Market size and forecast 2025-2030

Chart on Metal - Market size and forecast 2025-2030 ($ million)
Data Table on Metal - Market size and forecast 2025-2030 ($ million)
Chart on Metal - Year-over-year growth 2025-2030 (%)
Data Table on Metal - Year-over-year growth 2025-2030 (%)

8.5 Plastic - Market size and forecast 2025-2030

Chart on Plastic - Market size and forecast 2025-2030 ($ million)
Data Table on Plastic - Market size and forecast 2025-2030 ($ million)
Chart on Plastic - Year-over-year growth 2025-2030 (%)
Data Table on Plastic - Year-over-year growth 2025-2030 (%)

8.6 Others - Market size and forecast 2025-2030

Chart on Others - Market size and forecast 2025-2030 ($ million)
Data Table on Others - Market size and forecast 2025-2030 ($ million)
Chart on Others - Year-over-year growth 2025-2030 (%)
Data Table on Others - Year-over-year growth 2025-2030 (%)

8.7 Market opportunity by Material

Market opportunity by Material ($ million)
Data Table on Market opportunity by Material ($ million)

9. Market Segmentation by Product Type

9.1 Market segments

Chart on Product Type - Market share 2025-2030 (%)
Data Table on Product Type - Market share 2025-2030 (%)

9.2 Comparison by Product Type

Chart on Comparison by Product Type
Data Table on Comparison by Product Type

9.3 Living room furniture - Market size and forecast 2025-2030

Chart on Living room furniture - Market size and forecast 2025-2030 ($ million)
Data Table on Living room furniture - Market size and forecast 2025-2030 ($ million)
Chart on Living room furniture - Year-over-year growth 2025-2030 (%)
Data Table on Living room furniture - Year-over-year growth 2025-2030 (%)

9.4 Beds and bedroom furniture - Market size and forecast 2025-2030

Chart on Beds and bedroom furniture - Market size and forecast 2025-2030 ($ million)
Data Table on Beds and bedroom furniture - Market size and forecast 2025-2030 ($ million)
Chart on Beds and bedroom furniture - Year-over-year growth 2025-2030 (%)
Data Table on Beds and bedroom furniture - Year-over-year growth 2025-2030 (%)

9.5 Office furniture - Market size and forecast 2025-2030

Chart on Office furniture - Market size and forecast 2025-2030 ($ million)
Data Table on Office furniture - Market size and forecast 2025-2030 ($ million)
Chart on Office furniture - Year-over-year growth 2025-2030 (%)
Data Table on Office furniture - Year-over-year growth 2025-2030 (%)

9.6 Kitchen and dining furniture - Market size and forecast 2025-2030

Chart on Kitchen and dining furniture - Market size and forecast 2025-2030 ($ million)
Data Table on Kitchen and dining furniture - Market size and forecast 2025-2030 ($ million)
Chart on Kitchen and dining furniture - Year-over-year growth 2025-2030 (%)
Data Table on Kitchen and dining furniture - Year-over-year growth 2025-2030 (%)

9.7 Others - Market size and forecast 2025-2030

Chart on Others - Market size and forecast 2025-2030 ($ million)
Data Table on Others - Market size and forecast 2025-2030 ($ million)
Chart on Others - Year-over-year growth 2025-2030 (%)
Data Table on Others - Year-over-year growth 2025-2030 (%)

9.8 Market opportunity by Product Type

Market opportunity by Product Type ($ million)
Data Table on Market opportunity by Product Type ($ million)

10. Market Segmentation by Distribution Channel

10.1 Market segments

Chart on Distribution Channel - Market share 2025-2030 (%)
Data Table on Distribution Channel - Market share 2025-2030 (%)

10.2 Comparison by Distribution Channel

Chart on Comparison by Distribution Channel
Data Table on Comparison by Distribution Channel

10.3 Offline - Market size and forecast 2025-2030

Chart on Offline - Market size and forecast 2025-2030 ($ million)
Data Table on Offline - Market size and forecast 2025-2030 ($ million)
Chart on Offline - Year-over-year growth 2025-2030 (%)
Data Table on Offline - Year-over-year growth 2025-2030 (%)

10.4 Online - Market size and forecast 2025-2030

Chart on Online - Market size and forecast 2025-2030 ($ million)
Data Table on Online - Market size and forecast 2025-2030 ($ million)
Chart on Online - Year-over-year growth 2025-2030 (%)
Data Table on Online - Year-over-year growth 2025-2030 (%)

10.5 Market opportunity by Distribution Channel

Market opportunity by Distribution Channel ($ million)
Data Table on Market opportunity by Distribution Channel ($ million)

11. Customer Landscape

11.1 Customer landscape overview

Analysis of price sensitivity, lifecycle, customer purchase basket, adoption rates, and purchase criteria

12. Geographic Landscape

12.1 Geographic segmentation

Chart on Market share by geography 2025-2030 (%)
Data Table on Market share by geography 2025-2030 (%)

12.2 Geographic comparison

Chart on Geographic comparison
Data Table on Geographic comparison

12.3 North America - Market size and forecast 2025-2030

Chart on North America - Market size and forecast 2025-2030 ($ million)
Data Table on North America - Market size and forecast 2025-2030 ($ million)
Chart on North America - Year-over-year growth 2025-2030 (%)
Data Table on North America - Year-over-year growth 2025-2030 (%)
Chart on Regional Comparison - North America
Data Table on Regional Comparison - North America

12.3.1 US - Market size and forecast 2025-2030

Chart on US - Market size and forecast 2025-2030 ($ million)
Data Table on US - Market size and forecast 2025-2030 ($ million)
Chart on US - Year-over-year growth 2025-2030 (%)
Data Table on US - Year-over-year growth 2025-2030 (%)

12.3.2 Canada - Market size and forecast 2025-2030

Chart on Canada - Market size and forecast 2025-2030 ($ million)
Data Table on Canada - Market size and forecast 2025-2030 ($ million)
Chart on Canada - Year-over-year growth 2025-2030 (%)
Data Table on Canada - Year-over-year growth 2025-2030 (%)

12.3.3 Mexico - Market size and forecast 2025-2030

Chart on Mexico - Market size and forecast 2025-2030 ($ million)
Data Table on Mexico - Market size and forecast 2025-2030 ($ million)
Chart on Mexico - Year-over-year growth 2025-2030 (%)
Data Table on Mexico - Year-over-year growth 2025-2030 (%)

12.4 Europe - Market size and forecast 2025-2030

Chart on Europe - Market size and forecast 2025-2030 ($ million)
Data Table on Europe - Market size and forecast 2025-2030 ($ million)
Chart on Europe - Year-over-year growth 2025-2030 (%)
Data Table on Europe - Year-over-year growth 2025-2030 (%)
Chart on Regional Comparison - Europe
Data Table on Regional Comparison - Europe

12.4.1 Germany - Market size and forecast 2025-2030

Chart on Germany - Market size and forecast 2025-2030 ($ million)
Data Table on Germany - Market size and forecast 2025-2030 ($ million)
Chart on Germany - Year-over-year growth 2025-2030 (%)
Data Table on Germany - Year-over-year growth 2025-2030 (%)

12.4.2 UK - Market size and forecast 2025-2030

Chart on UK - Market size and forecast 2025-2030 ($ million)
Data Table on UK - Market size and forecast 2025-2030 ($ million)
Chart on UK - Year-over-year growth 2025-2030 (%)
Data Table on UK - Year-over-year growth 2025-2030 (%)

12.4.3 France - Market size and forecast 2025-2030

Chart on France - Market size and forecast 2025-2030 ($ million)
Data Table on France - Market size and forecast 2025-2030 ($ million)
Chart on France - Year-over-year growth 2025-2030 (%)
Data Table on France - Year-over-year growth 2025-2030 (%)

12.4.4 Italy - Market size and forecast 2025-2030

Chart on Italy - Market size and forecast 2025-2030 ($ million)
Data Table on Italy - Market size and forecast 2025-2030 ($ million)
Chart on Italy - Year-over-year growth 2025-2030 (%)
Data Table on Italy - Year-over-year growth 2025-2030 (%)

12.4.5 The Netherlands - Market size and forecast 2025-2030

Chart on The Netherlands - Market size and forecast 2025-2030 ($ million)
Data Table on The Netherlands - Market size and forecast 2025-2030 ($ million)
Chart on The Netherlands - Year-over-year growth 2025-2030 (%)
Data Table on The Netherlands - Year-over-year growth 2025-2030 (%)

12.4.6 Spain - Market size and forecast 2025-2030

Chart on Spain - Market size and forecast 2025-2030 ($ million)
Data Table on Spain - Market size and forecast 2025-2030 ($ million)
Chart on Spain - Year-over-year growth 2025-2030 (%)
Data Table on Spain - Year-over-year growth 2025-2030 (%)

12.5 APAC - Market size and forecast 2025-2030

Chart on APAC - Market size and forecast 2025-2030 ($ million)
Data Table on APAC - Market size and forecast 2025-2030 ($ million)
Chart on APAC - Year-over-year growth 2025-2030 (%)
Data Table on APAC - Year-over-year growth 2025-2030 (%)
Chart on Regional Comparison - APAC
Data Table on Regional Comparison - APAC

12.5.1 China - Market size and forecast 2025-2030

Chart on China - Market size and forecast 2025-2030 ($ million)
Data Table on China - Market size and forecast 2025-2030 ($ million)
Chart on China - Year-over-year growth 2025-2030 (%)
Data Table on China - Year-over-year growth 2025-2030 (%)

12.5.2 Japan - Market size and forecast 2025-2030

Chart on Japan - Market size and forecast 2025-2030 ($ million)
Data Table on Japan - Market size and forecast 2025-2030 ($ million)
Chart on Japan - Year-over-year growth 2025-2030 (%)
Data Table on Japan - Year-over-year growth 2025-2030 (%)

12.5.3 India - Market size and forecast 2025-2030

Chart on India - Market size and forecast 2025-2030 ($ million)
Data Table on India - Market size and forecast 2025-2030 ($ million)
Chart on India - Year-over-year growth 2025-2030 (%)
Data Table on India - Year-over-year growth 2025-2030 (%)

12.5.4 South Korea - Market size and forecast 2025-2030

Chart on South Korea - Market size and forecast 2025-2030 ($ million)
Data Table on South Korea - Market size and forecast 2025-2030 ($ million)
Chart on South Korea - Year-over-year growth 2025-2030 (%)
Data Table on South Korea - Year-over-year growth 2025-2030 (%)

12.5.5 Australia - Market size and forecast 2025-2030

Chart on Australia - Market size and forecast 2025-2030 ($ million)
Data Table on Australia - Market size and forecast 2025-2030 ($ million)
Chart on Australia - Year-over-year growth 2025-2030 (%)
Data Table on Australia - Year-over-year growth 2025-2030 (%)

12.5.6 Indonesia - Market size and forecast 2025-2030

Chart on Indonesia - Market size and forecast 2025-2030 ($ million)
Data Table on Indonesia - Market size and forecast 2025-2030 ($ million)
Chart on Indonesia - Year-over-year growth 2025-2030 (%)
Data Table on Indonesia - Year-over-year growth 2025-2030 (%)

12.6 Middle East and Africa - Market size and forecast 2025-2030

Chart on Middle East and Africa - Market size and forecast 2025-2030 ($ million)
Data Table on Middle East and Africa - Market size and forecast 2025-2030 ($ million)
Chart on Middle East and Africa - Year-over-year growth 2025-2030 (%)
Data Table on Middle East and Africa - Year-over-year growth 2025-2030 (%)
Chart on Regional Comparison - Middle East and Africa
Data Table on Regional Comparison - Middle East and Africa

12.6.1 Saudi Arabia - Market size and forecast 2025-2030

Chart on Saudi Arabia - Market size and forecast 2025-2030 ($ million)
Data Table on Saudi Arabia - Market size and forecast 2025-2030 ($ million)
Chart on Saudi Arabia - Year-over-year growth 2025-2030 (%)
Data Table on Saudi Arabia - Year-over-year growth 2025-2030 (%)

12.6.2 UAE - Market size and forecast 2025-2030

Chart on UAE - Market size and forecast 2025-2030 ($ million)
Data Table on UAE - Market size and forecast 2025-2030 ($ million)
Chart on UAE - Year-over-year growth 2025-2030 (%)
Data Table on UAE - Year-over-year growth 2025-2030 (%)

12.6.3 South Africa - Market size and forecast 2025-2030

Chart on South Africa - Market size and forecast 2025-2030 ($ million)
Data Table on South Africa - Market size and forecast 2025-2030 ($ million)
Chart on South Africa - Year-over-year growth 2025-2030 (%)
Data Table on South Africa - Year-over-year growth 2025-2030 (%)

12.6.4 Israel - Market size and forecast 2025-2030

Chart on Israel - Market size and forecast 2025-2030 ($ million)
Data Table on Israel - Market size and forecast 2025-2030 ($ million)
Chart on Israel - Year-over-year growth 2025-2030 (%)
Data Table on Israel - Year-over-year growth 2025-2030 (%)

12.6.5 Turkey - Market size and forecast 2025-2030

Chart on Turkey - Market size and forecast 2025-2030 ($ million)
Data Table on Turkey - Market size and forecast 2025-2030 ($ million)
Chart on Turkey - Year-over-year growth 2025-2030 (%)
Data Table on Turkey - Year-over-year growth 2025-2030 (%)

12.7 South America - Market size and forecast 2025-2030

Chart on South America - Market size and forecast 2025-2030 ($ million)
Data Table on South America - Market size and forecast 2025-2030 ($ million)
Chart on South America - Year-over-year growth 2025-2030 (%)
Data Table on South America - Year-over-year growth 2025-2030 (%)
Chart on Regional Comparison - South America
Data Table on Regional Comparison - South America

12.7.1 Brazil - Market size and forecast 2025-2030

Chart on Brazil - Market size and forecast 2025-2030 ($ million)
Data Table on Brazil - Market size and forecast 2025-2030 ($ million)
Chart on Brazil - Year-over-year growth 2025-2030 (%)
Data Table on Brazil - Year-over-year growth 2025-2030 (%)

12.7.2 Argentina - Market size and forecast 2025-2030

Chart on Argentina - Market size and forecast 2025-2030 ($ million)
Data Table on Argentina - Market size and forecast 2025-2030 ($ million)
Chart on Argentina - Year-over-year growth 2025-2030 (%)
Data Table on Argentina - Year-over-year growth 2025-2030 (%)

12.7.3 Colombia - Market size and forecast 2025-2030

Chart on Colombia - Market size and forecast 2025-2030 ($ million)
Data Table on Colombia - Market size and forecast 2025-2030 ($ million)
Chart on Colombia - Year-over-year growth 2025-2030 (%)
Data Table on Colombia - Year-over-year growth 2025-2030 (%)

12.8 Market opportunity by geography

Market opportunity by geography ($ million)
Data Tables on Market opportunity by geography ($ million)

13. Drivers, Challenges, and Opportunity

13.1 Market drivers

Increasing environmental consciousness and circular economy adoption
Economic rationalization and consumer value seeking
Technological enablers and marketplace sophistication

13.2 Market challenges

Logistical inefficiencies and prohibitive fulfillment costs
Regulatory compliance and burden of traceability
Supply chain opacity and ethical sourcing verification

13.3 Impact of drivers and challenges

Impact of drivers and challenges in 2025 and 2030

13.4 Market opportunities

Integration of recommerce into core retail strategy
Consolidation of B2B decommissioning and corporate circularity
Normalization of hybrid consumption and value-based shopping

14. Competitive Landscape

14.1 Overview

14.2

Overview on criticality of inputs and factors of differentiation

14.3 Landscape disruption

Overview on factors of disruption

14.4 Industry risks

Impact of key risks on business

15. Competitive Analysis

15.1 Companies profiled

Companies covered

15.2 Company ranking index

15.3 Market positioning of companies

Matrix on companies position and classification

15.4 1stDibs.com Inc.

1stDibs.com Inc. - Overview
1stDibs.com Inc. - Product / Service
1stDibs.com Inc. - Key offerings
SWOT

15.5 Almost Perfect Furniture Ltd.

Almost Perfect Furniture Ltd. - Overview
Almost Perfect Furniture Ltd. - Product / Service
Almost Perfect Furniture Ltd. - Key offerings
SWOT

15.6 AptDeco Inc.

AptDeco Inc. - Overview
AptDeco Inc. - Product / Service
AptDeco Inc. - Key offerings
SWOT

15.7 Beverly Hills Chairs.

Beverly Hills Chairs. - Overview
Beverly Hills Chairs. - Product / Service
Beverly Hills Chairs. - Key offerings
SWOT

15.8 Chairish Inc.

Chairish Inc. - Overview
Chairish Inc. - Product / Service
Chairish Inc. - Key offerings
SWOT

15.9 Corporate Spec Ltd.

Corporate Spec Ltd. - Overview
Corporate Spec Ltd. - Product / Service
Corporate Spec Ltd. - Key offerings
SWOT

15.10 eBay Inc.

eBay Inc. - Overview
eBay Inc. - Product / Service
eBay Inc. - Key offerings
SWOT

15.11 Envirotech

Envirotech - Overview
Envirotech - Product / Service
Envirotech - Key offerings
SWOT

15.12 getkaiyo

getkaiyo - Overview
getkaiyo - Product / Service
getkaiyo - Key offerings
SWOT

15.13 Green Standards

Green Standards - Overview
Green Standards - Product / Service
Green Standards - Key offerings
SWOT

15.14 Inter IKEA Holding BV

Inter IKEA Holding BV - Overview
Inter IKEA Holding BV - Product / Service
Inter IKEA Holding BV - Key news
Inter IKEA Holding BV - Key offerings
SWOT

15.15 National Office Interiors.

National Office Interiors. - Overview
National Office Interiors. - Product / Service
National Office Interiors. - Key offerings
SWOT

15.16 OneUp Furniture

OneUp Furniture - Overview
OneUp Furniture - Product / Service
OneUp Furniture - Key offerings
SWOT

15.17 SELENCY

SELENCY - Overview
SELENCY - Product / Service
SELENCY - Key offerings
SWOT

15.18 Vinterior Group Ltd.

Vinterior Group Ltd. - Overview
Vinterior Group Ltd. - Product / Service
Vinterior Group Ltd. - Key offerings
SWOT

16. Appendix

16.1 Scope of the report

Market definition
Objectives
Notes and caveats

16.2 Inclusions and exclusions checklist

Inclusions checklist
Exclusions checklist

16.3 Currency conversion rates for US$

16.4 Research methodology

16.5 Data procurement

Information sources

16.6 Data validation

16.7 Validation techniques employed for market sizing

16.8 Data synthesis

16.9 360 degree market analysis

16.10 List of abbreviations

Research Methodology

Technavio presents a detailed picture of the market by way of study, synthesis, and summation of data from multiple sources. The analysts have presented the various facets of the market with a particular focus on identifying the key industry influencers. The data thus presented is comprehensive, reliable, and the result of extensive research, both primary and secondary.

INFORMATION SOURCES

Primary sources

  • Manufacturers and suppliers
  • Channel partners
  • Industry experts
  • Strategic decision makers

Secondary sources

  • Industry journals and periodicals
  • Government data
  • Financial reports of key industry players
  • Historical data
  • Press releases

DATA ANALYSIS

Data Synthesis

  • Collation of data
  • Estimation of key figures
  • Analysis of derived insights

Data Validation

  • Triangulation with data models
  • Reference against proprietary databases
  • Corroboration with industry experts

REPORT WRITING

Qualitative

  • Market drivers
  • Market challenges
  • Market trends
  • Five forces analysis

Quantitative

  • Market size and forecast
  • Market segmentation
  • Geographical insights
  • Competitive landscape

Interested in this report?

Get your sample now to see our research methodology and insights!

Download Now

Frequently Asked Questions

Secondhand Furniture market growth will increase by USD 11238.6 million during 2026-2030.

The Secondhand Furniture market is expected to grow at a CAGR of 5.4% during 2026-2030.

Secondhand Furniture market is segmented by Material (Wood, Metal, Plastic, Others) Product type (Living room furniture, Beds and bedroom furniture, Office furniture, Kitchen and dining furniture, Others) Distribution channel (Offline, Online)

1stDibs.com Inc., Almost Perfect Furniture Ltd., AptDeco Inc., Beverly Hills Chairs., Business Furniture Warehouse, Carousell Pte. Ltd., Chairish Inc., Corporate Spec Ltd., eBay Inc., Envirotech, getkaiyo, Green Standards, Hock Siong and Co. Pte Ltd., Inter IKEA Holding BV, National Office Interiors., OneUp Furniture, Second Chance Furniture, SELENCY, SOS Office Furniture LLC., Vinterior Group Ltd. are a few of the key vendors in the Secondhand Furniture market.

North America will register the highest growth rate of 38.2% among the other regions. Therefore, the Secondhand Furniture market in North America is expected to garner significant business opportunities for the vendors during the forecast period.

US, Canada, Mexico, Germany, UK, France, Italy, The Netherlands, Spain, China, Japan, India, South Korea, Australia, Indonesia, Saudi Arabia, UAE, South Africa, Israel, Turkey, Brazil, Argentina, Colombia

  • Increasing environmental consciousness and circular economy adoption is the driving factor this market.

The Secondhand Furniture market vendors should focus on grabbing business opportunities from the Material segment as it accounted for the largest market share in the base year.
RIA - Research AI Assistant
Ask RIA