Renewable Energy Storage For AI Data Centers Market Analysis, Size, and Forecast 2026-2030: North America (US, Canada, and Mexico), APAC (China, India, and Japan), Europe (Germany, UK, and France), Middle East and Africa (Saudi Arabia, UAE, and South Africa), South America (Brazil, Argentina, and Colombia), and Rest of World (ROW)

Renewable Energy Storage For AI Data Centers Market Analysis, Size, and Forecast 2026-2030:
North America (US, Canada, and Mexico), APAC (China, India, and Japan), Europe (Germany, UK, and France), Middle East and Africa (Saudi Arabia, UAE, and South Africa), South America (Brazil, Argentina, and Colombia), and Rest of World (ROW)

Published: May 2026 318 Pages SKU: IRTNTR81356

Market Overview at a Glance

$329.85 Mn
Market Opportunity
20.2%
CAGR 2025 - 2030
34.9%
North America Growth
$112.65 Mn
Lithium-ion battery storage segment 2024

Renewable Energy Storage For Ai Data Centers Market Size and Growth Forecast 2026-2030

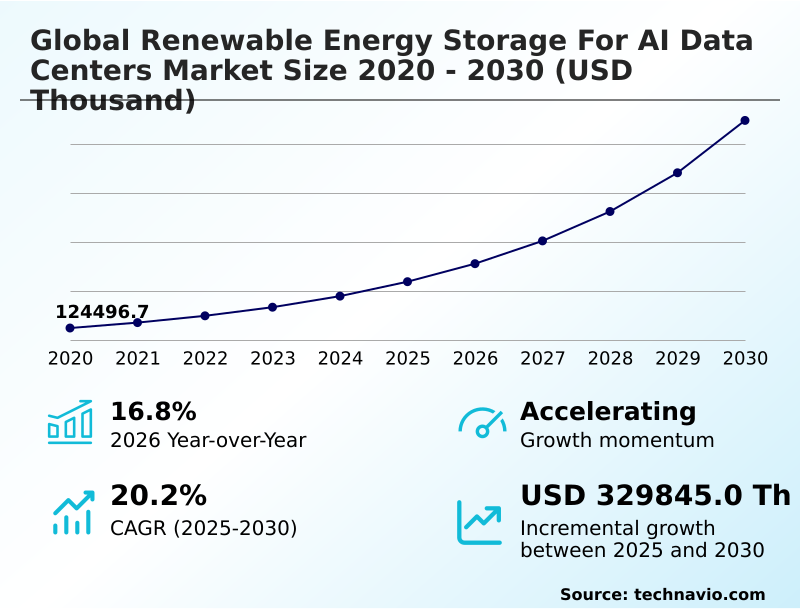
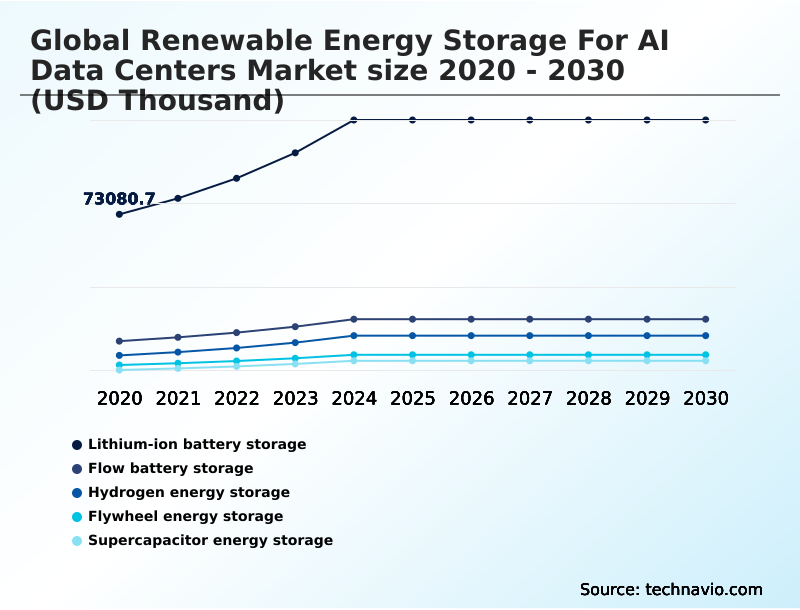
The Renewable Energy Storage For Ai Data Centers Market size was valued at USD 219.28 million in 2025 growing at a CAGR of 20.2% during the forecast period 2026-2030.

North America accounts for 34.9% of incremental growth during the forecast period. The Lithium-ion battery storage segment by Technology was valued at USD 112.65 million in 2024, while the Hyperscale data centers segment holds the largest revenue share by End-user.

The market is projected to grow by from 2020 to 2030, with USD 329.85 million of the growth expected during the forecast period of 2025 to 2030.

Get Key Insights on Market Forecast (PDF) Request Free Sample

Renewable Energy Storage For Ai Data Centers Market Overview

The renewable energy storage for AI data centers market is defined by the critical need for power resilience to support escalating computational demands. North America is set to capture over 34% of the market's incremental growth, driven by massive investments in hyperscale data center energy infrastructure. Key trends include the deployment of long-duration energy storage and AI-driven energy management to optimize costs and meet corporate sustainability goals. A typical business scenario involves a colocation facility installing a behind-the-meter battery energy storage system to perform peak shaving, reducing its electricity costs by avoiding high demand charges while offering tenants a premium for renewably-powered, uninterruptible power supply. This strategy not only lowers operational energy expenditure but also provides ancillary grid services, creating an additional revenue stream. The market's trajectory is shaped by a dual push for performance and sustainability, forcing operators to innovate beyond traditional power backup solutions toward integrated, intelligent energy hubs using solid oxide fuel cells and software-defined power.

Drivers, Trends, and Challenges in the Renewable Energy Storage For Ai Data Centers Market

Strategic deployment within the renewable energy storage for AI data centers market requires a comprehensive cost-benefit analysis of data center microgrids, moving beyond simple backup to full energy market participation. An essential first step is navigating grid interconnection for data centers, a process often hampered by multi-year queues and complex technical requirements under standards like IEEE 1547.

Once approved, the focus shifts to the hardware, with an LFP versus NMC for stationary storage decision weighing the former's safety and longevity against the latter's energy density. For instance, a hyperscale operator in a water-scarce region might select a closed-loop thermal management for containerized BESS to minimize water use, a critical factor in achieving sustainability targets.

The operational phase necessitates AI software for energy storage optimization to maximize the ROI of behind-the-meter battery storage and ensure power reliability for LLM training.

Finally, end-of-life management is governed by regulations such as the EU Battery Regulation, mandating circular economy models for data center batteries, including the assessment of second-life EV batteries for data center use, which are vital for long-term sustainability and compliance.

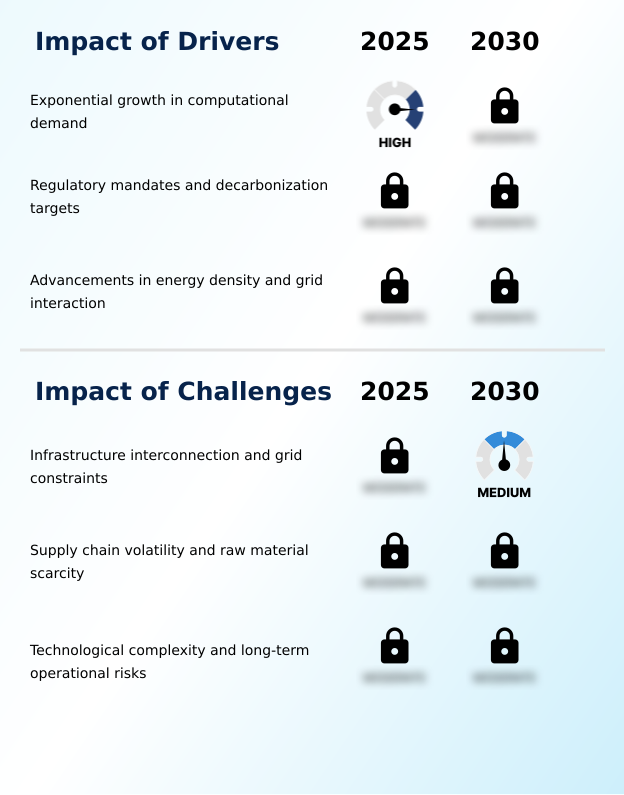
Primary Growth Driver: The exponential growth in computational demand from AI workloads is the primary driver for deploying large-scale renewable energy storage solutions to ensure power stability and sustainability.

Market growth is primarily propelled by the convergence of escalating computational demand and stringent regulatory pressures. The energy required by high-density server racks for AI workloads has surpassed the reliability of many public grids, making on-site storage a necessity.

Concurrently, mandates for Scope 2 emissions reporting are compelling operators to adopt carbon-neutral data centers, directly fueling investment in renewable storage.

Government incentives, such as tax credits under the US Inflation Reduction Act, further de-risk the capital expenditure for these systems.

This creates a strong business case for deploying storage to engage in demand response programs and secure favorable energy procurement agreements, aligning corporate sustainability goals with financial incentives and ensuring a stable power source for uninterrupted operations.

Emerging Market Trend: The integration of resilient microgrid design allows for autonomous data center resilience. This shift ensures operational continuity for high-performance computing clusters independent of regional grid failures.

Key trends are reshaping data center power architecture toward autonomous, sustainable operation. The adoption of resilient microgrid design is paramount, enabling facilities to function independently during grid outages. This is coupled with a strong push for circular economy principles, where battery lifecycle management and second-life battery applications are integrated into planning to comply with regulations like the WEEE Directive.

Simultaneously, the industry is leveraging AI-driven energy management and software-defined power to enable predictive load balancing in real time. This allows for dynamic energy arbitrage and optimization of utility-scale energy storage assets. These trends signal a move from passive power consumption to proactive, intelligent energy orchestration, ensuring data processing continuity for mission-critical AI.

Key Industry Challenge: Infrastructure interconnection queues and legacy grid constraints represent a primary challenge, creating significant bottlenecks for the deployment of large-scale renewable energy storage for AI data centers.

Significant structural challenges constrain market growth, led by grid-level and supply chain vulnerabilities. The lengthy grid interconnection queue for new storage assets remains a primary bottleneck, delaying projects for years. On the supply side, the volatile critical mineral supply chain, subject to geopolitical risks and regulations like REACH, creates uncertainty in the cost and availability of high-performance batteries.

At the facility level, managing the operational risk of large-scale battery energy storage systems, including sophisticated thermal management systems to prevent thermal runaway, adds complexity and cost. Furthermore, ensuring the cybersecurity of the battery management system is a critical, often underestimated, challenge that is vital for protecting both the asset and the data center it supports.

Explore Full Market Dynamics Analysis Request Free Sample

Renewable Energy Storage For Ai Data Centers Market Segmentation

The renewable energy storage for ai data centers industry research report provides comprehensive data including region-wise segment analysis, with forecasts and analysis for the period 2026-2030, as well as historical data from 2020-2024 for the following segments.

Market Segment by Technology
  • Lithium-ion battery storage
  • Flow battery storage
  • Hydrogen energy storage
  • Flywheel energy storage
  • Supercapacitor energy storage
Market Segment by End-user
  • Hyperscale data centers
  • Colocation data centers
  • Enterprise data centers
  • Edge data centers
Market Segment by Source
  • Solar energy storage systems
  • Wind energy storage systems
  • Hydropower-based storage
  • Others
Market Segment by Geography
North America
US, Canada, Mexico
APAC
China, India, Japan, South Korea, Australia, Indonesia
Europe
Germany, UK, France, Italy, The Netherlands, Spain
Middle East and Africa
Saudi Arabia, UAE, South Africa, Israel, Turkey
South America
Brazil, Argentina, Colombia

Technology Segment Analysis

The lithium-ion battery storage segment is estimated to witness significant growth during the forecast period.

Lithium-ion battery storage technology, particularly configurations using lithium-iron-phosphate batteries, underpins the renewable energy storage for AI data centers market, accounting for nearly 60% of deployments.

Procurement decisions are driven by superior energy density metrics and established manufacturing scale, which are critical for supporting the computational workload profiles of high-density server racks.

While initial capital outlay is a key consideration, operators are increasingly focused on total cost of ownership, factoring in battery cycling degradation and round-trip efficiency over the system's lifespan.

The implementation of battery management system analytics, compliant with ISO 50001 for energy management, is essential for optimizing state of charge monitoring and extending the operational life of these critical power assets, ensuring data processing continuity.

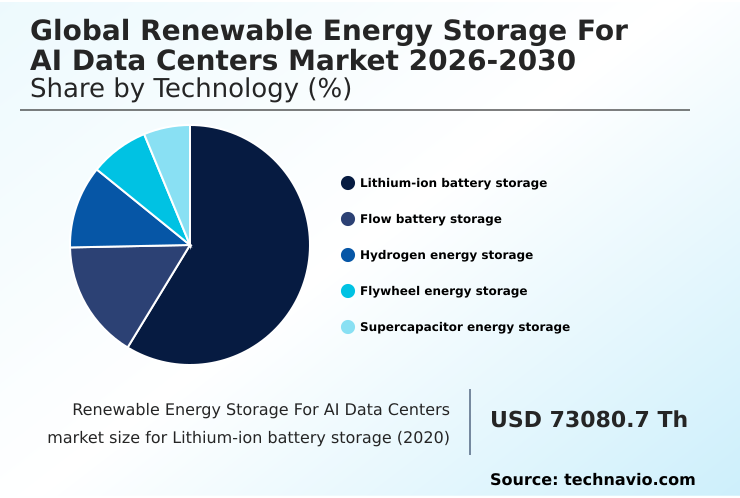
The Lithium-ion battery storage segment was valued at USD 112.65 million in 2024 and showed a gradual increase during the forecast period.

Renewable Energy Storage For Ai Data Centers Market by Region: North America Leads with 34.9% Growth Share

North America is estimated to contribute 34.9% to the growth of the global market during the forecast period.

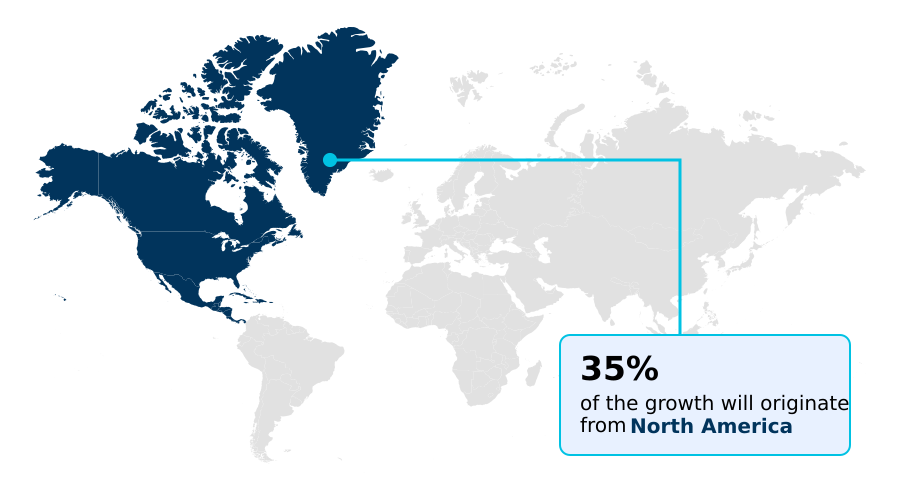
The geographic landscape of the renewable energy storage for AI data centers market is led by North America, which accounts for the largest share of incremental growth, driven by hyperscale data center energy demands and supportive policies like the US Inflation Reduction Act.

However, APAC is the fastest-growing region, with a projected growth rate over 21%, as nations like China and India rapidly build out digital infrastructure resilience.

In Europe, stringent regulations under the EU Green Deal compel colocation facility power providers to integrate localized power generation with storage to meet carbon-neutral mandates.

This regional divergence reflects different priorities, from pure scaling in APAC to grid harmonization and demand-side management in mature European markets, all converging on the need for robust energy infrastructure investment to power AI's future.

Customer Landscape Analysis for the Renewable Energy Storage For Ai Data Centers Market

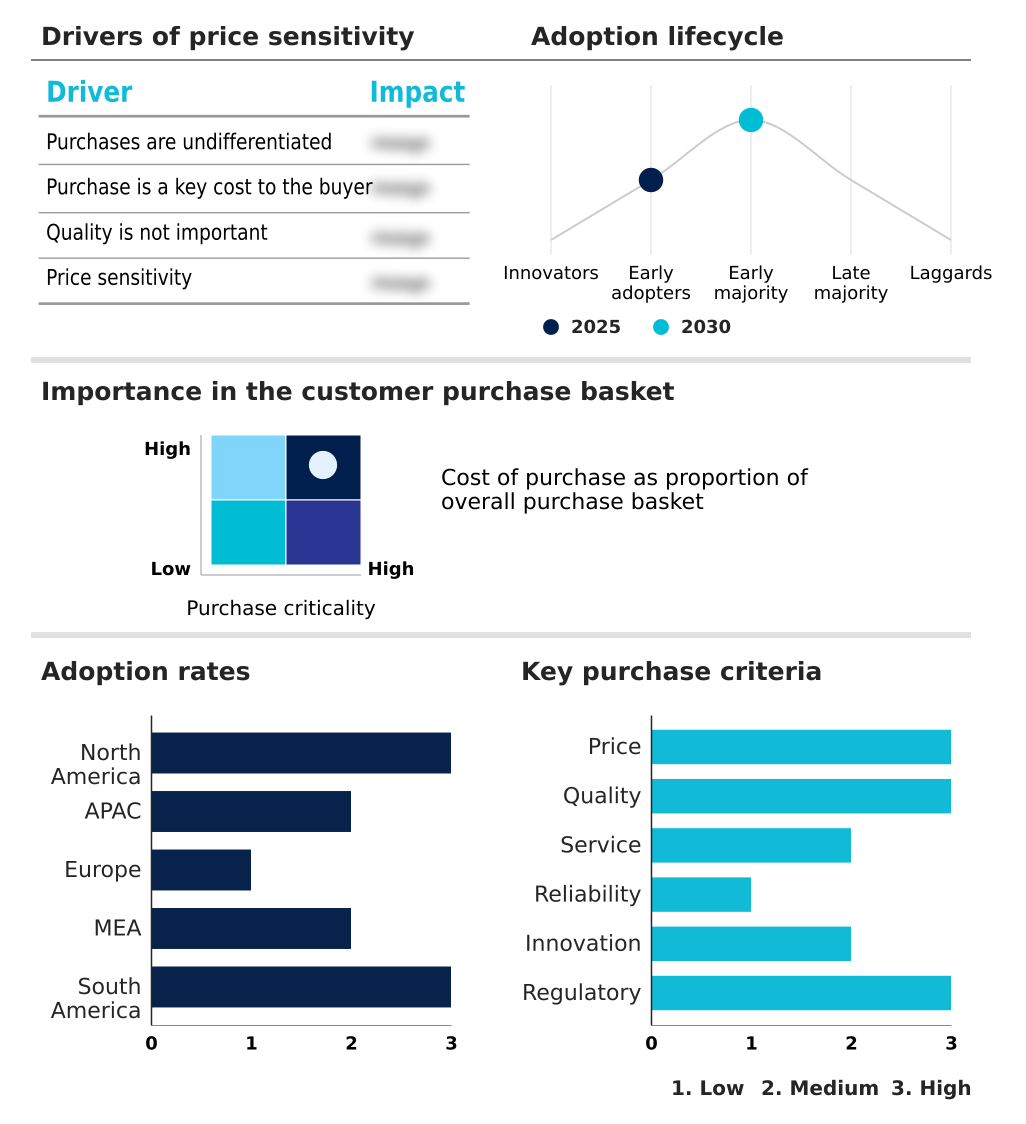
The renewable energy storage for ai data centers market forecasting report includes the adoption lifecycle of the market, covering from the innovator’s stage to the laggard’s stage. It focuses on adoption rates in different regions based on penetration. Furthermore, the renewable energy storage for ai data centers market report also includes key purchase criteria and drivers of price sensitivity to help companies evaluate and develop their market growth analysis strategies.

Competitive Landscape of the Renewable Energy Storage For Ai Data Centers Market

Companies are implementing various strategies, such as strategic alliances, partnerships, mergers and acquisitions, geographical expansion, and product/service launches, to enhance their presence in the renewable energy storage for ai data centers market industry.

ABB Ltd. - Key offerings include grid-interactive battery systems and intelligent software to ensure power quality and renewable energy reliability for critical AI data center infrastructure.

The industry research and growth report includes detailed analyses of the competitive landscape of the market and information about key companies, including:

  • ABB Ltd.
  • Bloom Energy Corp.
  • BYD Co. Ltd.
  • Contemporary Amperex Ltd.
  • Eaton Corp. Plc
  • Enel X Italia S.r.l.
  • Fluence Energy LLC
  • Generac Power Systems Inc.
  • Hitachi Energy Ltd.
  • Honeywell International Inc.
  • Johnson Controls International
  • LG Energy Solution Ltd.
  • Powin Inc.
  • Samsung Electronics Co. Ltd.
  • Schneider Electric SE
  • Siemens AG
  • Stem Inc.
  • Tesla Inc.
  • Vertiv Holdings Co.
  • Wartsila Corp.

Qualitative and quantitative analysis of companies has been conducted to help clients understand the wider business environment as well as the strengths and weaknesses of key industry players. Data is qualitatively analyzed to categorize companies as pure play, category-focused, industry-focused, and diversified; it is quantitatively analyzed to categorize companies as dominant, leading, strong, tentative, and weak.

Recent Developments in the Renewable Energy Storage For Ai Data Centers Market

  • In January 2025, Microsoft announced plans to invest USD 80 billion in AI-focused data centers designed to support its cloud platform and research partnerships, requiring extensive power infrastructure.
  • In January 2025, Invenergy and Meta Platforms Inc. entered into four agreements to supply 791 megawatts of new solar and wind energy, supported by storage, to power Meta's data center operations.
  • In December 2025, Alphabet Inc. announced an agreement to acquire Intersect Power for approximately USD 4.75 billion, aiming to expand the clean energy infrastructure needed to support Google's AI data centers.
  • In December 2025, Google partnered with NextEra Energy to develop gigawatt-scale AI data centers powered by dedicated clean energy generation and storage to meet rising electricity demand from advanced AI.

Research Analyst Overview: Renewable Energy Storage For Ai Data Centers Market

The renewable energy storage for AI data centers market is shifting from short-duration uninterruptible power supply to long-duration energy storage solutions capable of providing multi-hour grid independence. This evolution is a direct response to the massive, sustained energy draws of AI computational workload profiles.

Boardroom decisions on infrastructure CAPEX now weigh the high upfront cost of a vanadium redox flow battery against the lifecycle and thermal runaway prevention benefits over traditional lithium-iron-phosphate batteries. We see increasing adoption of direct current coupling to improve round-trip efficiency between solar arrays and the battery energy storage system.

A key consideration for operators is the ability of the power conversion system to provide ancillary grid services like grid frequency regulation, turning a cost center into a revenue stream.

As facilities grow, ensuring black start capability and integrating advanced battery management system software for state of charge monitoring becomes critical for ensuring resilience and meeting stringent service level agreements under frameworks like Uptime Institute's Tier classifications.

Dive into Technavio’s robust research methodology, blending expert interviews, extensive data synthesis, and validated models for unparalleled Renewable Energy Storage For Ai Data Centers Market insights. See full methodology.

Request Free Sample

Market Scope
Page number 318
Base year 2025
Historic period 2020-2024
Forecast period 2026-2030
Growth momentum & CAGR Accelerate at a CAGR of 20.2%
Market growth 2026-2030 USD 329845.0 thousand
Market structure Fragmented
YoY growth 2025-2026(%) 16.8%
Key countries US, Canada, Mexico, China, India, Japan, South Korea, Australia, Indonesia, Germany, UK, France, Italy, The Netherlands, Spain, Saudi Arabia, UAE, South Africa, Israel, Turkey, Brazil, Argentina and Colombia
Competitive landscape Leading Companies, Market Positioning of Companies, Competitive Strategies, and Industry Risks

Renewable Energy Storage For Ai Data Centers Market: Key Questions Answered in This Report

  • What is the expected growth of the Renewable Energy Storage For Ai Data Centers Market between 2026 and 2030?

    • The Renewable Energy Storage For Ai Data Centers Market is expected to grow by USD 329.85 million during 2026-2030, registering a CAGR of 20.2%. Year-over-year growth in 2026 is estimated at 16.8%%. This acceleration is shaped by exponential growth in computational demand, which is intensifying demand across multiple end-use verticals covered in the report.

  • What segmentation does the market report cover?

    • The report is segmented by Technology (Lithium-ion battery storage, Flow battery storage, Hydrogen energy storage, Flywheel energy storage, and Supercapacitor energy storage), End-user (Hyperscale data centers, Colocation data centers, Enterprise data centers, and Edge data centers), Source (Solar energy storage systems, Wind energy storage systems, Hydropower-based storage, and Others) and Geography (North America, APAC, Europe, Middle East and Africa, South America). Among these, the Lithium-ion battery storage segment is estimated to witness significant growth during the forecast period, driven by rising adoption across key application areas. Each segment includes detailed qualitative and quantitative analysis, along with historical data from 2020-2024 and forecasts through 2030 with year-over-year growth rates.

  • Which regions are analyzed in the report?

    • The report covers North America, APAC, Europe, Middle East and Africa and South America. North America is estimated to contribute 34.9% to market growth during the forecast period. Country-level analysis includes US, Canada, Mexico, China, India, Japan, South Korea, Australia, Indonesia, Germany, UK, France, Italy, The Netherlands, Spain, Saudi Arabia, UAE, South Africa, Israel, Turkey, Brazil, Argentina and Colombia, with dedicated market size tables and year-over-year growth for each.

  • What are the key growth drivers and market challenges?

    • The primary driver is exponential growth in computational demand, which is accelerating investment and industry demand. The main challenge is infrastructure interconnection and grid constraints, creating operational barriers for key market participants. The report quantifies the impact of each driver and challenge across 2026 and 2030 with comparative analysis.

  • Who are the major players in the Renewable Energy Storage For Ai Data Centers Market?

    • Key vendors include ABB Ltd., Bloom Energy Corp., BYD Co. Ltd., Contemporary Amperex Ltd., Eaton Corp. Plc, Enel X Italia S.r.l., Fluence Energy LLC, Generac Power Systems Inc., Hitachi Energy Ltd., Honeywell International Inc., Johnson Controls International, LG Energy Solution Ltd., Powin Inc., Samsung Electronics Co. Ltd., Schneider Electric SE, Siemens AG, Stem Inc., Tesla Inc., Vertiv Holdings Co. and Wartsila Corp.. The report provides qualitative and quantitative analysis categorizing companies as dominant, leading, strong, tentative, and weak based on their market positioning. Company profiles include business segment analysis, SWOT assessment, key offerings, and recent strategic developments.

Renewable Energy Storage For Ai Data Centers Market Research Insights

Market dynamics are increasingly shaped by sophisticated energy procurement agreements and the need to manage total cost of ownership over the lifecycle of power assets. In markets like North America and Europe, operators leverage power purchase agreements to secure long-term, fixed-price renewable energy, using on-site storage to manage intermittency.

This contrasts with strategies in APAC, where the focus is on rapid deployment of modular energy storage to overcome grid instability. Across all regions, the ability to participate in energy markets and provide grid stabilization services is transforming data center power architecture from a cost center into a revenue-generating asset.

Adherence to frameworks like the Greenhouse Gas Protocol for Scope 2 emissions reporting is a non-negotiable factor in procurement decisions, directly influencing the choice of storage technology and the design of the entire data center cooling infrastructure.

We can help! Our analysts can customize this renewable energy storage for ai data centers market research report to meet your requirements.

Get in touch

1. Executive Summary

1.1 Market overview

Executive Summary - Chart on Market Overview
Executive Summary - Data Table on Market Overview
Executive Summary - Chart on Global Market Characteristics
Executive Summary - Chart on Market by Geography
Executive Summary - Chart on Market Segmentation by Technology
Executive Summary - Chart on Market Segmentation by End-user
Executive Summary - Chart on Market Segmentation by Source
Executive Summary - Chart on Incremental Growth
Executive Summary - Data Table on Incremental Growth
Executive Summary - Chart on Company Market Positioning

2. Technavio Analysis

2.1 Analysis of price sensitivity, lifecycle, customer purchase basket, adoption rates, and purchase criteria

2.2 Criticality of inputs and Factors of differentiation

Chart on Overview on criticality of inputs and factors of differentiation

2.3 Factors of disruption

Chart on Overview on factors of disruption

2.4 Impact of drivers and challenges

Chart on Impact of drivers and challenges in 2025 and 2030

3. Market Landscape

3.1 Market ecosystem

Chart on Parent Market
Data Table on - Parent Market

3.2 Market characteristics

Chart on Market characteristics analysis

3.3 Value chain analysis

Chart on Value chain analysis

4. Market Sizing

4.1 Market definition

Data Table on Offerings of companies included in the market definition

4.2 Market segment analysis

Market segments

4.3 Market size 2025

4.4 Market outlook: Forecast for 2025-2030

Chart on Global - Market size and forecast 2025-2030 ($ thousand)
Data Table on Global - Market size and forecast 2025-2030 ($ thousand)
Chart on Global Market: Year-over-year growth 2025-2030 (%)
Data Table on Global Market: Year-over-year growth 2025-2030 (%)

5. Historic Market Size

5.1 Global Renewable Energy Storage For AI Data Centers Market 2020 - 2024

Historic Market Size - Data Table on Global Renewable Energy Storage For AI Data Centers Market 2020 - 2024 ($ thousand)

5.2 Technology segment analysis 2020 - 2024

Historic Market Size - Technology Segment 2020 - 2024 ($ thousand)

5.3 End-user segment analysis 2020 - 2024

Historic Market Size - End-user Segment 2020 - 2024 ($ thousand)

5.4 Source segment analysis 2020 - 2024

Historic Market Size - Source Segment 2020 - 2024 ($ thousand)

5.5 Geography segment analysis 2020 - 2024

Historic Market Size - Geography Segment 2020 - 2024 ($ thousand)

5.6 Country segment analysis 2020 - 2024

Historic Market Size - Country Segment 2020 - 2024 ($ thousand)

6. Qualitative Analysis

6.1 Impact of AI Global Renewable Energy Storage for AI Data Centers Market

6.2 Impact of Geopolitical Conflicts on Global Renewable Energy Storage for AI Data Centers Market

7. Five Forces Analysis

7.1 Five forces summary

Five forces analysis - Comparison between 2025 and 2030

7.2 Bargaining power of buyers

Bargaining power of buyers - Impact of key factors 2025 and 2030

7.3 Bargaining power of suppliers

Bargaining power of suppliers - Impact of key factors in 2025 and 2030

7.4 Threat of new entrants

Threat of new entrants - Impact of key factors in 2025 and 2030

7.5 Threat of substitutes

Threat of substitutes - Impact of key factors in 2025 and 2030

7.6 Threat of rivalry

Threat of rivalry - Impact of key factors in 2025 and 2030

7.7 Market condition

Chart on Market condition - Five forces 2025 and 2030

8. Market Segmentation by Technology

8.1 Market segments

Chart on Technology - Market share 2025-2030 (%)
Data Table on Technology - Market share 2025-2030 (%)

8.2 Comparison by Technology

Chart on Comparison by Technology
Data Table on Comparison by Technology

8.3 Lithium-ion battery storage - Market size and forecast 2025-2030

Chart on Lithium-ion battery storage - Market size and forecast 2025-2030 ($ thousand)
Data Table on Lithium-ion battery storage - Market size and forecast 2025-2030 ($ thousand)
Chart on Lithium-ion battery storage - Year-over-year growth 2025-2030 (%)
Data Table on Lithium-ion battery storage - Year-over-year growth 2025-2030 (%)

8.4 Flow battery storage - Market size and forecast 2025-2030

Chart on Flow battery storage - Market size and forecast 2025-2030 ($ thousand)
Data Table on Flow battery storage - Market size and forecast 2025-2030 ($ thousand)
Chart on Flow battery storage - Year-over-year growth 2025-2030 (%)
Data Table on Flow battery storage - Year-over-year growth 2025-2030 (%)

8.5 Hydrogen energy storage - Market size and forecast 2025-2030

Chart on Hydrogen energy storage - Market size and forecast 2025-2030 ($ thousand)
Data Table on Hydrogen energy storage - Market size and forecast 2025-2030 ($ thousand)
Chart on Hydrogen energy storage - Year-over-year growth 2025-2030 (%)
Data Table on Hydrogen energy storage - Year-over-year growth 2025-2030 (%)

8.6 Flywheel energy storage - Market size and forecast 2025-2030

Chart on Flywheel energy storage - Market size and forecast 2025-2030 ($ thousand)
Data Table on Flywheel energy storage - Market size and forecast 2025-2030 ($ thousand)
Chart on Flywheel energy storage - Year-over-year growth 2025-2030 (%)
Data Table on Flywheel energy storage - Year-over-year growth 2025-2030 (%)

8.7 Supercapacitor energy storage - Market size and forecast 2025-2030

Chart on Supercapacitor energy storage - Market size and forecast 2025-2030 ($ thousand)
Data Table on Supercapacitor energy storage - Market size and forecast 2025-2030 ($ thousand)
Chart on Supercapacitor energy storage - Year-over-year growth 2025-2030 (%)
Data Table on Supercapacitor energy storage - Year-over-year growth 2025-2030 (%)

8.8 Market opportunity by Technology

Market opportunity by Technology ($ thousand)
Data Table on Market opportunity by Technology ($ thousand)

9. Market Segmentation by End-user

9.1 Market segments

Chart on End-user - Market share 2025-2030 (%)
Data Table on End-user - Market share 2025-2030 (%)

9.2 Comparison by End-user

Chart on Comparison by End-user
Data Table on Comparison by End-user

9.3 Hyperscale data centers - Market size and forecast 2025-2030

Chart on Hyperscale data centers - Market size and forecast 2025-2030 ($ thousand)
Data Table on Hyperscale data centers - Market size and forecast 2025-2030 ($ thousand)
Chart on Hyperscale data centers - Year-over-year growth 2025-2030 (%)
Data Table on Hyperscale data centers - Year-over-year growth 2025-2030 (%)

9.4 Colocation data centers - Market size and forecast 2025-2030

Chart on Colocation data centers - Market size and forecast 2025-2030 ($ thousand)
Data Table on Colocation data centers - Market size and forecast 2025-2030 ($ thousand)
Chart on Colocation data centers - Year-over-year growth 2025-2030 (%)
Data Table on Colocation data centers - Year-over-year growth 2025-2030 (%)

9.5 Enterprise data centers - Market size and forecast 2025-2030

Chart on Enterprise data centers - Market size and forecast 2025-2030 ($ thousand)
Data Table on Enterprise data centers - Market size and forecast 2025-2030 ($ thousand)
Chart on Enterprise data centers - Year-over-year growth 2025-2030 (%)
Data Table on Enterprise data centers - Year-over-year growth 2025-2030 (%)

9.6 Edge data centers - Market size and forecast 2025-2030

Chart on Edge data centers - Market size and forecast 2025-2030 ($ thousand)
Data Table on Edge data centers - Market size and forecast 2025-2030 ($ thousand)
Chart on Edge data centers - Year-over-year growth 2025-2030 (%)
Data Table on Edge data centers - Year-over-year growth 2025-2030 (%)

9.7 Market opportunity by End-user

Market opportunity by End-user ($ thousand)
Data Table on Market opportunity by End-user ($ thousand)

10. Market Segmentation by Source

10.1 Market segments

Chart on Source - Market share 2025-2030 (%)
Data Table on Source - Market share 2025-2030 (%)

10.2 Comparison by Source

Chart on Comparison by Source
Data Table on Comparison by Source

10.3 Solar energy storage systems - Market size and forecast 2025-2030

Chart on Solar energy storage systems - Market size and forecast 2025-2030 ($ thousand)
Data Table on Solar energy storage systems - Market size and forecast 2025-2030 ($ thousand)
Chart on Solar energy storage systems - Year-over-year growth 2025-2030 (%)
Data Table on Solar energy storage systems - Year-over-year growth 2025-2030 (%)

10.4 Wind energy storage systems - Market size and forecast 2025-2030

Chart on Wind energy storage systems - Market size and forecast 2025-2030 ($ thousand)
Data Table on Wind energy storage systems - Market size and forecast 2025-2030 ($ thousand)
Chart on Wind energy storage systems - Year-over-year growth 2025-2030 (%)
Data Table on Wind energy storage systems - Year-over-year growth 2025-2030 (%)

10.5 Hydropower-based storage - Market size and forecast 2025-2030

Chart on Hydropower-based storage - Market size and forecast 2025-2030 ($ thousand)
Data Table on Hydropower-based storage - Market size and forecast 2025-2030 ($ thousand)
Chart on Hydropower-based storage - Year-over-year growth 2025-2030 (%)
Data Table on Hydropower-based storage - Year-over-year growth 2025-2030 (%)

10.6 Others - Market size and forecast 2025-2030

Chart on Others - Market size and forecast 2025-2030 ($ thousand)
Data Table on Others - Market size and forecast 2025-2030 ($ thousand)
Chart on Others - Year-over-year growth 2025-2030 (%)
Data Table on Others - Year-over-year growth 2025-2030 (%)

10.7 Market opportunity by Source

Market opportunity by Source ($ thousand)
Data Table on Market opportunity by Source ($ thousand)

11. Customer Landscape

11.1 Customer landscape overview

Analysis of price sensitivity, lifecycle, customer purchase basket, adoption rates, and purchase criteria

12. Geographic Landscape

12.1 Geographic segmentation

Chart on Market share by geography 2025-2030 (%)
Data Table on Market share by geography 2025-2030 (%)

12.2 Geographic comparison

Chart on Geographic comparison
Data Table on Geographic comparison

12.3 North America - Market size and forecast 2025-2030

Chart on North America - Market size and forecast 2025-2030 ($ thousand)
Data Table on North America - Market size and forecast 2025-2030 ($ thousand)
Chart on North America - Year-over-year growth 2025-2030 (%)
Data Table on North America - Year-over-year growth 2025-2030 (%)
Chart on Regional Comparison - North America
Data Table on Regional Comparison - North America

12.3.1 US - Market size and forecast 2025-2030

Chart on US - Market size and forecast 2025-2030 ($ thousand)
Data Table on US - Market size and forecast 2025-2030 ($ thousand)
Chart on US - Year-over-year growth 2025-2030 (%)
Data Table on US - Year-over-year growth 2025-2030 (%)

12.3.2 Canada - Market size and forecast 2025-2030

Chart on Canada - Market size and forecast 2025-2030 ($ thousand)
Data Table on Canada - Market size and forecast 2025-2030 ($ thousand)
Chart on Canada - Year-over-year growth 2025-2030 (%)
Data Table on Canada - Year-over-year growth 2025-2030 (%)

12.3.3 Mexico - Market size and forecast 2025-2030

Chart on Mexico - Market size and forecast 2025-2030 ($ thousand)
Data Table on Mexico - Market size and forecast 2025-2030 ($ thousand)
Chart on Mexico - Year-over-year growth 2025-2030 (%)
Data Table on Mexico - Year-over-year growth 2025-2030 (%)

12.4 APAC - Market size and forecast 2025-2030

Chart on APAC - Market size and forecast 2025-2030 ($ thousand)
Data Table on APAC - Market size and forecast 2025-2030 ($ thousand)
Chart on APAC - Year-over-year growth 2025-2030 (%)
Data Table on APAC - Year-over-year growth 2025-2030 (%)
Chart on Regional Comparison - APAC
Data Table on Regional Comparison - APAC

12.4.1 China - Market size and forecast 2025-2030

Chart on China - Market size and forecast 2025-2030 ($ thousand)
Data Table on China - Market size and forecast 2025-2030 ($ thousand)
Chart on China - Year-over-year growth 2025-2030 (%)
Data Table on China - Year-over-year growth 2025-2030 (%)

12.4.2 India - Market size and forecast 2025-2030

Chart on India - Market size and forecast 2025-2030 ($ thousand)
Data Table on India - Market size and forecast 2025-2030 ($ thousand)
Chart on India - Year-over-year growth 2025-2030 (%)
Data Table on India - Year-over-year growth 2025-2030 (%)

12.4.3 Japan - Market size and forecast 2025-2030

Chart on Japan - Market size and forecast 2025-2030 ($ thousand)
Data Table on Japan - Market size and forecast 2025-2030 ($ thousand)
Chart on Japan - Year-over-year growth 2025-2030 (%)
Data Table on Japan - Year-over-year growth 2025-2030 (%)

12.4.4 South Korea - Market size and forecast 2025-2030

Chart on South Korea - Market size and forecast 2025-2030 ($ thousand)
Data Table on South Korea - Market size and forecast 2025-2030 ($ thousand)
Chart on South Korea - Year-over-year growth 2025-2030 (%)
Data Table on South Korea - Year-over-year growth 2025-2030 (%)

12.4.5 Australia - Market size and forecast 2025-2030

Chart on Australia - Market size and forecast 2025-2030 ($ thousand)
Data Table on Australia - Market size and forecast 2025-2030 ($ thousand)
Chart on Australia - Year-over-year growth 2025-2030 (%)
Data Table on Australia - Year-over-year growth 2025-2030 (%)

12.4.6 Indonesia - Market size and forecast 2025-2030

Chart on Indonesia - Market size and forecast 2025-2030 ($ thousand)
Data Table on Indonesia - Market size and forecast 2025-2030 ($ thousand)
Chart on Indonesia - Year-over-year growth 2025-2030 (%)
Data Table on Indonesia - Year-over-year growth 2025-2030 (%)

12.5 Europe - Market size and forecast 2025-2030

Chart on Europe - Market size and forecast 2025-2030 ($ thousand)
Data Table on Europe - Market size and forecast 2025-2030 ($ thousand)
Chart on Europe - Year-over-year growth 2025-2030 (%)
Data Table on Europe - Year-over-year growth 2025-2030 (%)
Chart on Regional Comparison - Europe
Data Table on Regional Comparison - Europe

12.5.1 Germany - Market size and forecast 2025-2030

Chart on Germany - Market size and forecast 2025-2030 ($ thousand)
Data Table on Germany - Market size and forecast 2025-2030 ($ thousand)
Chart on Germany - Year-over-year growth 2025-2030 (%)
Data Table on Germany - Year-over-year growth 2025-2030 (%)

12.5.2 UK - Market size and forecast 2025-2030

Chart on UK - Market size and forecast 2025-2030 ($ thousand)
Data Table on UK - Market size and forecast 2025-2030 ($ thousand)
Chart on UK - Year-over-year growth 2025-2030 (%)
Data Table on UK - Year-over-year growth 2025-2030 (%)

12.5.3 France - Market size and forecast 2025-2030

Chart on France - Market size and forecast 2025-2030 ($ thousand)
Data Table on France - Market size and forecast 2025-2030 ($ thousand)
Chart on France - Year-over-year growth 2025-2030 (%)
Data Table on France - Year-over-year growth 2025-2030 (%)

12.5.4 Italy - Market size and forecast 2025-2030

Chart on Italy - Market size and forecast 2025-2030 ($ thousand)
Data Table on Italy - Market size and forecast 2025-2030 ($ thousand)
Chart on Italy - Year-over-year growth 2025-2030 (%)
Data Table on Italy - Year-over-year growth 2025-2030 (%)

12.5.5 The Netherlands - Market size and forecast 2025-2030

Chart on The Netherlands - Market size and forecast 2025-2030 ($ thousand)
Data Table on The Netherlands - Market size and forecast 2025-2030 ($ thousand)
Chart on The Netherlands - Year-over-year growth 2025-2030 (%)
Data Table on The Netherlands - Year-over-year growth 2025-2030 (%)

12.5.6 Spain - Market size and forecast 2025-2030

Chart on Spain - Market size and forecast 2025-2030 ($ thousand)
Data Table on Spain - Market size and forecast 2025-2030 ($ thousand)
Chart on Spain - Year-over-year growth 2025-2030 (%)
Data Table on Spain - Year-over-year growth 2025-2030 (%)

12.6 Middle East and Africa - Market size and forecast 2025-2030

Chart on Middle East and Africa - Market size and forecast 2025-2030 ($ thousand)
Data Table on Middle East and Africa - Market size and forecast 2025-2030 ($ thousand)
Chart on Middle East and Africa - Year-over-year growth 2025-2030 (%)
Data Table on Middle East and Africa - Year-over-year growth 2025-2030 (%)
Chart on Regional Comparison - Middle East and Africa
Data Table on Regional Comparison - Middle East and Africa

12.6.1 Saudi Arabia - Market size and forecast 2025-2030

Chart on Saudi Arabia - Market size and forecast 2025-2030 ($ thousand)
Data Table on Saudi Arabia - Market size and forecast 2025-2030 ($ thousand)
Chart on Saudi Arabia - Year-over-year growth 2025-2030 (%)
Data Table on Saudi Arabia - Year-over-year growth 2025-2030 (%)

12.6.2 UAE - Market size and forecast 2025-2030

Chart on UAE - Market size and forecast 2025-2030 ($ thousand)
Data Table on UAE - Market size and forecast 2025-2030 ($ thousand)
Chart on UAE - Year-over-year growth 2025-2030 (%)
Data Table on UAE - Year-over-year growth 2025-2030 (%)

12.6.3 South Africa - Market size and forecast 2025-2030

Chart on South Africa - Market size and forecast 2025-2030 ($ thousand)
Data Table on South Africa - Market size and forecast 2025-2030 ($ thousand)
Chart on South Africa - Year-over-year growth 2025-2030 (%)
Data Table on South Africa - Year-over-year growth 2025-2030 (%)

12.6.4 Israel - Market size and forecast 2025-2030

Chart on Israel - Market size and forecast 2025-2030 ($ thousand)
Data Table on Israel - Market size and forecast 2025-2030 ($ thousand)
Chart on Israel - Year-over-year growth 2025-2030 (%)
Data Table on Israel - Year-over-year growth 2025-2030 (%)

12.6.5 Turkey - Market size and forecast 2025-2030

Chart on Turkey - Market size and forecast 2025-2030 ($ thousand)
Data Table on Turkey - Market size and forecast 2025-2030 ($ thousand)
Chart on Turkey - Year-over-year growth 2025-2030 (%)
Data Table on Turkey - Year-over-year growth 2025-2030 (%)

12.7 South America - Market size and forecast 2025-2030

Chart on South America - Market size and forecast 2025-2030 ($ thousand)
Data Table on South America - Market size and forecast 2025-2030 ($ thousand)
Chart on South America - Year-over-year growth 2025-2030 (%)
Data Table on South America - Year-over-year growth 2025-2030 (%)
Chart on Regional Comparison - South America
Data Table on Regional Comparison - South America

12.7.1 Brazil - Market size and forecast 2025-2030

Chart on Brazil - Market size and forecast 2025-2030 ($ thousand)
Data Table on Brazil - Market size and forecast 2025-2030 ($ thousand)
Chart on Brazil - Year-over-year growth 2025-2030 (%)
Data Table on Brazil - Year-over-year growth 2025-2030 (%)

12.7.2 Argentina - Market size and forecast 2025-2030

Chart on Argentina - Market size and forecast 2025-2030 ($ thousand)
Data Table on Argentina - Market size and forecast 2025-2030 ($ thousand)
Chart on Argentina - Year-over-year growth 2025-2030 (%)
Data Table on Argentina - Year-over-year growth 2025-2030 (%)

12.7.3 Colombia - Market size and forecast 2025-2030

Chart on Colombia - Market size and forecast 2025-2030 ($ thousand)
Data Table on Colombia - Market size and forecast 2025-2030 ($ thousand)
Chart on Colombia - Year-over-year growth 2025-2030 (%)
Data Table on Colombia - Year-over-year growth 2025-2030 (%)

12.8 Market opportunity by geography

Market opportunity by geography ($ thousand)
Data Tables on Market opportunity by geography ($ thousand)

13. Drivers, Challenges, and Opportunity

13.1 Market drivers

Exponential growth in computational demand
Regulatory mandates and decarbonization targets
Advancements in energy density and grid interaction

13.2 Market challenges

Infrastructure interconnection and grid constraints
Supply chain volatility and raw material scarcity
Technological complexity and long-term operational risks

13.3 Impact of drivers and challenges

Impact of drivers and challenges in 2025 and 2030

13.4 Market opportunities

Integration of microgrid architectures for autonomous data center resilience
Adoption of circular economy principles in battery lifecycle management
AI-driven energy orchestration and predictive load balancing

14. Competitive Landscape

14.1 Overview

14.2

Overview on criticality of inputs and factors of differentiation

14.3 Landscape disruption

Overview on factors of disruption

14.4 Industry risks

Impact of key risks on business

15. Competitive Analysis

15.1 Companies profiled

Companies covered

15.2 Company ranking index

15.3 Market positioning of companies

Matrix on companies position and classification

15.4 ABB Ltd.

ABB Ltd. - Overview
ABB Ltd. - Business segments
ABB Ltd. - Key news
ABB Ltd. - Key offerings
ABB Ltd. - Segment focus
SWOT

15.5 Bloom Energy Corp.

Bloom Energy Corp. - Overview
Bloom Energy Corp. - Product / Service
Bloom Energy Corp. - Key offerings
SWOT

15.6 BYD Co. Ltd.

BYD Co. Ltd. - Overview
BYD Co. Ltd. - Business segments
BYD Co. Ltd. - Key news
BYD Co. Ltd. - Key offerings
BYD Co. Ltd. - Segment focus
SWOT

15.7 Contemporary Amperex Ltd.

Contemporary Amperex Ltd. - Overview
Contemporary Amperex Ltd. - Business segments
Contemporary Amperex Ltd. - Key news
Contemporary Amperex Ltd. - Key offerings
Contemporary Amperex Ltd. - Segment focus
SWOT

15.8 Eaton Corp. Plc

Eaton Corp. Plc - Overview
Eaton Corp. Plc - Business segments
Eaton Corp. Plc - Key news
Eaton Corp. Plc - Key offerings
Eaton Corp. Plc - Segment focus
SWOT

15.9 Enel X Italia S.r.l.

Enel X Italia S.r.l. - Overview
Enel X Italia S.r.l. - Product / Service
Enel X Italia S.r.l. - Key offerings
SWOT

15.10 Fluence Energy LLC

Fluence Energy LLC - Overview
Fluence Energy LLC - Product / Service
Fluence Energy LLC - Key offerings
SWOT

15.11 Hitachi Energy Ltd.

Hitachi Energy Ltd. - Overview
Hitachi Energy Ltd. - Product / Service
Hitachi Energy Ltd. - Key offerings
SWOT

15.12 LG Energy Solution Ltd.

LG Energy Solution Ltd. - Overview
LG Energy Solution Ltd. - Product / Service
LG Energy Solution Ltd. - Key offerings
SWOT

15.13 Powin Inc.

Powin Inc. - Overview
Powin Inc. - Product / Service
Powin Inc. - Key offerings
SWOT

15.14 Schneider Electric SE

Schneider Electric SE - Overview
Schneider Electric SE - Business segments
Schneider Electric SE - Key news
Schneider Electric SE - Key offerings
Schneider Electric SE - Segment focus
SWOT

15.15 Siemens AG

Siemens AG - Overview
Siemens AG - Business segments
Siemens AG - Key news
Siemens AG - Key offerings
Siemens AG - Segment focus
SWOT

15.16 Tesla Inc.

Tesla Inc. - Overview
Tesla Inc. - Business segments
Tesla Inc. - Key news
Tesla Inc. - Key offerings
Tesla Inc. - Segment focus
SWOT

15.17 Vertiv Holdings Co.

Vertiv Holdings Co. - Overview
Vertiv Holdings Co. - Business segments
Vertiv Holdings Co. - Key offerings
Vertiv Holdings Co. - Segment focus
SWOT

15.18 Wartsila Corp.

Wartsila Corp. - Overview
Wartsila Corp. - Business segments
Wartsila Corp. - Key news
Wartsila Corp. - Key offerings
Wartsila Corp. - Segment focus
SWOT

16. Appendix

16.1 Scope of the report

Market definition
Objectives
Notes and caveats

16.2 Inclusions and exclusions checklist

Inclusions checklist
Exclusions checklist

16.3 Currency conversion rates for US$

16.4 Research methodology

16.5 Data procurement

Information sources

16.6 Data validation

16.7 Validation techniques employed for market sizing

16.8 Data synthesis

16.9 360 degree market analysis

16.10 List of abbreviations

Research Methodology

Technavio presents a detailed picture of the market by way of study, synthesis, and summation of data from multiple sources. The analysts have presented the various facets of the market with a particular focus on identifying the key industry influencers. The data thus presented is comprehensive, reliable, and the result of extensive research, both primary and secondary.

INFORMATION SOURCES

Primary sources

  • Manufacturers and suppliers
  • Channel partners
  • Industry experts
  • Strategic decision makers

Secondary sources

  • Industry journals and periodicals
  • Government data
  • Financial reports of key industry players
  • Historical data
  • Press releases

DATA ANALYSIS

Data Synthesis

  • Collation of data
  • Estimation of key figures
  • Analysis of derived insights

Data Validation

  • Triangulation with data models
  • Reference against proprietary databases
  • Corroboration with industry experts

REPORT WRITING

Qualitative

  • Market drivers
  • Market challenges
  • Market trends
  • Five forces analysis

Quantitative

  • Market size and forecast
  • Market segmentation
  • Geographical insights
  • Competitive landscape

Interested in this report?

Get your sample now to see our research methodology and insights!

Download Now

Frequently Asked Questions

Renewable Energy Storage For Ai Data Centers market growth will increase by USD 329845.0 thousand thousand during 2026-2030.

The Renewable Energy Storage For Ai Data Centers market is expected to grow at a CAGR of 20.2% during 2026-2030.

Renewable Energy Storage For Ai Data Centers market is segmented by Technology (Lithium-ion battery storage, Flow battery storage, Hydrogen energy storage, Flywheel energy storage, Supercapacitor energy storage) End-user (Hyperscale data centers, Colocation data centers, Enterprise data centers, Edge data centers) Source (Solar energy storage systems, Wind energy storage systems, Hydropower-based storage, Others)

ABB Ltd., Bloom Energy Corp., BYD Co. Ltd., Contemporary Amperex Ltd., Eaton Corp. Plc, Enel X Italia S.r.l., Fluence Energy LLC, Generac Power Systems Inc., Hitachi Energy Ltd., Honeywell International Inc., Johnson Controls International, LG Energy Solution Ltd., Powin Inc., Samsung Electronics Co. Ltd., Schneider Electric SE, Siemens AG, Stem Inc., Tesla Inc., Vertiv Holdings Co., Wartsila Corp. are a few of the key vendors in the Renewable Energy Storage For Ai Data Centers market.

North America will register the highest growth rate of 34.9% among the other regions. Therefore, the Renewable Energy Storage For Ai Data Centers market in North America is expected to garner significant business opportunities for the vendors during the forecast period.

US, Canada, Mexico, China, India, Japan, South Korea, Australia, Indonesia, Germany, UK, France, Italy, The Netherlands, Spain, Saudi Arabia, UAE, South Africa, Israel, Turkey, Brazil, Argentina, Colombia

  • Exponential growth in computational demand is the driving factor this market.

The Renewable Energy Storage For Ai Data Centers market vendors should focus on grabbing business opportunities from the Technology segment as it accounted for the largest market share in the base year.
RIA - Research AI Assistant
Ask RIA