Renewable Distributed Energy Generation (RDEG) Technologies Market Analysis, Size, and Forecast 2026-2030: APAC (China, India, and Japan), Europe (Germany, UK, and France), North America (US, Canada, and Mexico), South America (Brazil and Argentina), Middle East and Africa (South Africa, Saudi Arabia, and UAE), and Rest of World (ROW)

Renewable Distributed Energy Generation (RDEG) Technologies Market Analysis, Size, and Forecast 2026-2030:
APAC (China, India, and Japan), Europe (Germany, UK, and France), North America (US, Canada, and Mexico), South America (Brazil and Argentina), Middle East and Africa (South Africa, Saudi Arabia, and UAE), and Rest of World (ROW)

Published: May 2026 301 Pages SKU: IRTNTR73568

Market Overview at a Glance

$189.78 Mn
Market Opportunity
11.7%
CAGR 2025 - 2030
54.2%
APAC Growth
$141.97 Mn
Solar PV segment 2024

Renewable Distributed Energy Generation (RDEG) Technologies Market Size 2026-2030

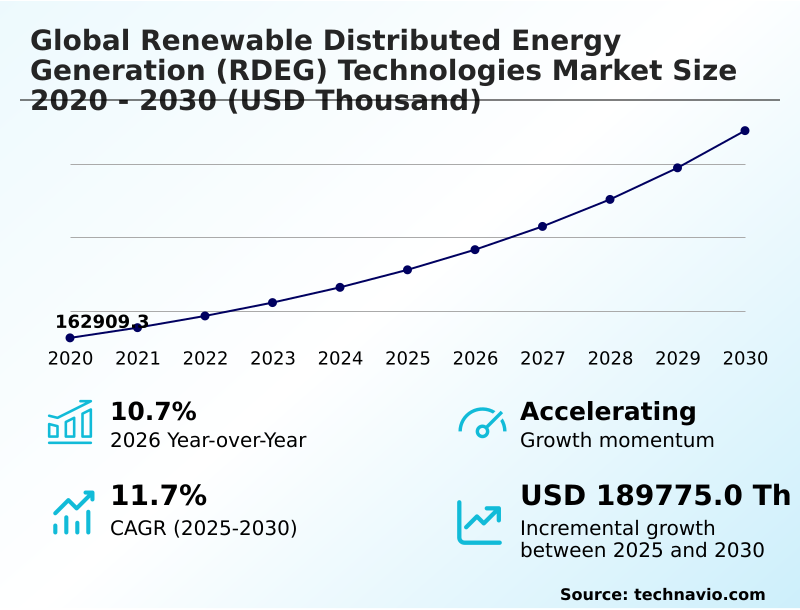
The Renewable Distributed Energy Generation (RDEG) Technologies Market size was valued at USD 255.71 million in 2025, growing at a CAGR of 11.7% during the forecast period 2026-2030.

Major Market Trends & Insights

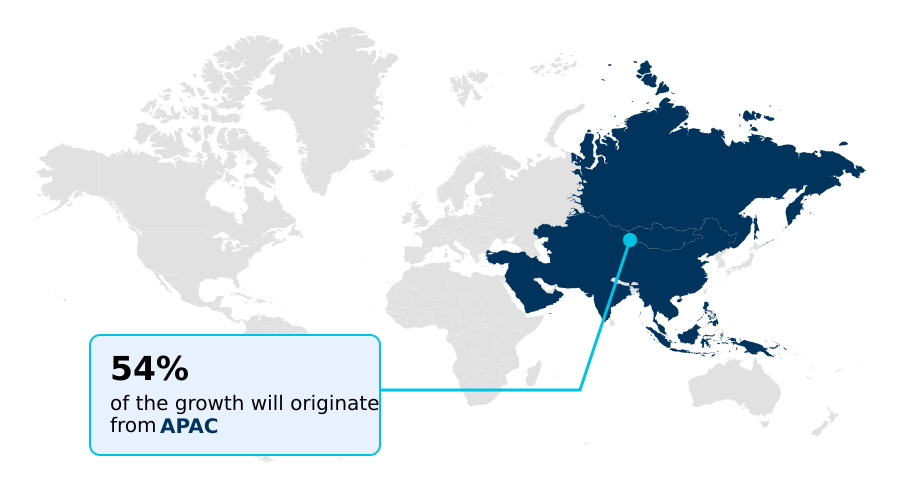
  • APAC dominated the market and accounted for a 54.2% growth during the forecast period.
  • By Technology - Solar PV segment was valued at USD 141.97 million in 2024
  • By Connectivity - On-grid systems segment accounted for the largest market revenue share in 2024

Market Size & Forecast

  • Historic Market Opportunities 2020-2024:
  • Market Future Opportunities 2025-2030: USD 189.78 million
  • CAGR from 2025 to 2030 : 11.7%

Market Summary

  • The renewable distributed energy generation (rdeg) technologies market is undergoing accelerated expansion, fundamentally reshaping energy systems with a projected 11.7% growth. This maturation is driven by a strategic pivot towards energy security, where a business might deploy a solar-plus-storage microgrid to ensure 99.9% uptime for critical manufacturing operations, insulating them from grid failures.
  • The market's impetus is broadening from purely economic considerations to include strategic imperatives; for instance, the integration of energy management systems (ems) can optimize energy flows, reducing operational costs by over 15%. A primary driver is the global mandate for decarbonization, fostering supportive regulatory environments.
  • However, a significant challenge remains the technical difficulty of integrating a vast number of decentralized power sources into legacy grid infrastructure, which can limit hosting capacity and require substantial investment in grid modernization.

What will be the Size of the Renewable Distributed Energy Generation (RDEG) Technologies Market during the forecast period?

Get Key Insights on Market Forecast (PDF) Request Free Sample

How is the Renewable Distributed Energy Generation (RDEG) Technologies Market Segmented?

The renewable distributed energy generation (rdeg) technologies industry research report provides comprehensive data (region-wise segment analysis), with forecasts and analysis for the period 2026-2030, as well as historical data from 2020-2024 for the following segments.
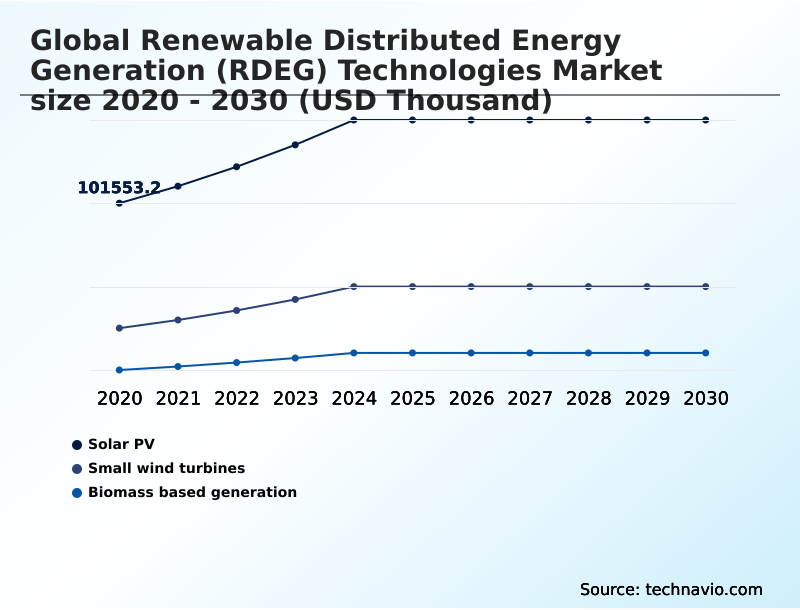
  • Technology
    • Solar PV
    • Small wind turbines
    • Biomass based generation
  • Connectivity
    • On-grid systems
    • Off-grid systems
    • Hybrid
  • Application
    • Commercial
    • Industrial
    • Residential
  • Geography
    • APAC
      • China
      • India
      • Japan
    • Europe
      • Germany
      • UK
      • France
    • North America
      • US
      • Canada
      • Mexico
    • South America
      • Brazil
      • Argentina
    • Middle East and Africa
      • South Africa
      • Saudi Arabia
      • UAE
    • Rest of World (ROW)

How is the Renewable Distributed Energy Generation (RDEG) Technologies Market Segmented by Technology?

The solar pv segment is estimated to witness significant growth during the forecast period.

The solar PV segment, which represents over 60% of new capacity, is pivotal to the renewable distributed energy generation (rdeg) technologies market, driven by falling production costs and advancing technological efficiencies.

This segment, covering everything from residential rooftops to large-scale commercial installations, is seeing a significant shift with the integration of energy storage systems, which improves asset value by over 15% through enhanced self-consumption.

Innovations in smart inverters and energy management systems are crucial for managing dispatchable power.

The market expansion relies on supportive regulatory frameworks like net metering and renewable portfolio standards that encourage adoption by both consumers and corporations, enhancing grid stability and energy security.

Request Free Sample

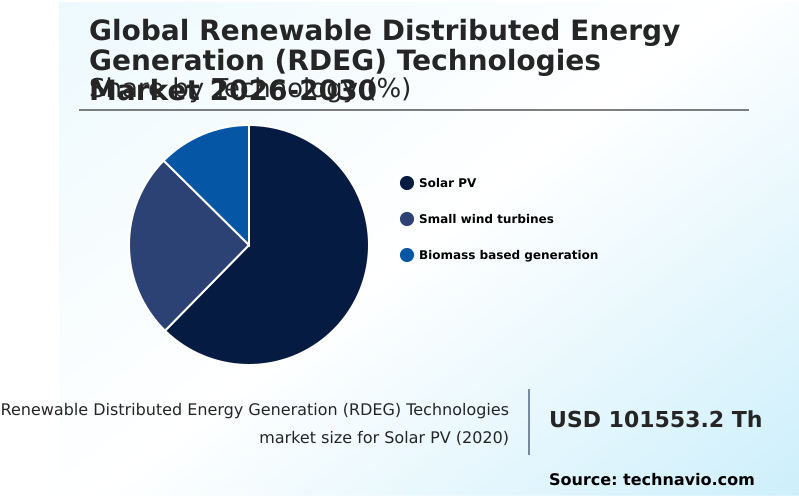
The Solar PV segment was valued at USD 141.97 million in 2024 and showed a gradual increase during the forecast period.

Request Free Sample

How demand for the Renewable Distributed Energy Generation (RDEG) Technologies market is rising in the leading region?

APAC is estimated to contribute 54.2% to the growth of the global market during the forecast period.Technavio’s analysts have elaborately explained the regional trends and drivers that shape the market during the forecast period.

See How Renewable Distributed Energy Generation (RDEG) Technologies Market demand is rising in APAC Request Free Sample

The global landscape for renewable distributed energy generation (rdeg) technologies is led by APAC, which accounts for 54.2% of the market's incremental growth, significantly outpacing Europe's 23.9%.

This dominance is fueled by countries like China, which is expanding its distributed solar capacity, and India, with initiatives aiming to install rooftop systems on millions of households.

In contrast, North America's market, representing 12.6% of growth, is driven by state-level renewable portfolio standards and a strong focus on grid resilience and energy security.

Regional differences in adoption are heavily influenced by regulatory support, such as feed-in tariffs in Europe versus tax incentives in the US, and the maturity of grid modernization efforts to manage demand-side flexibility.

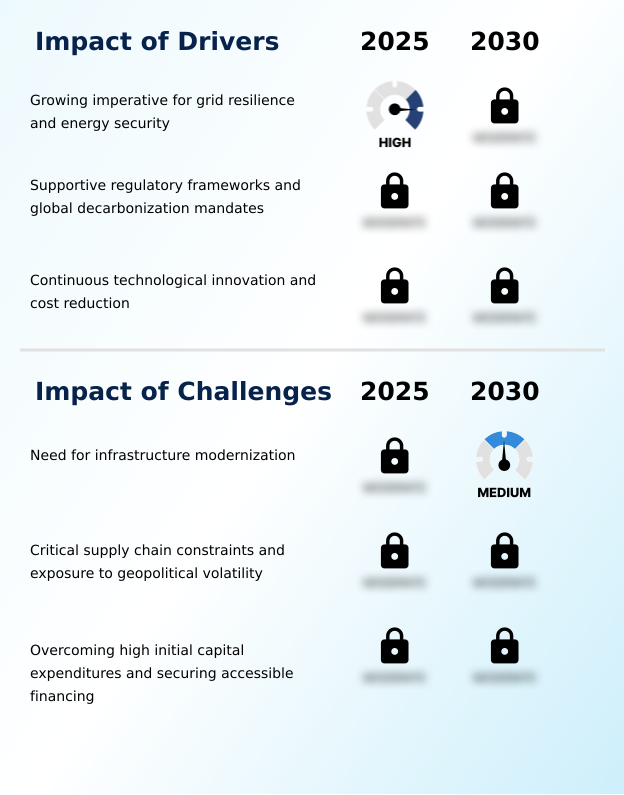
What are the key Drivers, Trends, and Challenges in the Renewable Distributed Energy Generation (RDEG) Technologies Market?

Our researchers analyzed the data with 2025 as the base year, along with the key drivers, trends, and challenges. A holistic analysis of drivers will help companies refine their marketing strategies to gain a competitive advantage.

  • Exploring renewable distributed energy generation technologies applications reveals a shift from simple grid-tied systems to complex, resilient microgrid solutions for commercial industrial facilities. The benefits of integrating solar PV with battery storage are increasingly evident, with analyses showing a more than 15% improvement in energy self-sufficiency and a significant reduction in exposure to grid volatility.
  • This synergy is crucial for businesses seeking to optimize their energy strategy. Furthermore, the impact of V2G on renewable energy systems is a transformative trend, turning electric vehicle fleets into distributed energy assets that enhance grid stability and provide ancillary services, with some projections indicating a potential 10% reduction in peak load stress on local distribution networks.
  • For regions lacking robust infrastructure, off-grid solar systems for rural electrification are proving to be the most cost-effective path to energy access, leapfrogging traditional grid extension.
  • However, the industry still grapples with the challenges of integrating rdeg into legacy grids, a complex issue that requires substantial investment in grid modernization to overcome technical hurdles like limited hosting capacity and reverse power flow, ensuring the continued growth and reliability of decentralized power.

What are the key market drivers leading to the rise in the adoption of Renewable Distributed Energy Generation (RDEG) Technologies Industry?

  • The growing imperative for enhanced grid resilience and energy security is a key driver for the market.

  • The escalating need for grid resilience is a primary driver for the renewable distributed energy generation (rdeg) technologies market, with microgrids demonstrating the ability to reduce outage durations by over 90% for critical facilities.
  • This imperative for energy security, amplified by extreme weather events and geopolitical volatility, is accelerating the adoption of decentralized systems like solar PV and energy storage systems.
  • Supportive regulatory frameworks, including renewable portfolio standards and streamlined net metering policies, have been shown to boost deployment rates by 40% in some regions.
  • Simultaneously, continuous technological innovation and cost reductions, particularly a dramatic decline in the levelized cost of energy for solar, make on-grid systems and hybrid systems economically compelling alternatives to traditional power sources.

What are the market trends shaping the Renewable Distributed Energy Generation (RDEG) Technologies Industry?

  • The convergence of renewable distributed energy generation with advanced energy storage and digitalization is fundamentally reshaping the market. This synergy transforms standalone assets into comprehensive, intelligent energy solutions.

  • A predominant trend in renewable distributed energy generation (rdeg) technologies is the deep integration with advanced energy storage and digitalization, which can increase system efficiency by up to 20%. This convergence is creating intelligent, dispatchable power solutions that provide critical ancillary services to the grid.
  • The proliferation of prosumer-centric models and community-based business models, including peer-to-peer energy trading platforms, is democratizing energy access, expanding the market addressable by over 30%. Furthermore, increasing sector coupling with transportation and heating through the electrification of end-use applications creates powerful symbiotic relationships, enhancing the systemic value of distributed assets and driving demand-side flexibility.

What challenges does the Renewable Distributed Energy Generation (RDEG) Technologies Industry face during its growth?

  • The need for comprehensive infrastructure modernization to accommodate bidirectional energy flows presents a key challenge to industry growth.

  • A paramount challenge constraining the renewable distributed energy generation (rdeg) technologies market is the technical difficulty of grid integration, where high penetration can lead to reverse power flow issues and require grid upgrades costing 15-20% of the total project value. The legacy grid's limited hosting capacity acts as a significant bottleneck.
  • A second formidable challenge involves critical supply chain constraints and exposure to geopolitical volatility, with over 80% of key components like smart inverters and battery cells concentrated in a few geographic regions. This raw material sourcing risk, coupled with high initial capital expenditure and difficulties in securing accessible financing for smaller projects, impedes faster market expansion despite favorable long-term economics.

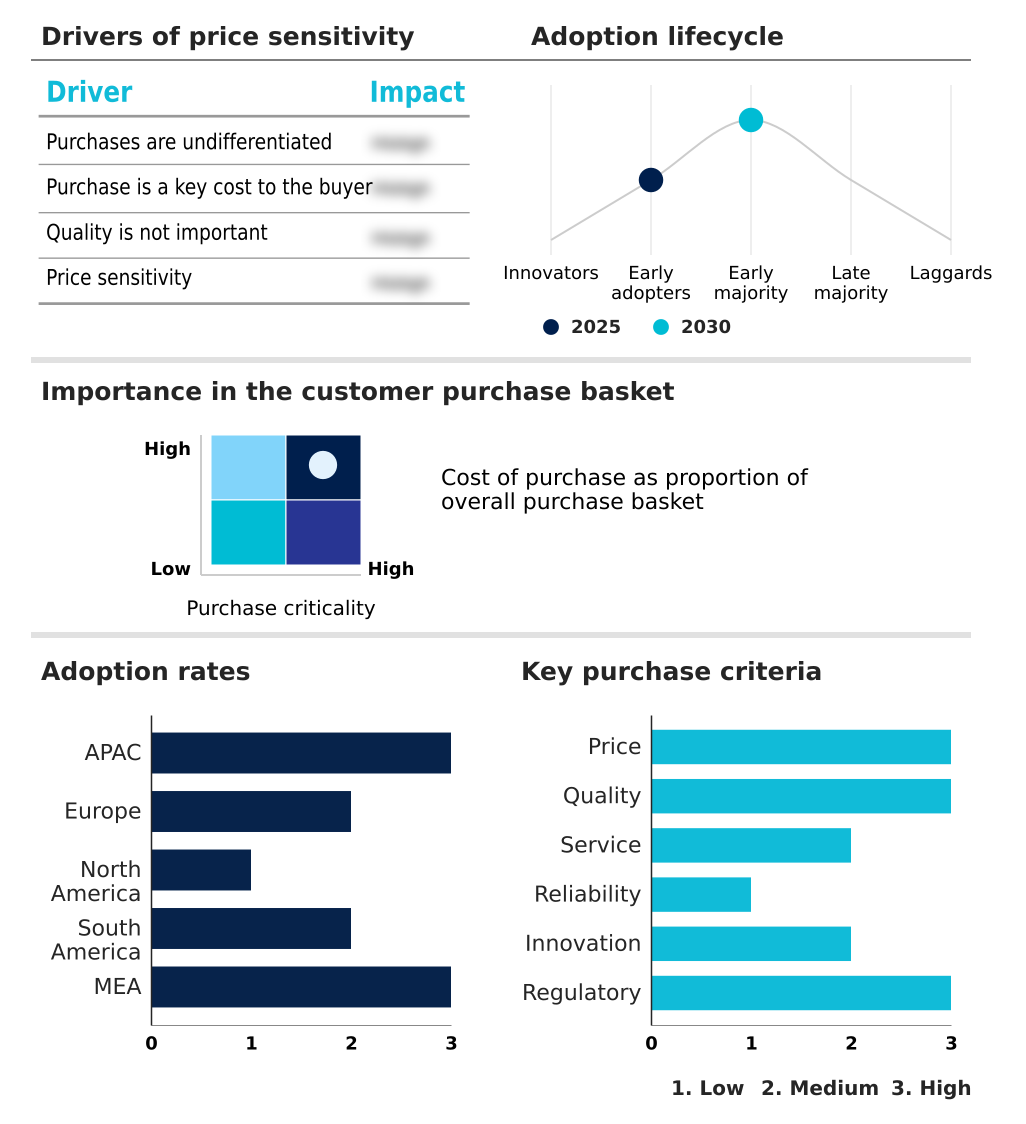
Exclusive Technavio Analysis on Customer Landscape

The renewable distributed energy generation (rdeg) technologies market forecasting report includes the adoption lifecycle of the market, covering from the innovator’s stage to the laggard’s stage. It focuses on adoption rates in different regions based on penetration. Furthermore, the renewable distributed energy generation (rdeg) technologies market report also includes key purchase criteria and drivers of price sensitivity to help companies evaluate and develop their market growth analysis strategies.

Customer Landscape of Renewable Distributed Energy Generation (RDEG) Technologies Industry

Competitive Landscape

Companies are implementing various strategies, such as strategic alliances, renewable distributed energy generation (rdeg) technologies market forecast, partnerships, mergers and acquisitions, geographical expansion, and product/service launches, to enhance their presence in the industry.

Bloom Energy Corp. - Key offerings focus on integrated solutions, including solid oxide fuel cells, microgrids, and carbon capture technology, designed to enhance on-site power generation and efficiency.

The industry research and growth report includes detailed analyses of the competitive landscape of the market and information about key companies, including:

  • Bloom Energy Corp.
  • BYD Co. Ltd.
  • Canadian Solar Inc.
  • Caterpillar Inc.
  • Enphase Energy Inc.
  • Envision Group
  • First Solar Inc.
  • FuelCell Energy Inc.
  • General Electric Co.
  • Huawei Technologies Co. Ltd.
  • JinkoSolar Holding Co. Ltd.
  • Kingspan Group Plc
  • LONGi Green Energy Co. Ltd.
  • Northern Power Systems
  • Schneider Electric SE
  • Siemens AG
  • SolarEdge Technologies Inc.
  • Tesla Inc.
  • Trina Solar Co. Ltd.

Qualitative and quantitative analysis of companies has been conducted to help clients understand the wider business environment as well as the strengths and weaknesses of key industry players. Data is qualitatively analyzed to categorize companies as pure play, category-focused, industry-focused, and diversified; it is quantitatively analyzed to categorize companies as dominant, leading, strong, tentative, and weak.

Market Intelligence Radar: High-Impact Developments & Growth Signals

  • In the Renewable Electricity industry, supportive government policies and ambitious renewable power targets have created a surge in demand for market-based approaches like feed-in tariffs and renewable portfolio standards, directly expanding the market for grid-tied renewable distributed energy generation (rdeg) technologies.
  • A persistent decline in the levelized cost of energy for renewable technologies, driven by economies of scale in manufacturing and technological efficiencies, has made renewable distributed energy generation (rdeg) technologies economically competitive with conventional power, accelerating adoption for on-site self-consumption.
  • The global push to decarbonize and address environmental concerns is driving a fundamental shift in the energy mix away from fossil fuels, creating sustained demand for renewable distributed energy generation (rdeg) technologies as a primary tool for achieving national climate goals and ensuring grid stability.
  • Widespread grid modernization initiatives, including the deployment of smart grid solutions and advanced distribution management systems, are being undertaken to manage the technical challenges of grid integration and reverse power flow from high penetrations of renewable distributed energy generation (rdeg) technologies.

Dive into Technavio’s robust research methodology, blending expert interviews, extensive data synthesis, and validated models for unparalleled Renewable Distributed Energy Generation (RDEG) Technologies Market insights. See full methodology.

Market Scope
Page number 301
Base year 2025
Historic period 2020-2024
Forecast period 2026-2030
Growth momentum & CAGR Accelerate at a CAGR of 11.7%
Market growth 2026-2030 USD 189775.0 thousand
Market structure Fragmented
YoY growth 2025-2026(%) 10.7%
Key countries China, India, Japan, Australia, South Korea, Indonesia, Germany, UK, France, Italy, The Netherlands, Spain, US, Canada, Mexico, Brazil, Chile, Argentina, South Africa, Saudi Arabia, UAE, Egypt and Turkey
Competitive landscape Leading Companies, Market Positioning of Companies, Competitive Strategies, and Industry Risks

Request Free Sample

Research Analyst Overview

  • The ecosystem for renewable distributed energy generation (rdeg) technologies is a complex value chain starting with suppliers of raw materials like polysilicon and lithium, where sourcing is concentrated in a few regions, creating potential bottlenecks.
  • Manufacturers, including vertically integrated firms and specialized component makers, produce hardware such as solar pv panels, smart inverters, and energy storage systems, with the solar PV segment alone projected to constitute over 60% of the market. These products reach residential and commercial end-users through a fragmented network of installers and project developers.
  • Regulatory bodies set interconnection standards and incentives like feed-in tariffs, while technology firms provide essential energy management systems and virtual power plants that enable grid integration and demand-side flexibility, crucial for managing a system with increasing decentralization.

What are the Key Data Covered in this Renewable Distributed Energy Generation (RDEG) Technologies Market Research and Growth Report?

  • What is the expected growth of the Renewable Distributed Energy Generation (RDEG) Technologies Market between 2026 and 2030?

    • The Renewable Distributed Energy Generation (RDEG) Technologies Market is expected to grow by USD 189.78 million during 2026-2030, registering a CAGR of 11.7%. Year-over-year growth in 2026 is estimated at 10.7%%. This acceleration is shaped by growing imperative for grid resilience and energy security, which is intensifying demand across multiple end-use verticals covered in the report.

  • What segmentation does the market report cover?

    • The report is segmented by Technology (Solar PV, Small wind turbines, and Biomass based generation), Connectivity (On-grid systems, Off-grid systems, and Hybrid), Application (Commercial, Industrial, and Residential) and Geography (APAC, Europe, North America, South America, Middle East and Africa). Among these, the Solar PV segment is estimated to witness significant growth during the forecast period, driven by rising adoption across key application areas. Each segment includes detailed qualitative and quantitative analysis, along with historical data from 2020-2024 and forecasts through 2030 with year-over-year growth rates.

  • Which regions are analyzed in the report?

    • The report covers APAC, Europe, North America, South America and Middle East and Africa. APAC is estimated to contribute 54.2% to market growth during the forecast period. Country-level analysis includes China, India, Japan, Australia, South Korea, Indonesia, Germany, UK, France, Italy, The Netherlands, Spain, US, Canada, Mexico, Brazil, Chile, Argentina, South Africa, Saudi Arabia, UAE, Egypt and Turkey, with dedicated market size tables and year-over-year growth for each.

  • What are the key growth drivers and market challenges?

    • The primary driver is growing imperative for grid resilience and energy security, which is accelerating investment and industry demand. The main challenge is need for infrastructure modernization, creating operational barriers for key market participants. The report quantifies the impact of each driver and challenge across 2026 and 2030 with comparative analysis.

  • Who are the major players in the Renewable Distributed Energy Generation (RDEG) Technologies Market?

    • Key vendors include Bloom Energy Corp., BYD Co. Ltd., Canadian Solar Inc., Caterpillar Inc., Enphase Energy Inc., Envision Group, First Solar Inc., FuelCell Energy Inc., General Electric Co., Huawei Technologies Co. Ltd., JinkoSolar Holding Co. Ltd., Kingspan Group Plc, LONGi Green Energy Co. Ltd., Northern Power Systems, Schneider Electric SE, Siemens AG, SolarEdge Technologies Inc., Tesla Inc. and Trina Solar Co. Ltd.. The report provides qualitative and quantitative analysis categorizing companies as dominant, leading, strong, tentative, and weak based on their market positioning. Company profiles include business segment analysis, SWOT assessment, key offerings, and recent strategic developments.

Market Research Insights

  • The competitive landscape for renewable distributed energy generation (rdeg) technologies is intensely fragmented, with the top ten vendors accounting for less than 40% of the market share. This environment fosters rapid innovation as companies vie for dominance. Key players like Enphase Energy Inc. and SolarEdge Technologies Inc.
  • are pushing the boundaries of system intelligence, launching advanced microinverters and power optimizers that improve energy yield by up to 5%. These developments are a direct response to enterprise demand for higher efficiency and reliability. Major industrial conglomerates such as Siemens AG and Schneider Electric SE are focusing on integrated microgrid and energy storage solutions.
  • This strategic shift addresses the critical challenge of grid integration by providing comprehensive systems that enhance grid stability and support the broader energy transition.

We can help! Our analysts can customize this renewable distributed energy generation (rdeg) technologies market research report to meet your requirements.

Get in touch

1. Executive Summary

1.1 Market overview

Executive Summary - Chart on Market Overview
Executive Summary - Data Table on Market Overview
Executive Summary - Chart on Global Market Characteristics
Executive Summary - Chart on Market by Geography
Executive Summary - Chart on Market Segmentation by Technology
Executive Summary - Chart on Market Segmentation by Connectivity
Executive Summary - Chart on Market Segmentation by Application
Executive Summary - Chart on Incremental Growth
Executive Summary - Data Table on Incremental Growth
Executive Summary - Chart on Company Market Positioning

2. Technavio Analysis

2.1 Analysis of price sensitivity, lifecycle, customer purchase basket, adoption rates, and purchase criteria

2.2 Criticality of inputs and Factors of differentiation

Chart on Overview on criticality of inputs and factors of differentiation

2.3 Factors of disruption

Chart on Overview on factors of disruption

2.4 Impact of drivers and challenges

Chart on Impact of drivers and challenges in 2025 and 2030

3. Market Landscape

3.1 Market ecosystem

Chart on Parent Market
Data Table on - Parent Market

3.2 Market characteristics

Chart on Market characteristics analysis

3.3 Value chain analysis

Chart on Value chain analysis

4. Market Sizing

4.1 Market definition

Data Table on Offerings of companies included in the market definition

4.2 Market segment analysis

Market segments

4.3 Market size 2025

4.4 Market outlook: Forecast for 2025-2030

Chart on Global - Market size and forecast 2025-2030 ($ thousand)
Data Table on Global - Market size and forecast 2025-2030 ($ thousand)
Chart on Global Market: Year-over-year growth 2025-2030 (%)
Data Table on Global Market: Year-over-year growth 2025-2030 (%)

5. Historic Market Size

5.1 Global Renewable Distributed Energy Generation (RDEG) Technologies Market 2020 - 2024

Historic Market Size - Data Table on Global Renewable Distributed Energy Generation (RDEG) Technologies Market 2020 - 2024 ($ thousand)

5.2 Technology segment analysis 2020 - 2024

Historic Market Size - Technology Segment 2020 - 2024 ($ thousand)

5.3 Connectivity segment analysis 2020 - 2024

Historic Market Size - Connectivity Segment 2020 - 2024 ($ thousand)

5.4 Application segment analysis 2020 - 2024

Historic Market Size - Application Segment 2020 - 2024 ($ thousand)

5.5 Geography segment analysis 2020 - 2024

Historic Market Size - Geography Segment 2020 - 2024 ($ thousand)

5.6 Country segment analysis 2020 - 2024

Historic Market Size - Country Segment 2020 - 2024 ($ thousand)

6. Qualitative Analysis

6.1 The AI impact on Global Renewable Distributed Energy Generation (RDEG) Technologies Market

7. Five Forces Analysis

7.1 Five forces summary

Five forces analysis - Comparison between 2025 and 2030

7.2 Bargaining power of buyers

Bargaining power of buyers - Impact of key factors 2025 and 2030

7.3 Bargaining power of suppliers

Bargaining power of suppliers - Impact of key factors in 2025 and 2030

7.4 Threat of new entrants

Threat of new entrants - Impact of key factors in 2025 and 2030

7.5 Threat of substitutes

Threat of substitutes - Impact of key factors in 2025 and 2030

7.6 Threat of rivalry

Threat of rivalry - Impact of key factors in 2025 and 2030

7.7 Market condition

Chart on Market condition - Five forces 2025 and 2030

8. Market Segmentation by Technology

8.1 Market segments

Chart on Technology - Market share 2025-2030 (%)
Data Table on Technology - Market share 2025-2030 (%)

8.2 Comparison by Technology

Chart on Comparison by Technology
Data Table on Comparison by Technology

8.3 Solar PV - Market size and forecast 2025-2030

Chart on Solar PV - Market size and forecast 2025-2030 ($ thousand)
Data Table on Solar PV - Market size and forecast 2025-2030 ($ thousand)
Chart on Solar PV - Year-over-year growth 2025-2030 (%)
Data Table on Solar PV - Year-over-year growth 2025-2030 (%)

8.4 Small wind turbines - Market size and forecast 2025-2030

Chart on Small wind turbines - Market size and forecast 2025-2030 ($ thousand)
Data Table on Small wind turbines - Market size and forecast 2025-2030 ($ thousand)
Chart on Small wind turbines - Year-over-year growth 2025-2030 (%)
Data Table on Small wind turbines - Year-over-year growth 2025-2030 (%)

8.5 Biomass based generation - Market size and forecast 2025-2030

Chart on Biomass based generation - Market size and forecast 2025-2030 ($ thousand)
Data Table on Biomass based generation - Market size and forecast 2025-2030 ($ thousand)
Chart on Biomass based generation - Year-over-year growth 2025-2030 (%)
Data Table on Biomass based generation - Year-over-year growth 2025-2030 (%)

8.6 Market opportunity by Technology

Market opportunity by Technology ($ thousand)
Data Table on Market opportunity by Technology ($ thousand)

9. Market Segmentation by Connectivity

9.1 Market segments

Chart on Connectivity - Market share 2025-2030 (%)
Data Table on Connectivity - Market share 2025-2030 (%)

9.2 Comparison by Connectivity

Chart on Comparison by Connectivity
Data Table on Comparison by Connectivity

9.3 On-grid systems - Market size and forecast 2025-2030

Chart on On-grid systems - Market size and forecast 2025-2030 ($ thousand)
Data Table on On-grid systems - Market size and forecast 2025-2030 ($ thousand)
Chart on On-grid systems - Year-over-year growth 2025-2030 (%)
Data Table on On-grid systems - Year-over-year growth 2025-2030 (%)

9.4 Off-grid systems - Market size and forecast 2025-2030

Chart on Off-grid systems - Market size and forecast 2025-2030 ($ thousand)
Data Table on Off-grid systems - Market size and forecast 2025-2030 ($ thousand)
Chart on Off-grid systems - Year-over-year growth 2025-2030 (%)
Data Table on Off-grid systems - Year-over-year growth 2025-2030 (%)

9.5 Hybrid - Market size and forecast 2025-2030

Chart on Hybrid - Market size and forecast 2025-2030 ($ thousand)
Data Table on Hybrid - Market size and forecast 2025-2030 ($ thousand)
Chart on Hybrid - Year-over-year growth 2025-2030 (%)
Data Table on Hybrid - Year-over-year growth 2025-2030 (%)

9.6 Market opportunity by Connectivity

Market opportunity by Connectivity ($ thousand)
Data Table on Market opportunity by Connectivity ($ thousand)

10. Market Segmentation by Application

10.1 Market segments

Chart on Application - Market share 2025-2030 (%)
Data Table on Application - Market share 2025-2030 (%)

10.2 Comparison by Application

Chart on Comparison by Application
Data Table on Comparison by Application

10.3 Commercial - Market size and forecast 2025-2030

Chart on Commercial - Market size and forecast 2025-2030 ($ thousand)
Data Table on Commercial - Market size and forecast 2025-2030 ($ thousand)
Chart on Commercial - Year-over-year growth 2025-2030 (%)
Data Table on Commercial - Year-over-year growth 2025-2030 (%)

10.4 Industrial - Market size and forecast 2025-2030

Chart on Industrial - Market size and forecast 2025-2030 ($ thousand)
Data Table on Industrial - Market size and forecast 2025-2030 ($ thousand)
Chart on Industrial - Year-over-year growth 2025-2030 (%)
Data Table on Industrial - Year-over-year growth 2025-2030 (%)

10.5 Residential - Market size and forecast 2025-2030

Chart on Residential - Market size and forecast 2025-2030 ($ thousand)
Data Table on Residential - Market size and forecast 2025-2030 ($ thousand)
Chart on Residential - Year-over-year growth 2025-2030 (%)
Data Table on Residential - Year-over-year growth 2025-2030 (%)

10.6 Market opportunity by Application

Market opportunity by Application ($ thousand)
Data Table on Market opportunity by Application ($ thousand)

11. Customer Landscape

11.1 Customer landscape overview

Analysis of price sensitivity, lifecycle, customer purchase basket, adoption rates, and purchase criteria

12. Geographic Landscape

12.1 Geographic segmentation

Chart on Market share by geography 2025-2030 (%)
Data Table on Market share by geography 2025-2030 (%)

12.2 Geographic comparison

Chart on Geographic comparison
Data Table on Geographic comparison

12.3 APAC - Market size and forecast 2025-2030

Chart on APAC - Market size and forecast 2025-2030 ($ thousand)
Data Table on APAC - Market size and forecast 2025-2030 ($ thousand)
Chart on APAC - Year-over-year growth 2025-2030 (%)
Data Table on APAC - Year-over-year growth 2025-2030 (%)
Chart on Regional Comparison - APAC
Data Table on Regional Comparison - APAC

12.3.1 China - Market size and forecast 2025-2030

Chart on China - Market size and forecast 2025-2030 ($ thousand)
Data Table on China - Market size and forecast 2025-2030 ($ thousand)
Chart on China - Year-over-year growth 2025-2030 (%)
Data Table on China - Year-over-year growth 2025-2030 (%)

12.3.2 India - Market size and forecast 2025-2030

Chart on India - Market size and forecast 2025-2030 ($ thousand)
Data Table on India - Market size and forecast 2025-2030 ($ thousand)
Chart on India - Year-over-year growth 2025-2030 (%)
Data Table on India - Year-over-year growth 2025-2030 (%)

12.3.3 Japan - Market size and forecast 2025-2030

Chart on Japan - Market size and forecast 2025-2030 ($ thousand)
Data Table on Japan - Market size and forecast 2025-2030 ($ thousand)
Chart on Japan - Year-over-year growth 2025-2030 (%)
Data Table on Japan - Year-over-year growth 2025-2030 (%)

12.3.4 Australia - Market size and forecast 2025-2030

Chart on Australia - Market size and forecast 2025-2030 ($ thousand)
Data Table on Australia - Market size and forecast 2025-2030 ($ thousand)
Chart on Australia - Year-over-year growth 2025-2030 (%)
Data Table on Australia - Year-over-year growth 2025-2030 (%)

12.3.5 South Korea - Market size and forecast 2025-2030

Chart on South Korea - Market size and forecast 2025-2030 ($ thousand)
Data Table on South Korea - Market size and forecast 2025-2030 ($ thousand)
Chart on South Korea - Year-over-year growth 2025-2030 (%)
Data Table on South Korea - Year-over-year growth 2025-2030 (%)

12.3.6 Indonesia - Market size and forecast 2025-2030

Chart on Indonesia - Market size and forecast 2025-2030 ($ thousand)
Data Table on Indonesia - Market size and forecast 2025-2030 ($ thousand)
Chart on Indonesia - Year-over-year growth 2025-2030 (%)
Data Table on Indonesia - Year-over-year growth 2025-2030 (%)

12.4 Europe - Market size and forecast 2025-2030

Chart on Europe - Market size and forecast 2025-2030 ($ thousand)
Data Table on Europe - Market size and forecast 2025-2030 ($ thousand)
Chart on Europe - Year-over-year growth 2025-2030 (%)
Data Table on Europe - Year-over-year growth 2025-2030 (%)
Chart on Regional Comparison - Europe
Data Table on Regional Comparison - Europe

12.4.1 Germany - Market size and forecast 2025-2030

Chart on Germany - Market size and forecast 2025-2030 ($ thousand)
Data Table on Germany - Market size and forecast 2025-2030 ($ thousand)
Chart on Germany - Year-over-year growth 2025-2030 (%)
Data Table on Germany - Year-over-year growth 2025-2030 (%)

12.4.2 UK - Market size and forecast 2025-2030

Chart on UK - Market size and forecast 2025-2030 ($ thousand)
Data Table on UK - Market size and forecast 2025-2030 ($ thousand)
Chart on UK - Year-over-year growth 2025-2030 (%)
Data Table on UK - Year-over-year growth 2025-2030 (%)

12.4.3 France - Market size and forecast 2025-2030

Chart on France - Market size and forecast 2025-2030 ($ thousand)
Data Table on France - Market size and forecast 2025-2030 ($ thousand)
Chart on France - Year-over-year growth 2025-2030 (%)
Data Table on France - Year-over-year growth 2025-2030 (%)

12.4.4 Italy - Market size and forecast 2025-2030

Chart on Italy - Market size and forecast 2025-2030 ($ thousand)
Data Table on Italy - Market size and forecast 2025-2030 ($ thousand)
Chart on Italy - Year-over-year growth 2025-2030 (%)
Data Table on Italy - Year-over-year growth 2025-2030 (%)

12.4.5 The Netherlands - Market size and forecast 2025-2030

Chart on The Netherlands - Market size and forecast 2025-2030 ($ thousand)
Data Table on The Netherlands - Market size and forecast 2025-2030 ($ thousand)
Chart on The Netherlands - Year-over-year growth 2025-2030 (%)
Data Table on The Netherlands - Year-over-year growth 2025-2030 (%)

12.4.6 Spain - Market size and forecast 2025-2030

Chart on Spain - Market size and forecast 2025-2030 ($ thousand)
Data Table on Spain - Market size and forecast 2025-2030 ($ thousand)
Chart on Spain - Year-over-year growth 2025-2030 (%)
Data Table on Spain - Year-over-year growth 2025-2030 (%)

12.5 North America - Market size and forecast 2025-2030

Chart on North America - Market size and forecast 2025-2030 ($ thousand)
Data Table on North America - Market size and forecast 2025-2030 ($ thousand)
Chart on North America - Year-over-year growth 2025-2030 (%)
Data Table on North America - Year-over-year growth 2025-2030 (%)
Chart on Regional Comparison - North America
Data Table on Regional Comparison - North America

12.5.1 US - Market size and forecast 2025-2030

Chart on US - Market size and forecast 2025-2030 ($ thousand)
Data Table on US - Market size and forecast 2025-2030 ($ thousand)
Chart on US - Year-over-year growth 2025-2030 (%)
Data Table on US - Year-over-year growth 2025-2030 (%)

12.5.2 Canada - Market size and forecast 2025-2030

Chart on Canada - Market size and forecast 2025-2030 ($ thousand)
Data Table on Canada - Market size and forecast 2025-2030 ($ thousand)
Chart on Canada - Year-over-year growth 2025-2030 (%)
Data Table on Canada - Year-over-year growth 2025-2030 (%)

12.5.3 Mexico - Market size and forecast 2025-2030

Chart on Mexico - Market size and forecast 2025-2030 ($ thousand)
Data Table on Mexico - Market size and forecast 2025-2030 ($ thousand)
Chart on Mexico - Year-over-year growth 2025-2030 (%)
Data Table on Mexico - Year-over-year growth 2025-2030 (%)

12.6 South America - Market size and forecast 2025-2030

Chart on South America - Market size and forecast 2025-2030 ($ thousand)
Data Table on South America - Market size and forecast 2025-2030 ($ thousand)
Chart on South America - Year-over-year growth 2025-2030 (%)
Data Table on South America - Year-over-year growth 2025-2030 (%)
Chart on Regional Comparison - South America
Data Table on Regional Comparison - South America

12.6.1 Brazil - Market size and forecast 2025-2030

Chart on Brazil - Market size and forecast 2025-2030 ($ thousand)
Data Table on Brazil - Market size and forecast 2025-2030 ($ thousand)
Chart on Brazil - Year-over-year growth 2025-2030 (%)
Data Table on Brazil - Year-over-year growth 2025-2030 (%)

12.6.2 Chile - Market size and forecast 2025-2030

Chart on Chile - Market size and forecast 2025-2030 ($ thousand)
Data Table on Chile - Market size and forecast 2025-2030 ($ thousand)
Chart on Chile - Year-over-year growth 2025-2030 (%)
Data Table on Chile - Year-over-year growth 2025-2030 (%)

12.6.3 Argentina - Market size and forecast 2025-2030

Chart on Argentina - Market size and forecast 2025-2030 ($ thousand)
Data Table on Argentina - Market size and forecast 2025-2030 ($ thousand)
Chart on Argentina - Year-over-year growth 2025-2030 (%)
Data Table on Argentina - Year-over-year growth 2025-2030 (%)

12.7 Middle East and Africa - Market size and forecast 2025-2030

Chart on Middle East and Africa - Market size and forecast 2025-2030 ($ thousand)
Data Table on Middle East and Africa - Market size and forecast 2025-2030 ($ thousand)
Chart on Middle East and Africa - Year-over-year growth 2025-2030 (%)
Data Table on Middle East and Africa - Year-over-year growth 2025-2030 (%)
Chart on Regional Comparison - Middle East and Africa
Data Table on Regional Comparison - Middle East and Africa

12.7.1 South Africa - Market size and forecast 2025-2030

Chart on South Africa - Market size and forecast 2025-2030 ($ thousand)
Data Table on South Africa - Market size and forecast 2025-2030 ($ thousand)
Chart on South Africa - Year-over-year growth 2025-2030 (%)
Data Table on South Africa - Year-over-year growth 2025-2030 (%)

12.7.2 Saudi Arabia - Market size and forecast 2025-2030

Chart on Saudi Arabia - Market size and forecast 2025-2030 ($ thousand)
Data Table on Saudi Arabia - Market size and forecast 2025-2030 ($ thousand)
Chart on Saudi Arabia - Year-over-year growth 2025-2030 (%)
Data Table on Saudi Arabia - Year-over-year growth 2025-2030 (%)

12.7.3 UAE - Market size and forecast 2025-2030

Chart on UAE - Market size and forecast 2025-2030 ($ thousand)
Data Table on UAE - Market size and forecast 2025-2030 ($ thousand)
Chart on UAE - Year-over-year growth 2025-2030 (%)
Data Table on UAE - Year-over-year growth 2025-2030 (%)

12.7.4 Egypt - Market size and forecast 2025-2030

Chart on Egypt - Market size and forecast 2025-2030 ($ thousand)
Data Table on Egypt - Market size and forecast 2025-2030 ($ thousand)
Chart on Egypt - Year-over-year growth 2025-2030 (%)
Data Table on Egypt - Year-over-year growth 2025-2030 (%)

12.7.5 Turkey - Market size and forecast 2025-2030

Chart on Turkey - Market size and forecast 2025-2030 ($ thousand)
Data Table on Turkey - Market size and forecast 2025-2030 ($ thousand)
Chart on Turkey - Year-over-year growth 2025-2030 (%)
Data Table on Turkey - Year-over-year growth 2025-2030 (%)

12.8 Market opportunity by geography

Market opportunity by geography ($ thousand)
Data Tables on Market opportunity by geography ($ thousand)

13. Drivers, Challenges, and Opportunity

13.1 Market drivers

Growing imperative for grid resilience and energy security
Supportive regulatory frameworks and global decarbonization mandates
Continuous technological innovation and cost reduction

13.2 Market challenges

Need for infrastructure modernization
Critical supply chain constraints and exposure to geopolitical volatility
Overcoming high initial capital expenditures and securing accessible financing

13.3 Impact of drivers and challenges

Impact of drivers and challenges in 2025 and 2030

13.4 Market opportunities

Convergence of RDEG with advanced energy storage and digitalization
Proliferation of prosumer-centric and community-based business models
Increasing sector coupling and electrification of end-use applications

14. Competitive Landscape

14.1 Overview

14.2

Overview on criticality of inputs and factors of differentiation

14.3 Landscape disruption

Overview on factors of disruption

14.4 Industry risks

Impact of key risks on business

15. Competitive Analysis

15.1 Companies profiled

Companies covered

15.2 Company ranking index

15.3 Market positioning of companies

Matrix on companies position and classification

15.4 Bloom Energy Corp.

Bloom Energy Corp. - Overview
Bloom Energy Corp. - Product / Service
Bloom Energy Corp. - Key offerings
SWOT

15.5 Canadian Solar Inc.

Canadian Solar Inc. - Overview
Canadian Solar Inc. - Business segments
Canadian Solar Inc. - Key news
Canadian Solar Inc. - Key offerings
Canadian Solar Inc. - Segment focus
SWOT

15.6 Caterpillar Inc.

Caterpillar Inc. - Overview
Caterpillar Inc. - Business segments
Caterpillar Inc. - Key news
Caterpillar Inc. - Key offerings
Caterpillar Inc. - Segment focus
SWOT

15.7 Enphase Energy Inc.

Enphase Energy Inc. - Overview
Enphase Energy Inc. - Product / Service
Enphase Energy Inc. - Key news
Enphase Energy Inc. - Key offerings
SWOT

15.8 First Solar Inc.

First Solar Inc. - Overview
First Solar Inc. - Business segments
First Solar Inc. - Key news
First Solar Inc. - Key offerings
First Solar Inc. - Segment focus
SWOT

15.9 FuelCell Energy Inc.

FuelCell Energy Inc. - Overview
FuelCell Energy Inc. - Product / Service
FuelCell Energy Inc. - Key offerings
SWOT

15.10 General Electric Co.

General Electric Co. - Overview
General Electric Co. - Business segments
General Electric Co. - Key news
General Electric Co. - Key offerings
General Electric Co. - Segment focus
SWOT

15.11 Huawei Technologies Co. Ltd.

Huawei Technologies Co. Ltd. - Overview
Huawei Technologies Co. Ltd. - Product / Service
Huawei Technologies Co. Ltd. - Key news
Huawei Technologies Co. Ltd. - Key offerings
SWOT

15.12 JinkoSolar Holding Co. Ltd.

JinkoSolar Holding Co. Ltd. - Overview
JinkoSolar Holding Co. Ltd. - Product / Service
JinkoSolar Holding Co. Ltd. - Key news
JinkoSolar Holding Co. Ltd. - Key offerings
SWOT

15.13 LONGi Green Energy Co. Ltd.

LONGi Green Energy Co. Ltd. - Overview
LONGi Green Energy Co. Ltd. - Product / Service
LONGi Green Energy Co. Ltd. - Key news
LONGi Green Energy Co. Ltd. - Key offerings
SWOT

15.14 Schneider Electric SE

Schneider Electric SE - Overview
Schneider Electric SE - Business segments
Schneider Electric SE - Key news
Schneider Electric SE - Key offerings
Schneider Electric SE - Segment focus
SWOT

15.15 Siemens AG

Siemens AG - Overview
Siemens AG - Business segments
Siemens AG - Key news
Siemens AG - Key offerings
Siemens AG - Segment focus
SWOT

15.16 SolarEdge Technologies Inc.

SolarEdge Technologies Inc. - Overview
SolarEdge Technologies Inc. - Product / Service
SolarEdge Technologies Inc. - Key news
SolarEdge Technologies Inc. - Key offerings
SWOT

15.17 Tesla Inc.

Tesla Inc. - Overview
Tesla Inc. - Business segments
Tesla Inc. - Key news
Tesla Inc. - Key offerings
Tesla Inc. - Segment focus
SWOT

15.18 Trina Solar Co. Ltd.

Trina Solar Co. Ltd. - Overview
Trina Solar Co. Ltd. - Product / Service
Trina Solar Co. Ltd. - Key news
Trina Solar Co. Ltd. - Key offerings
SWOT

16. Appendix

16.1 Scope of the report

Market definition
Objectives
Notes and caveats

16.2 Inclusions and exclusions checklist

Inclusions checklist
Exclusions checklist

16.3 Currency conversion rates for US$

16.4 Research methodology

16.5 Data procurement

Information sources

16.6 Data validation

16.7 Validation techniques employed for market sizing

16.8 Data synthesis

16.9 360 degree market analysis

16.10 List of abbreviations

Research Methodology

Technavio presents a detailed picture of the market by way of study, synthesis, and summation of data from multiple sources. The analysts have presented the various facets of the market with a particular focus on identifying the key industry influencers. The data thus presented is comprehensive, reliable, and the result of extensive research, both primary and secondary.

INFORMATION SOURCES

Primary sources

  • Manufacturers and suppliers
  • Channel partners
  • Industry experts
  • Strategic decision makers

Secondary sources

  • Industry journals and periodicals
  • Government data
  • Financial reports of key industry players
  • Historical data
  • Press releases

DATA ANALYSIS

Data Synthesis

  • Collation of data
  • Estimation of key figures
  • Analysis of derived insights

Data Validation

  • Triangulation with data models
  • Reference against proprietary databases
  • Corroboration with industry experts

REPORT WRITING

Qualitative

  • Market drivers
  • Market challenges
  • Market trends
  • Five forces analysis

Quantitative

  • Market size and forecast
  • Market segmentation
  • Geographical insights
  • Competitive landscape

Interested in this report?

Get your sample now to see our research methodology and insights!

Download Now

Frequently Asked Questions

Renewable Distributed Energy Generation (RDEG) Technologies market growth will increase by USD 189775.0 thousand thousand during 2026-2030.

The Renewable Distributed Energy Generation (RDEG) Technologies market is expected to grow at a CAGR of 11.7% during 2026-2030.

Renewable Distributed Energy Generation (RDEG) Technologies market is segmented by Technology (Solar PV, Small wind turbines, Biomass based generation) Connectivity (On-grid systems, Off-grid systems, Hybrid) Application (Commercial, Industrial, Residential)

Bloom Energy Corp., BYD Co. Ltd., Canadian Solar Inc., Caterpillar Inc., Enphase Energy Inc., Envision Group, First Solar Inc., FuelCell Energy Inc., General Electric Co., Huawei Technologies Co. Ltd., JinkoSolar Holding Co. Ltd., Kingspan Group Plc, LONGi Green Energy Co. Ltd., Northern Power Systems, Schneider Electric SE, Siemens AG, SolarEdge Technologies Inc., Tesla Inc., Trina Solar Co. Ltd. are a few of the key vendors in the Renewable Distributed Energy Generation (RDEG) Technologies market.

APAC will register the highest growth rate of 54.2% among the other regions. Therefore, the Renewable Distributed Energy Generation (RDEG) Technologies market in APAC is expected to garner significant business opportunities for the vendors during the forecast period.

China, India, Japan, Australia, South Korea, Indonesia, Germany, UK, France, Italy, The Netherlands, Spain, US, Canada, Mexico, Brazil, Chile, Argentina, South Africa, Saudi Arabia, UAE, Egypt, Turkey

  • Growing imperative for grid resilience and energy security is the driving factor this market.

The Renewable Distributed Energy Generation (RDEG) Technologies market vendors should focus on grabbing business opportunities from the Technology segment as it accounted for the largest market share in the base year.
RIA - Research AI Assistant
Ask RIA