Remote Clinical Trial Monitoring Tools Market Analysis, Size, and Forecast 2026-2030: North America (US, Canada, and Mexico), Europe (Germany, UK, and France), Asia (China, India, and Japan), Middle East and Africa (UAE, South Africa, and Saudi Arabia), South America (Brazil), Rest of World (ROW)

Remote Clinical Trial Monitoring Tools Market Analysis, Size, and Forecast 2026-2030:
North America (US, Canada, and Mexico), Europe (Germany, UK, and France), Asia (China, India, and Japan), Middle East and Africa (UAE, South Africa, and Saudi Arabia), South America (Brazil), Rest of World (ROW)

Published: May 2026 293 Pages SKU: IRTNTR81302

Market Overview at a Glance

$5.19 B
Market Opportunity
23.5%
CAGR 2025 - 2030
41.7%
North America Growth
$1.00 B
Software segment 2024

Remote Clinical Trial Monitoring Tools Market Size and Growth Forecast 2026-2030

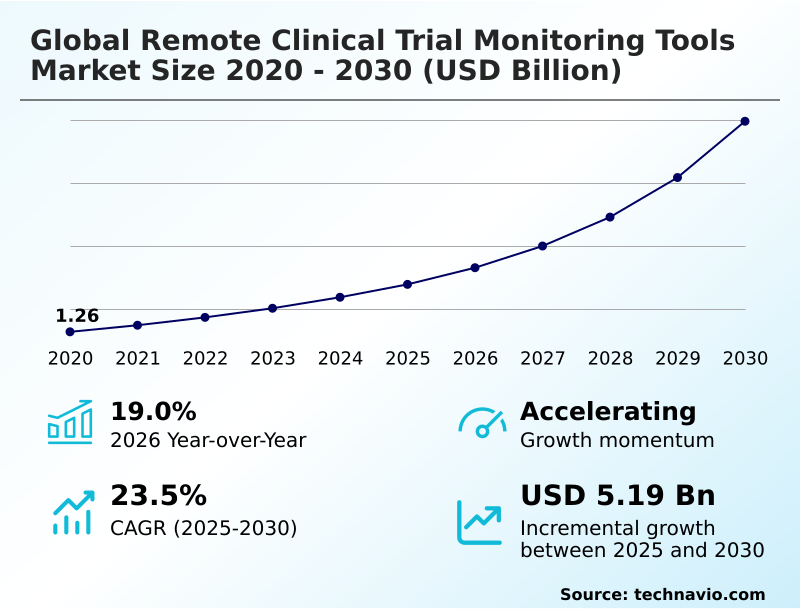
The Remote Clinical Trial Monitoring Tools Market size was valued at USD 2.77 billion in 2025 growing at a CAGR of 23.5% during the forecast period 2026-2030.

North America accounts for 41.7% of incremental growth during the forecast period. The Software segment by Component was valued at USD 1.00 billion in 2024, while the Pharmaceutical and biotech companies segment holds the largest revenue share by End-user.

The market is projected to grow by USD 6.70 billion from 2020 to 2030, with USD 5.19 billion of the growth expected during the forecast period of 2025 to 2030.

Get Key Insights on Market Forecast (PDF) Request Free Sample

Remote Clinical Trial Monitoring Tools Market Overview

The remote clinical trial monitoring tools market is defined by a strategic industry transition from site-centric oversight to technology-enabled, centralized methodologies. This evolution is driven by the need for greater efficiency in clinical development, where risk-based monitoring and remote source data verification have become standard practice. A key factor is the integration of electronic data capture systems with data from wearable biosensors and patient-facing mobile applications, creating a continuous stream of information. For instance, a contract research organization managing a multi-regional oncology trial utilizes a unified platform to perform remote data review, analyzing real-time digital biomarkers to detect adverse events. This proactive approach, compliant with FDA digital health guidelines, allows monitors to manage trial integrity without physical site visits. With North America contributing over 41% of the incremental growth, the region’s advanced digital maturity and supportive regulatory environment set the pace for global adoption, pushing vendors to innovate in areas like real-time site performance tracking and automated data reconciliation.

Drivers, Trends, and Challenges in the Remote Clinical Trial Monitoring Tools Market

The strategic adoption of remote clinical trial monitoring tools is increasingly influenced by the total cost of ownership, compelling decision-makers to evaluate how integrating EDC with remote monitoring tools impacts operational budgets.

While initial capital expenditure for platforms with advanced AI algorithms for clinical data anomaly detection can be significant, the long-term return on investment is realized through reduced site visit frequency and expedited data-lock timelines.

A key consideration is compliance with evolving regulatory frameworks, such as the technical standards for remote monitoring software validation outlined in the European Medicines Agency's reflection paper on AI. In a practical scenario, a CRO implementing a platform for automating remote source data verification for a large-scale cardiovascular study can reduce monitoring costs by over 30% compared to traditional methods.

This efficiency is crucial for managing the complexities of decentralized study participant management and ensuring adherence to Good Clinical Practice (GCP) guidelines. The benefits of using predictive analytics for clinical trial risk assessment further justify the investment, as these systems provide early warnings on site performance issues, allowing for proactive intervention and safeguarding trial integrity.

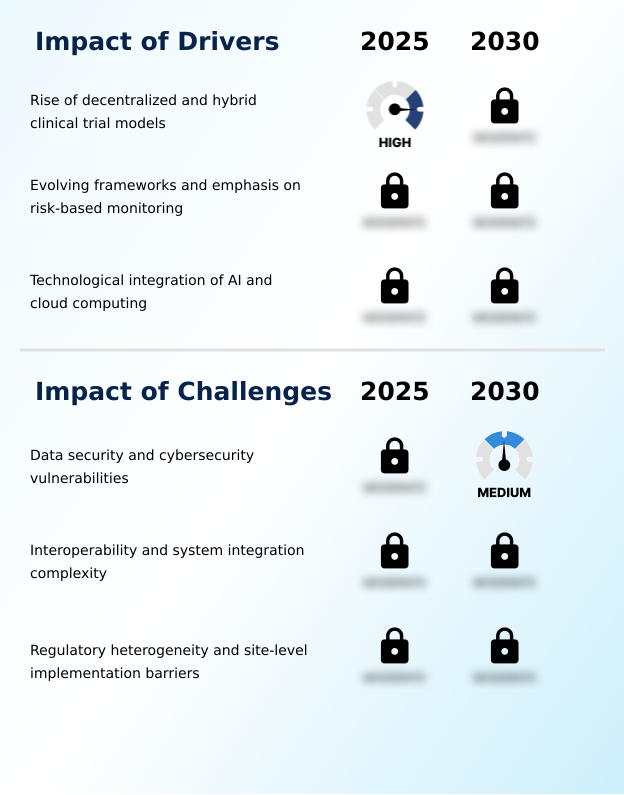
Primary Growth Driver: The increasing adoption of decentralized and hybrid clinical trial models is a primary driver for the expansion of the market.

The expansion of the market is primarily driven by the increasing industry adoption of decentralized and hybrid clinical trial models.

This strategic shift necessitates robust remote monitoring solutions to ensure data integrity and patient safety without requiring physical oversight at geographically dispersed sites.

Regulatory bodies, including the FDA, have bolstered this driver by issuing guidance that encourages risk-based approaches, for which remote monitoring tools are essential. These platforms provide the analytical capabilities to identify data anomalies and site performance issues in real time.

Furthermore, technological advancements in AI and cloud computing enable the automation of data cleaning and verification processes.

The proliferation of IoT devices and high-speed connectivity facilitates the seamless transmission of large data sets from sources like electronic health records, which are then managed by centralized monitoring platforms.

Emerging Market Trend: A primary trend is the market's shift from reactive to proactive oversight through the integration of predictive analytics and machine learning in monitoring tools.

The market is evolving from descriptive oversight to proactive intervention through the integration of predictive analytics and machine learning models. Modern platforms now utilize neural networks and advanced algorithms to analyze historical trial data, identifying patterns that indicate a high probability of future non-compliance or data anomalies. This shift allows for a more effective risk-based monitoring approach, optimizing resource allocation.

The increasing use of medical-grade wearable devices provides a continuous stream of physiological data, which, when fed into these systems, enables the early detection of adverse events. This trend supports the broader industry move toward decentralized trials, improving patient retention and data quality.

The ongoing refinement of these predictive models represents a fundamental change in how monitors interact with trial data, paving the way for a more efficient, data-driven future.

Key Industry Challenge: The preservation of data security and mitigation of cybersecurity vulnerabilities represent a primary challenge for the market.

A significant challenge constraining the market is the complexity of ensuring data security and mitigating cybersecurity risks in decentralized trial environments. The transmission of sensitive protected health information across various digital networks creates numerous vulnerabilities. Organizations must invest heavily in advanced encryption and continuous monitoring systems to protect the trial ecosystem in compliance with regulations like HIPAA.

Another major barrier is the lack of standardization and system interoperability between disparate software systems, such as EDC platforms and electronic health records. This fragmentation often forces manual data reconciliation, increasing the risk of human error.

Additionally, inconsistent regulatory landscapes and varying local privacy laws, especially regarding cross-border data transfer and data sovereignty requirements, create significant logistical hurdles for sponsors conducting global trials.

Explore Full Market Dynamics Analysis Request Free Sample

Remote Clinical Trial Monitoring Tools Market Segmentation

The remote clinical trial monitoring tools industry research report provides comprehensive data including region-wise segment analysis, with forecasts and analysis for the period 2026-2030, as well as historical data from 2020-2024 for the following segments.

Market Segment by Component
  • Software
  • Hardware
  • Services
Market Segment by End-user
  • Pharmaceutical and biotech companies
  • Contract research organizations
  • Healthcare IT and service providers
  • Academic and research institutes
Market Segment by Deployment
  • Cloud based
  • On premises
Market Segment by Geography
North America
US, Canada, Mexico
Europe
Germany, UK, France, Italy, The Netherlands, Spain
Asia
China, India, Japan, South Korea, Indonesia, Thailand, Singapore
Rest of World (ROW)

Component Segment Analysis

The software segment is estimated to witness significant growth during the forecast period.

The software segment is the architectural core of the remote clinical trial monitoring tools market, providing the essential electronic data capture systems and platforms for trial management.

This segment's growth is tied to the industry-wide adoption of cloud-based architecture and generative artificial intelligence to manage the data streams from wearable biosensors.

In practice, organizations leverage these solutions to automate data cleaning and verification, reducing manual error and ensuring the integrity of patient-reported outcomes for regulatory submissions.

The shift to decentralized trial models has intensified the demand for software that offers robust remote source data verification capabilities.

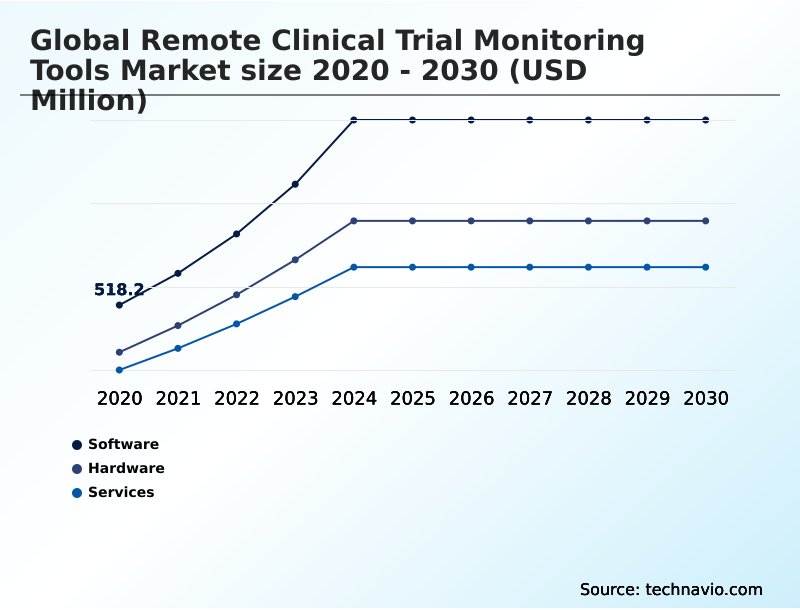
As of 2023, this segment accounted for a dominant share of the market, reflecting its criticality in enabling the operational efficiencies required for modern clinical development.

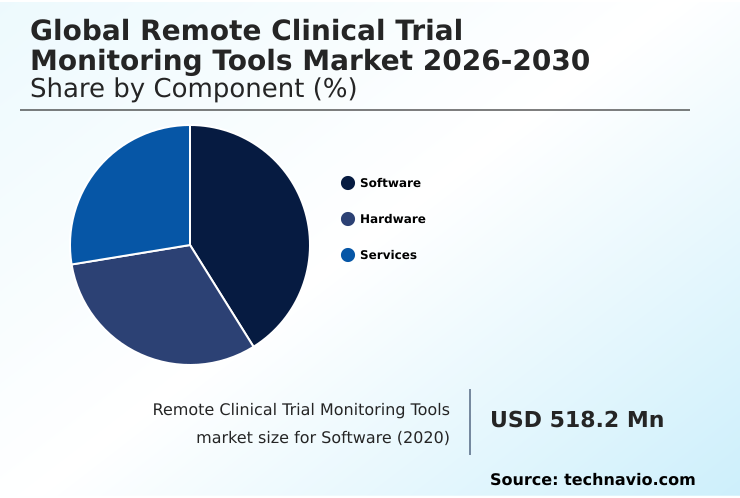
The Software segment was valued at USD 1.00 billion in 2024 and showed a gradual increase during the forecast period.

Remote Clinical Trial Monitoring Tools Market by Region: North America Leads with 41.7% Growth Share

North America is estimated to contribute 41.7% to the growth of the global market during the forecast period.

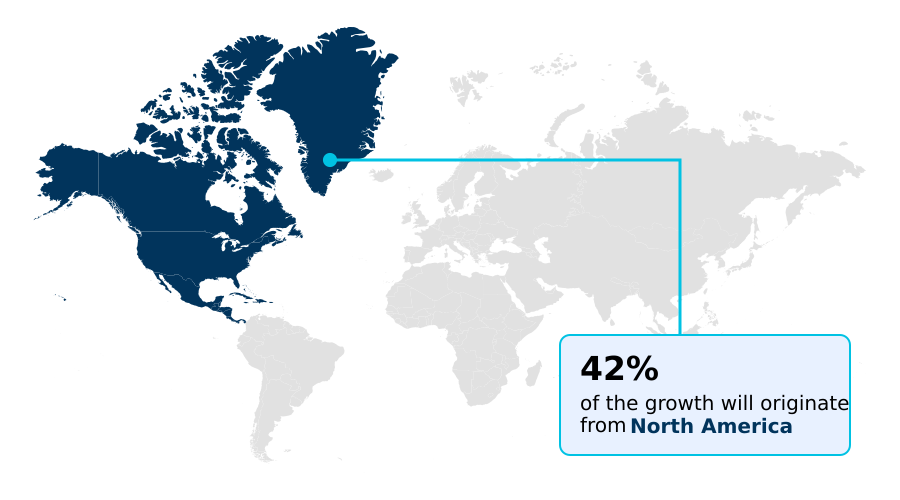
The geographic landscape is led by North America, which is projected to contribute approximately 41% of the market's growth, driven by a mature digital health ecosystem and supportive FDA policies promoting remote data acquisition.

In Europe, which accounts for over 24% of the market opportunity, adoption is shaped by the stringent requirements of the General Data Protection Regulation (GDPR), demanding advanced data anonymization features and secure cloud-based repositories.

Asia is the fastest-growing region, with countries like China implementing specific cybersecurity protocols for remote clinical monitoring data, compelling global technology providers to localize their data storage solutions.

Across all regions, the push for greater system interoperability is a constant, with a focus on standardizing remote source data verification protocols to streamline multi-regional clinical trials and reduce the administrative burden on investigative sites.

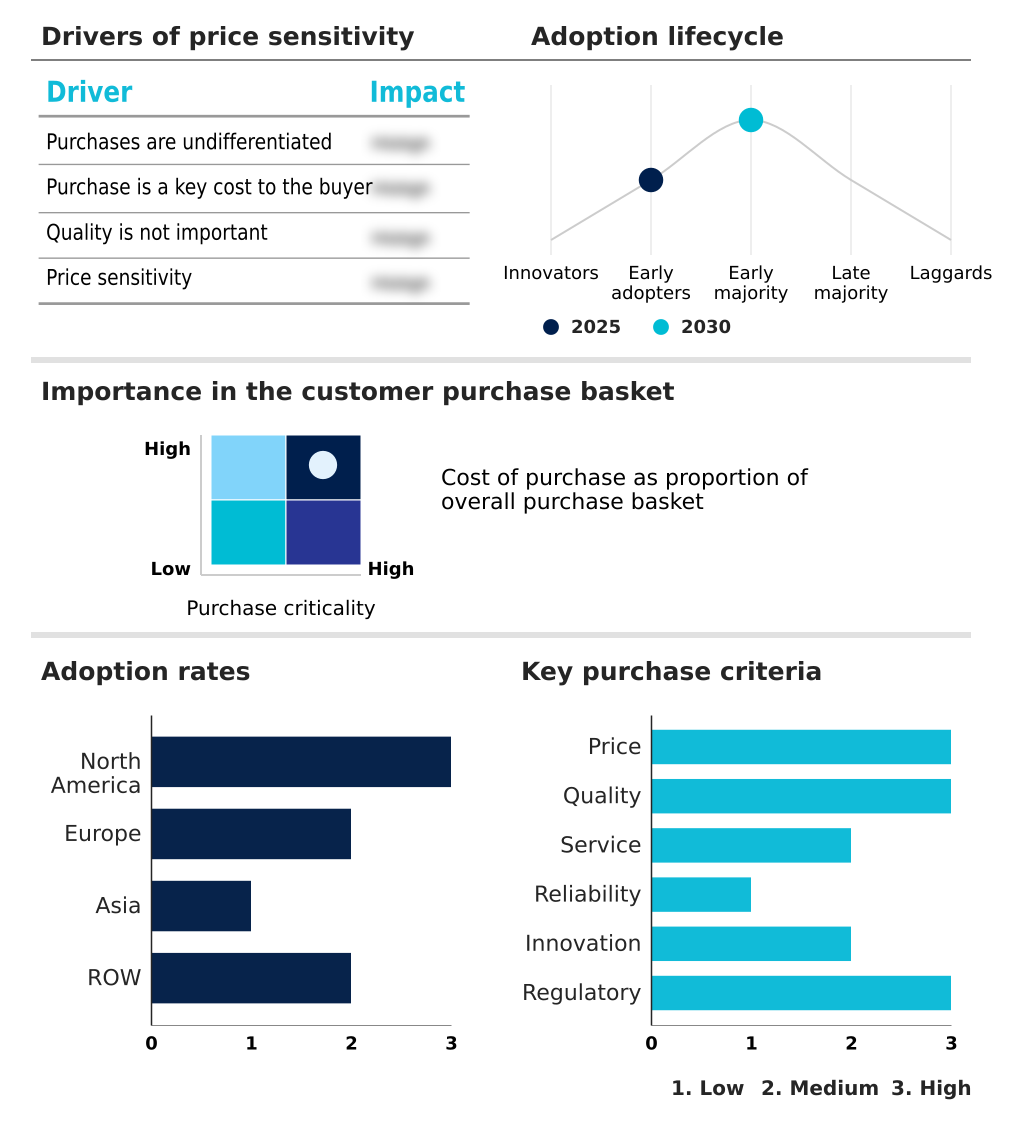
Customer Landscape Analysis for the Remote Clinical Trial Monitoring Tools Market

The remote clinical trial monitoring tools market forecasting report includes the adoption lifecycle of the market, covering from the innovator’s stage to the laggard’s stage. It focuses on adoption rates in different regions based on penetration. Furthermore, the remote clinical trial monitoring tools market report also includes key purchase criteria and drivers of price sensitivity to help companies evaluate and develop their market growth analysis strategies.

Competitive Landscape of the Remote Clinical Trial Monitoring Tools Market

Companies are implementing various strategies, such as strategic alliances, partnerships, mergers and acquisitions, geographical expansion, and product/service launches, to enhance their presence in the remote clinical trial monitoring tools market industry.

Advarra Inc. - Offerings include eRegulatory and electronic data capture platforms with remote monitoring capabilities, document management features, and tools for real-time site performance tracking for clinical trial sponsors.

The industry research and growth report includes detailed analyses of the competitive landscape of the market and information about key companies, including:

  • Advarra Inc.
  • Anju Software Inc.
  • Castor Research Inc.
  • Cloudbyz Inc.
  • Ennov SAS
  • Florence Healthcare.
  • IQVIA Holdings Inc.
  • Medable Inc.
  • Medidata
  • Medrio Inc.
  • Merative L.P.
  • Microsoft Corp.
  • Obvio Health USA Inc.
  • OpenClinica LLC
  • Oracle Corp.
  • Salesforce Inc.
  • SAP SE
  • Signant Health
  • Veeva Systems Inc.
  • Zoom Video Communications Inc.

Qualitative and quantitative analysis of companies has been conducted to help clients understand the wider business environment as well as the strengths and weaknesses of key industry players. Data is qualitatively analyzed to categorize companies as pure play, category-focused, industry-focused, and diversified; it is quantitatively analyzed to categorize companies as dominant, leading, strong, tentative, and weak.

Recent Developments in the Remote Clinical Trial Monitoring Tools Market

  • In August 2025, the European Medicines Agency published a comprehensive reflection paper on using artificial intelligence in remote clinical trial monitoring, providing clear technical standards for software validation.
  • In October 2025, a leading technology provider specialized in clinical software introduced a machine learning module utilizing natural language processing to automate the reconciliation of remote source data.
  • In November 2025, an international regulatory consortium finalized new technical requirements for the interoperability of remote monitoring tools in multi-regional clinical trials, establishing a common architecture for secure data exchange.
  • In March 2025, a leading global provider of clinical trial software introduced a specialized analytics module that employs neural networks to predict site-level enrollment delays and potential protocol deviations.

Research Analyst Overview: Remote Clinical Trial Monitoring Tools Market

The remote clinical trial monitoring tools market is advancing beyond simple data collection toward intelligent, predictive oversight. Boardroom decisions on technology procurement are now heavily influenced by a platform's ability to integrate machine learning models for proactive risk detection, a capability that directly impacts trial timelines and budget adherence.

The adoption of risk-based monitoring frameworks, championed by bodies like the International Council for Harmonisation (ICH), necessitates tools with sophisticated analytical capabilities. We observe that platforms incorporating natural language processing to automate data reconciliation are gaining a competitive edge.

This technological shift is a response to the operational complexities of managing decentralized clinical trials and the sheer volume of data generated by wearable biosensors and other IoT devices. North America's market dominance, contributing over 41% to growth, underscores the value placed on these advanced features in a mature regulatory environment.

The focus is now on achieving seamless system interoperability and deploying generative AI to transform data verification workflows.

Dive into Technavio’s robust research methodology, blending expert interviews, extensive data synthesis, and validated models for unparalleled Remote Clinical Trial Monitoring Tools Market insights. See full methodology.

Request Free Sample

Market Scope
Page number 293
Base year 2025
Historic period 2020-2024
Forecast period 2026-2030
Growth momentum & CAGR Accelerate at a CAGR of 23.5%
Market growth 2026-2030 USD 5185.6 million
Market structure Fragmented
YoY growth 2025-2026(%) 19.0%
Key countries US, Canada, Mexico, Germany, UK, France, Italy, The Netherlands, Spain, Russia, China, India, Japan, South Korea, Indonesia, Thailand, Singapore, Australia, UAE, Brazil, South Africa, Saudi Arabia and Turkey
Competitive landscape Leading Companies, Market Positioning of Companies, Competitive Strategies, and Industry Risks

Remote Clinical Trial Monitoring Tools Market: Key Questions Answered in This Report

  • What is the expected growth of the Remote Clinical Trial Monitoring Tools Market between 2026 and 2030?

    • The Remote Clinical Trial Monitoring Tools Market is expected to grow by USD 5.19 billion during 2026-2030, registering a CAGR of 23.5%. Year-over-year growth in 2026 is estimated at 19.0%%. This acceleration is shaped by rise of decentralized and hybrid clinical trial models, which is intensifying demand across multiple end-use verticals covered in the report.

  • What segmentation does the market report cover?

    • The report is segmented by Component (Software, Hardware, and Services), End-user (Pharmaceutical and biotech companies, Contract research organizations, Healthcare IT and service providers, and Academic and research institutes), Deployment (Cloud based, and On premises) and Geography (North America, Europe, Asia, Rest of World (ROW)). Among these, the Software segment is estimated to witness significant growth during the forecast period, driven by rising adoption across key application areas. Each segment includes detailed qualitative and quantitative analysis, along with historical data from 2020-2024 and forecasts through 2030 with year-over-year growth rates.

  • Which regions are analyzed in the report?

    • The report covers North America, Europe, Asia and Rest of World (ROW). North America is estimated to contribute 41.7% to market growth during the forecast period. Country-level analysis includes US, Canada, Mexico, Germany, UK, France, Italy, The Netherlands, Spain, Russia, China, India, Japan, South Korea, Indonesia, Thailand, Singapore, Australia, UAE, Brazil, South Africa, Saudi Arabia and Turkey, with dedicated market size tables and year-over-year growth for each.

  • What are the key growth drivers and market challenges?

    • The primary driver is rise of decentralized and hybrid clinical trial models, which is accelerating investment and industry demand. The main challenge is data security and cybersecurity vulnerabilities, creating operational barriers for key market participants. The report quantifies the impact of each driver and challenge across 2026 and 2030 with comparative analysis.

  • Who are the major players in the Remote Clinical Trial Monitoring Tools Market?

    • Key vendors include Advarra Inc., Anju Software Inc., Castor Research Inc., Cloudbyz Inc., Ennov SAS, Florence Healthcare., IQVIA Holdings Inc., Medable Inc., Medidata, Medrio Inc., Merative L.P., Microsoft Corp., Obvio Health USA Inc., OpenClinica LLC, Oracle Corp., Salesforce Inc., SAP SE, Signant Health, Veeva Systems Inc. and Zoom Video Communications Inc.. The report provides qualitative and quantitative analysis categorizing companies as dominant, leading, strong, tentative, and weak based on their market positioning. Company profiles include business segment analysis, SWOT assessment, key offerings, and recent strategic developments.

Remote Clinical Trial Monitoring Tools Market Research Insights

The market's dynamics are shaped by procurement decision-makers prioritizing integrated platforms over fragmented point solutions to manage decentralized clinical trials. The increasing reliance on real-time data from wearable technology necessitates robust back-end systems that can handle high-frequency data streams for continuous patient monitoring.

In practice, a sponsor must ensure its chosen clinical monitoring platform adheres to the EU's Clinical Trials Regulation (CTR 536/2014) for multi-regional data exchange, a key vendor qualification criterion. This regulatory pressure, combined with the operational need to streamline data reconciliation workflows, drives investment in tools offering advanced analytics and automated query management.

The software segment's dominance highlights the strategic importance of scalable, cloud-based architectures in modernizing clinical oversight and ensuring data integrity across global study sites.

We can help! Our analysts can customize this remote clinical trial monitoring tools market research report to meet your requirements.

Get in touch

1. Executive Summary

1.1 Market overview

Executive Summary - Chart on Market Overview
Executive Summary - Data Table on Market Overview
Executive Summary - Chart on Global Market Characteristics
Executive Summary - Chart on Market by Geography
Executive Summary - Chart on Market Segmentation by Component
Executive Summary - Chart on Market Segmentation by End-user
Executive Summary - Chart on Market Segmentation by Deployment
Executive Summary - Chart on Incremental Growth
Executive Summary - Data Table on Incremental Growth
Executive Summary - Chart on Company Market Positioning

2. Technavio Analysis

2.1 Analysis of price sensitivity, lifecycle, customer purchase basket, adoption rates, and purchase criteria

2.2 Criticality of inputs and Factors of differentiation

Chart on Overview on criticality of inputs and factors of differentiation

2.3 Factors of disruption

Chart on Overview on factors of disruption

2.4 Impact of drivers and challenges

Chart on Impact of drivers and challenges in 2025 and 2030

3. Market Landscape

3.1 Market ecosystem

Chart on Parent Market
Data Table on - Parent Market

3.2 Market characteristics

Chart on Market characteristics analysis

3.3 Value chain analysis

Chart on Value chain analysis

4. Market Sizing

4.1 Market definition

Data Table on Offerings of companies included in the market definition

4.2 Market segment analysis

Market segments

4.3 Market size 2025

4.4 Market outlook: Forecast for 2025-2030

Chart on Global - Market size and forecast 2025-2030 ($ million)
Data Table on Global - Market size and forecast 2025-2030 ($ million)
Chart on Global Market: Year-over-year growth 2025-2030 (%)
Data Table on Global Market: Year-over-year growth 2025-2030 (%)

5. Historic Market Size

5.1 Global Remote Clinical Trial Monitoring Tools Market 2020 - 2024

Historic Market Size - Data Table on Global Remote Clinical Trial Monitoring Tools Market 2020 - 2024 ($ million)

5.2 Component segment analysis 2020 - 2024

Historic Market Size - Component Segment 2020 - 2024 ($ million)

5.3 End-user segment analysis 2020 - 2024

Historic Market Size - End-user Segment 2020 - 2024 ($ million)

5.4 Deployment segment analysis 2020 - 2024

Historic Market Size - Deployment Segment 2020 - 2024 ($ million)

5.5 Geography segment analysis 2020 - 2024

Historic Market Size - Geography Segment 2020 - 2024 ($ million)

5.6 Country segment analysis 2020 - 2024

Historic Market Size - Country Segment 2020 - 2024 ($ million)

6. Qualitative Analysis

6.1 Impact of AI on Global Remote Clinical Trial Monitoring Tools Market

7. Five Forces Analysis

7.1 Five forces summary

Five forces analysis - Comparison between 2025 and 2030

7.2 Bargaining power of buyers

Bargaining power of buyers - Impact of key factors 2025 and 2030

7.3 Bargaining power of suppliers

Bargaining power of suppliers - Impact of key factors in 2025 and 2030

7.4 Threat of new entrants

Threat of new entrants - Impact of key factors in 2025 and 2030

7.5 Threat of substitutes

Threat of substitutes - Impact of key factors in 2025 and 2030

7.6 Threat of rivalry

Threat of rivalry - Impact of key factors in 2025 and 2030

7.7 Market condition

Chart on Market condition - Five forces 2025 and 2030

8. Market Segmentation by Component

8.1 Market segments

Chart on Component - Market share 2025-2030 (%)
Data Table on Component - Market share 2025-2030 (%)

8.2 Comparison by Component

Chart on Comparison by Component
Data Table on Comparison by Component

8.3 Software - Market size and forecast 2025-2030

Chart on Software - Market size and forecast 2025-2030 ($ million)
Data Table on Software - Market size and forecast 2025-2030 ($ million)
Chart on Software - Year-over-year growth 2025-2030 (%)
Data Table on Software - Year-over-year growth 2025-2030 (%)

8.4 Hardware - Market size and forecast 2025-2030

Chart on Hardware - Market size and forecast 2025-2030 ($ million)
Data Table on Hardware - Market size and forecast 2025-2030 ($ million)
Chart on Hardware - Year-over-year growth 2025-2030 (%)
Data Table on Hardware - Year-over-year growth 2025-2030 (%)

8.5 Services - Market size and forecast 2025-2030

Chart on Services - Market size and forecast 2025-2030 ($ million)
Data Table on Services - Market size and forecast 2025-2030 ($ million)
Chart on Services - Year-over-year growth 2025-2030 (%)
Data Table on Services - Year-over-year growth 2025-2030 (%)

8.6 Market opportunity by Component

Market opportunity by Component ($ million)
Data Table on Market opportunity by Component ($ million)

9. Market Segmentation by End-user

9.1 Market segments

Chart on End-user - Market share 2025-2030 (%)
Data Table on End-user - Market share 2025-2030 (%)

9.2 Comparison by End-user

Chart on Comparison by End-user
Data Table on Comparison by End-user

9.3 Pharmaceutical and biotech companies - Market size and forecast 2025-2030

Chart on Pharmaceutical and biotech companies - Market size and forecast 2025-2030 ($ million)
Data Table on Pharmaceutical and biotech companies - Market size and forecast 2025-2030 ($ million)
Chart on Pharmaceutical and biotech companies - Year-over-year growth 2025-2030 (%)
Data Table on Pharmaceutical and biotech companies - Year-over-year growth 2025-2030 (%)

9.4 Contract research organizations - Market size and forecast 2025-2030

Chart on Contract research organizations - Market size and forecast 2025-2030 ($ million)
Data Table on Contract research organizations - Market size and forecast 2025-2030 ($ million)
Chart on Contract research organizations - Year-over-year growth 2025-2030 (%)
Data Table on Contract research organizations - Year-over-year growth 2025-2030 (%)

9.5 Healthcare IT and service providers - Market size and forecast 2025-2030

Chart on Healthcare IT and service providers - Market size and forecast 2025-2030 ($ million)
Data Table on Healthcare IT and service providers - Market size and forecast 2025-2030 ($ million)
Chart on Healthcare IT and service providers - Year-over-year growth 2025-2030 (%)
Data Table on Healthcare IT and service providers - Year-over-year growth 2025-2030 (%)

9.6 Academic and research institutes - Market size and forecast 2025-2030

Chart on Academic and research institutes - Market size and forecast 2025-2030 ($ million)
Data Table on Academic and research institutes - Market size and forecast 2025-2030 ($ million)
Chart on Academic and research institutes - Year-over-year growth 2025-2030 (%)
Data Table on Academic and research institutes - Year-over-year growth 2025-2030 (%)

9.7 Market opportunity by End-user

Market opportunity by End-user ($ million)
Data Table on Market opportunity by End-user ($ million)

10. Market Segmentation by Deployment

10.1 Market segments

Chart on Deployment - Market share 2025-2030 (%)
Data Table on Deployment - Market share 2025-2030 (%)

10.2 Comparison by Deployment

Chart on Comparison by Deployment
Data Table on Comparison by Deployment

10.3 Cloud based - Market size and forecast 2025-2030

Chart on Cloud based - Market size and forecast 2025-2030 ($ million)
Data Table on Cloud based - Market size and forecast 2025-2030 ($ million)
Chart on Cloud based - Year-over-year growth 2025-2030 (%)
Data Table on Cloud based - Year-over-year growth 2025-2030 (%)

10.4 On premises - Market size and forecast 2025-2030

Chart on On premises - Market size and forecast 2025-2030 ($ million)
Data Table on On premises - Market size and forecast 2025-2030 ($ million)
Chart on On premises - Year-over-year growth 2025-2030 (%)
Data Table on On premises - Year-over-year growth 2025-2030 (%)

10.5 Market opportunity by Deployment

Market opportunity by Deployment ($ million)
Data Table on Market opportunity by Deployment ($ million)

11. Customer Landscape

11.1 Customer landscape overview

Analysis of price sensitivity, lifecycle, customer purchase basket, adoption rates, and purchase criteria

12. Geographic Landscape

12.1 Geographic segmentation

Chart on Market share by geography 2025-2030 (%)
Data Table on Market share by geography 2025-2030 (%)

12.2 Geographic comparison

Chart on Geographic comparison
Data Table on Geographic comparison

12.3 North America - Market size and forecast 2025-2030

Chart on North America - Market size and forecast 2025-2030 ($ million)
Data Table on North America - Market size and forecast 2025-2030 ($ million)
Chart on North America - Year-over-year growth 2025-2030 (%)
Data Table on North America - Year-over-year growth 2025-2030 (%)
Chart on Regional Comparison - North America
Data Table on Regional Comparison - North America

12.3.1 US - Market size and forecast 2025-2030

Chart on US - Market size and forecast 2025-2030 ($ million)
Data Table on US - Market size and forecast 2025-2030 ($ million)
Chart on US - Year-over-year growth 2025-2030 (%)
Data Table on US - Year-over-year growth 2025-2030 (%)

12.3.2 Canada - Market size and forecast 2025-2030

Chart on Canada - Market size and forecast 2025-2030 ($ million)
Data Table on Canada - Market size and forecast 2025-2030 ($ million)
Chart on Canada - Year-over-year growth 2025-2030 (%)
Data Table on Canada - Year-over-year growth 2025-2030 (%)

12.3.3 Mexico - Market size and forecast 2025-2030

Chart on Mexico - Market size and forecast 2025-2030 ($ million)
Data Table on Mexico - Market size and forecast 2025-2030 ($ million)
Chart on Mexico - Year-over-year growth 2025-2030 (%)
Data Table on Mexico - Year-over-year growth 2025-2030 (%)

12.4 Europe - Market size and forecast 2025-2030

Chart on Europe - Market size and forecast 2025-2030 ($ million)
Data Table on Europe - Market size and forecast 2025-2030 ($ million)
Chart on Europe - Year-over-year growth 2025-2030 (%)
Data Table on Europe - Year-over-year growth 2025-2030 (%)
Chart on Regional Comparison - Europe
Data Table on Regional Comparison - Europe

12.4.1 Germany - Market size and forecast 2025-2030

Chart on Germany - Market size and forecast 2025-2030 ($ million)
Data Table on Germany - Market size and forecast 2025-2030 ($ million)
Chart on Germany - Year-over-year growth 2025-2030 (%)
Data Table on Germany - Year-over-year growth 2025-2030 (%)

12.4.2 UK - Market size and forecast 2025-2030

Chart on UK - Market size and forecast 2025-2030 ($ million)
Data Table on UK - Market size and forecast 2025-2030 ($ million)
Chart on UK - Year-over-year growth 2025-2030 (%)
Data Table on UK - Year-over-year growth 2025-2030 (%)

12.4.3 France - Market size and forecast 2025-2030

Chart on France - Market size and forecast 2025-2030 ($ million)
Data Table on France - Market size and forecast 2025-2030 ($ million)
Chart on France - Year-over-year growth 2025-2030 (%)
Data Table on France - Year-over-year growth 2025-2030 (%)

12.4.4 Italy - Market size and forecast 2025-2030

Chart on Italy - Market size and forecast 2025-2030 ($ million)
Data Table on Italy - Market size and forecast 2025-2030 ($ million)
Chart on Italy - Year-over-year growth 2025-2030 (%)
Data Table on Italy - Year-over-year growth 2025-2030 (%)

12.4.5 The Netherlands - Market size and forecast 2025-2030

Chart on The Netherlands - Market size and forecast 2025-2030 ($ million)
Data Table on The Netherlands - Market size and forecast 2025-2030 ($ million)
Chart on The Netherlands - Year-over-year growth 2025-2030 (%)
Data Table on The Netherlands - Year-over-year growth 2025-2030 (%)

12.4.6 Spain - Market size and forecast 2025-2030

Chart on Spain - Market size and forecast 2025-2030 ($ million)
Data Table on Spain - Market size and forecast 2025-2030 ($ million)
Chart on Spain - Year-over-year growth 2025-2030 (%)
Data Table on Spain - Year-over-year growth 2025-2030 (%)

12.4.7 Russia - Market size and forecast 2025-2030

Chart on Russia - Market size and forecast 2025-2030 ($ million)
Data Table on Russia - Market size and forecast 2025-2030 ($ million)
Chart on Russia - Year-over-year growth 2025-2030 (%)
Data Table on Russia - Year-over-year growth 2025-2030 (%)

12.5 Asia - Market size and forecast 2025-2030

Chart on Asia - Market size and forecast 2025-2030 ($ million)
Data Table on Asia - Market size and forecast 2025-2030 ($ million)
Chart on Asia - Year-over-year growth 2025-2030 (%)
Data Table on Asia - Year-over-year growth 2025-2030 (%)
Chart on Regional Comparison - Asia
Data Table on Regional Comparison - Asia

12.5.1 China - Market size and forecast 2025-2030

Chart on China - Market size and forecast 2025-2030 ($ million)
Data Table on China - Market size and forecast 2025-2030 ($ million)
Chart on China - Year-over-year growth 2025-2030 (%)
Data Table on China - Year-over-year growth 2025-2030 (%)

12.5.2 India - Market size and forecast 2025-2030

Chart on India - Market size and forecast 2025-2030 ($ million)
Data Table on India - Market size and forecast 2025-2030 ($ million)
Chart on India - Year-over-year growth 2025-2030 (%)
Data Table on India - Year-over-year growth 2025-2030 (%)

12.5.3 Japan - Market size and forecast 2025-2030

Chart on Japan - Market size and forecast 2025-2030 ($ million)
Data Table on Japan - Market size and forecast 2025-2030 ($ million)
Chart on Japan - Year-over-year growth 2025-2030 (%)
Data Table on Japan - Year-over-year growth 2025-2030 (%)

12.5.4 South Korea - Market size and forecast 2025-2030

Chart on South Korea - Market size and forecast 2025-2030 ($ million)
Data Table on South Korea - Market size and forecast 2025-2030 ($ million)
Chart on South Korea - Year-over-year growth 2025-2030 (%)
Data Table on South Korea - Year-over-year growth 2025-2030 (%)

12.5.5 Indonesia - Market size and forecast 2025-2030

Chart on Indonesia - Market size and forecast 2025-2030 ($ million)
Data Table on Indonesia - Market size and forecast 2025-2030 ($ million)
Chart on Indonesia - Year-over-year growth 2025-2030 (%)
Data Table on Indonesia - Year-over-year growth 2025-2030 (%)

12.5.6 Thailand - Market size and forecast 2025-2030

Chart on Thailand - Market size and forecast 2025-2030 ($ million)
Data Table on Thailand - Market size and forecast 2025-2030 ($ million)
Chart on Thailand - Year-over-year growth 2025-2030 (%)
Data Table on Thailand - Year-over-year growth 2025-2030 (%)

12.5.7 Singapore - Market size and forecast 2025-2030

Chart on Singapore - Market size and forecast 2025-2030 ($ million)
Data Table on Singapore - Market size and forecast 2025-2030 ($ million)
Chart on Singapore - Year-over-year growth 2025-2030 (%)
Data Table on Singapore - Year-over-year growth 2025-2030 (%)

12.6 Rest of World (ROW) - Market size and forecast 2025-2030

Chart on Rest of World (ROW) - Market size and forecast 2025-2030 ($ million)
Data Table on Rest of World (ROW) - Market size and forecast 2025-2030 ($ million)
Chart on Rest of World (ROW) - Year-over-year growth 2025-2030 (%)
Data Table on Rest of World (ROW) - Year-over-year growth 2025-2030 (%)
Chart on Regional Comparison - Rest of World (ROW)
Data Table on Regional Comparison - Rest of World (ROW)

12.6.1 Australia - Market size and forecast 2025-2030

Chart on Australia - Market size and forecast 2025-2030 ($ million)
Data Table on Australia - Market size and forecast 2025-2030 ($ million)
Chart on Australia - Year-over-year growth 2025-2030 (%)
Data Table on Australia - Year-over-year growth 2025-2030 (%)

12.6.2 UAE - Market size and forecast 2025-2030

Chart on UAE - Market size and forecast 2025-2030 ($ million)
Data Table on UAE - Market size and forecast 2025-2030 ($ million)
Chart on UAE - Year-over-year growth 2025-2030 (%)
Data Table on UAE - Year-over-year growth 2025-2030 (%)

12.6.3 Brazil - Market size and forecast 2025-2030

Chart on Brazil - Market size and forecast 2025-2030 ($ million)
Data Table on Brazil - Market size and forecast 2025-2030 ($ million)
Chart on Brazil - Year-over-year growth 2025-2030 (%)
Data Table on Brazil - Year-over-year growth 2025-2030 (%)

12.6.4 South Africa - Market size and forecast 2025-2030

Chart on South Africa - Market size and forecast 2025-2030 ($ million)
Data Table on South Africa - Market size and forecast 2025-2030 ($ million)
Chart on South Africa - Year-over-year growth 2025-2030 (%)
Data Table on South Africa - Year-over-year growth 2025-2030 (%)

12.6.5 Saudi Arabia - Market size and forecast 2025-2030

Chart on Saudi Arabia - Market size and forecast 2025-2030 ($ million)
Data Table on Saudi Arabia - Market size and forecast 2025-2030 ($ million)
Chart on Saudi Arabia - Year-over-year growth 2025-2030 (%)
Data Table on Saudi Arabia - Year-over-year growth 2025-2030 (%)

12.6.6 Turkey - Market size and forecast 2025-2030

Chart on Turkey - Market size and forecast 2025-2030 ($ million)
Data Table on Turkey - Market size and forecast 2025-2030 ($ million)
Chart on Turkey - Year-over-year growth 2025-2030 (%)
Data Table on Turkey - Year-over-year growth 2025-2030 (%)

12.7 Market opportunity by geography

Market opportunity by geography ($ million)
Data Tables on Market opportunity by geography ($ million)

13. Drivers, Challenges, and Opportunity

13.1 Market drivers

Rise of decentralized and hybrid clinical trial models
Evolving frameworks and emphasis on risk-based monitoring
Technological integration of AI and cloud computing

13.2 Market challenges

Data security and cybersecurity vulnerabilities
Interoperability and system integration complexity
Regulatory heterogeneity and site-level implementation barriers

13.3 Impact of drivers and challenges

Impact of drivers and challenges in 2025 and 2030

13.4 Market opportunities

Integration of predictive analytics and ML in monitoring
Proliferation of wearable technology and continuous patient monitoring
Standardization of remote source data verification and interoperability

14. Competitive Landscape

14.1 Overview

14.2

Overview on criticality of inputs and factors of differentiation

14.3 Landscape disruption

Overview on factors of disruption

14.4 Industry risks

Impact of key risks on business

15. Competitive Analysis

15.1 Companies profiled

Companies covered

15.2 Company ranking index

15.3 Market positioning of companies

Matrix on companies position and classification

15.4 Advarra Inc.

Advarra Inc. - Overview
Advarra Inc. - Product / Service
Advarra Inc. - Key offerings
SWOT

15.5 Anju Software Inc.

Anju Software Inc. - Overview
Anju Software Inc. - Product / Service
Anju Software Inc. - Key offerings
SWOT

15.6 Castor Research Inc.

Castor Research Inc. - Overview
Castor Research Inc. - Product / Service
Castor Research Inc. - Key offerings
SWOT

15.7 Cloudbyz Inc.

Cloudbyz Inc. - Overview
Cloudbyz Inc. - Product / Service
Cloudbyz Inc. - Key offerings
SWOT

15.8 Ennov SAS

Ennov SAS - Overview
Ennov SAS - Product / Service
Ennov SAS - Key offerings
SWOT

15.9 Florence Healthcare.

Florence Healthcare. - Overview
Florence Healthcare. - Product / Service
Florence Healthcare. - Key offerings
SWOT

15.10 IQVIA Holdings Inc.

IQVIA Holdings Inc. - Overview
IQVIA Holdings Inc. - Business segments
IQVIA Holdings Inc. - Key offerings
IQVIA Holdings Inc. - Segment focus
SWOT

15.11 Medable Inc.

Medable Inc. - Overview
Medable Inc. - Product / Service
Medable Inc. - Key offerings
SWOT

15.12 Medidata

Medidata - Overview
Medidata - Product / Service
Medidata - Key offerings
SWOT

15.13 Medrio Inc.

Medrio Inc. - Overview
Medrio Inc. - Product / Service
Medrio Inc. - Key offerings
SWOT

15.14 Merative L.P.

Merative L.P. - Overview
Merative L.P. - Product / Service
Merative L.P. - Key offerings
SWOT

15.15 Microsoft Corp.

Microsoft Corp. - Overview
Microsoft Corp. - Business segments
Microsoft Corp. - Key news
Microsoft Corp. - Key offerings
Microsoft Corp. - Segment focus
SWOT

15.16 Obvio Health USA Inc.

Obvio Health USA Inc. - Overview
Obvio Health USA Inc. - Product / Service
Obvio Health USA Inc. - Key offerings
SWOT

15.17 OpenClinica LLC

OpenClinica LLC - Overview
OpenClinica LLC - Product / Service
OpenClinica LLC - Key offerings
SWOT

15.18 Oracle Corp.

Oracle Corp. - Overview
Oracle Corp. - Business segments
Oracle Corp. - Key news
Oracle Corp. - Key offerings
Oracle Corp. - Segment focus
SWOT

16. Appendix

16.1 Scope of the report

Market definition
Objectives
Notes and caveats

16.2 Inclusions and exclusions checklist

Inclusions checklist
Exclusions checklist

16.3 Currency conversion rates for US$

16.4 Research methodology

16.5 Data procurement

Information sources

16.6 Data validation

16.7 Validation techniques employed for market sizing

16.8 Data synthesis

16.9 360 degree market analysis

16.10 List of abbreviations

Research Methodology

Technavio presents a detailed picture of the market by way of study, synthesis, and summation of data from multiple sources. The analysts have presented the various facets of the market with a particular focus on identifying the key industry influencers. The data thus presented is comprehensive, reliable, and the result of extensive research, both primary and secondary.

INFORMATION SOURCES

Primary sources

  • Manufacturers and suppliers
  • Channel partners
  • Industry experts
  • Strategic decision makers

Secondary sources

  • Industry journals and periodicals
  • Government data
  • Financial reports of key industry players
  • Historical data
  • Press releases

DATA ANALYSIS

Data Synthesis

  • Collation of data
  • Estimation of key figures
  • Analysis of derived insights

Data Validation

  • Triangulation with data models
  • Reference against proprietary databases
  • Corroboration with industry experts

REPORT WRITING

Qualitative

  • Market drivers
  • Market challenges
  • Market trends
  • Five forces analysis

Quantitative

  • Market size and forecast
  • Market segmentation
  • Geographical insights
  • Competitive landscape

Interested in this report?

Get your sample now to see our research methodology and insights!

Download Now

Frequently Asked Questions

Remote Clinical Trial Monitoring Tools market growth will increase by USD 5185.6 million during 2026-2030.

The Remote Clinical Trial Monitoring Tools market is expected to grow at a CAGR of 23.5% during 2026-2030.

Remote Clinical Trial Monitoring Tools market is segmented by Component (Software, Hardware, Services) End-user (Pharmaceutical and biotech companies, Contract research organizations, Healthcare IT and service providers, Academic and research institutes) Deployment (Cloud based, On premises)

Advarra Inc., Anju Software Inc., Castor Research Inc., Cloudbyz Inc., Ennov SAS, Florence Healthcare., IQVIA Holdings Inc., Medable Inc., Medidata, Medrio Inc., Merative L.P., Microsoft Corp., Obvio Health USA Inc., OpenClinica LLC, Oracle Corp., Salesforce Inc., SAP SE, Signant Health, Veeva Systems Inc., Zoom Video Communications Inc. are a few of the key vendors in the Remote Clinical Trial Monitoring Tools market.

North America will register the highest growth rate of 41.7% among the other regions. Therefore, the Remote Clinical Trial Monitoring Tools market in North America is expected to garner significant business opportunities for the vendors during the forecast period.

US, Canada, Mexico, Germany, UK, France, Italy, The Netherlands, Spain, Russia, China, India, Japan, South Korea, Indonesia, Thailand, Singapore, Australia, UAE, Brazil, South Africa, Saudi Arabia, Turkey

  • Rise of decentralized and hybrid clinical trial models is the driving factor this market.

The Remote Clinical Trial Monitoring Tools market vendors should focus on grabbing business opportunities from the Component segment as it accounted for the largest market share in the base year.
RIA - Research AI Assistant
Ask RIA