Refrigerants Market Analysis, Size, and Forecast 2026-2030: APAC (China, India, and Japan), North America (US, Canada, and Mexico), Europe (Germany, UK, and France), Middle East and Africa (Saudi Arabia, UAE, and South Africa), South America (Brazil, Argentina, and Colombia), and Rest of World (ROW)

Refrigerants Market Analysis, Size, and Forecast 2026-2030:
APAC (China, India, and Japan), North America (US, Canada, and Mexico), Europe (Germany, UK, and France), Middle East and Africa (Saudi Arabia, UAE, and South Africa), South America (Brazil, Argentina, and Colombia), and Rest of World (ROW)

Published: May 2026 311 Pages SKU: IRTNTR81307

Market Overview at a Glance

$2.88 B
Market Opportunity
6.7%
CAGR 2025 - 2030
46.8%
APAC Growth
$3.61 B
HFC and blends segment 2024

Refrigerants Market Size and Growth Forecast 2026-2030

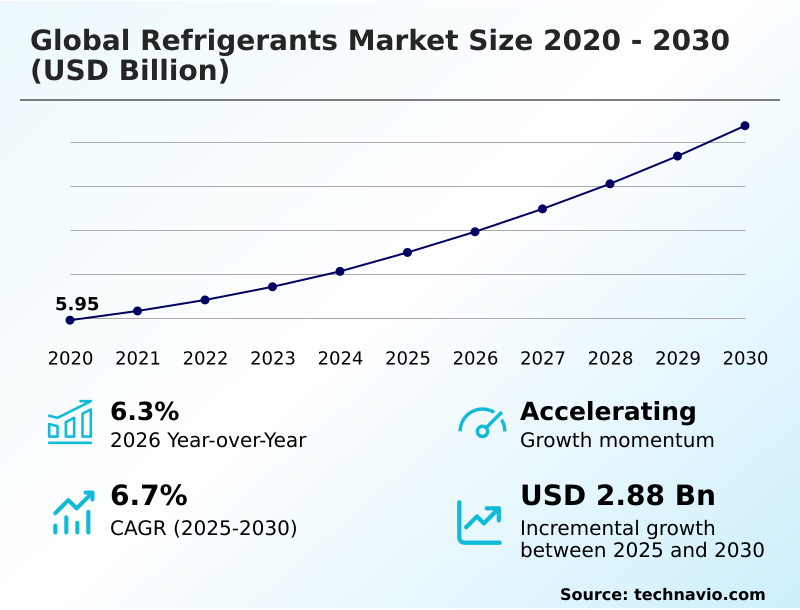
The Refrigerants Market size was valued at USD 7.49 billion in 2025 growing at a CAGR of 6.7% during the forecast period 2026-2030.

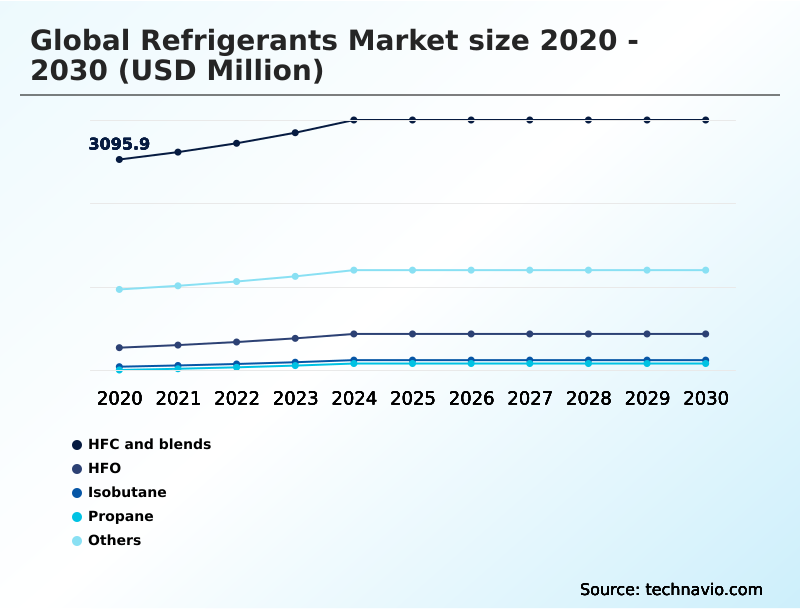
APAC accounts for 46.8% of incremental growth during the forecast period. The HFC and blends segment by Product was valued at USD 3.61 billion in 2024, while the Refrigeration system segment holds the largest revenue share by Application.

The market is projected to grow by USD 4.42 billion from 2020 to 2030, with USD 2.88 billion of the growth expected during the forecast period of 2025 to 2030.

Get Key Insights on Market Forecast (PDF) Request Free Sample

Refrigerants Market Overview

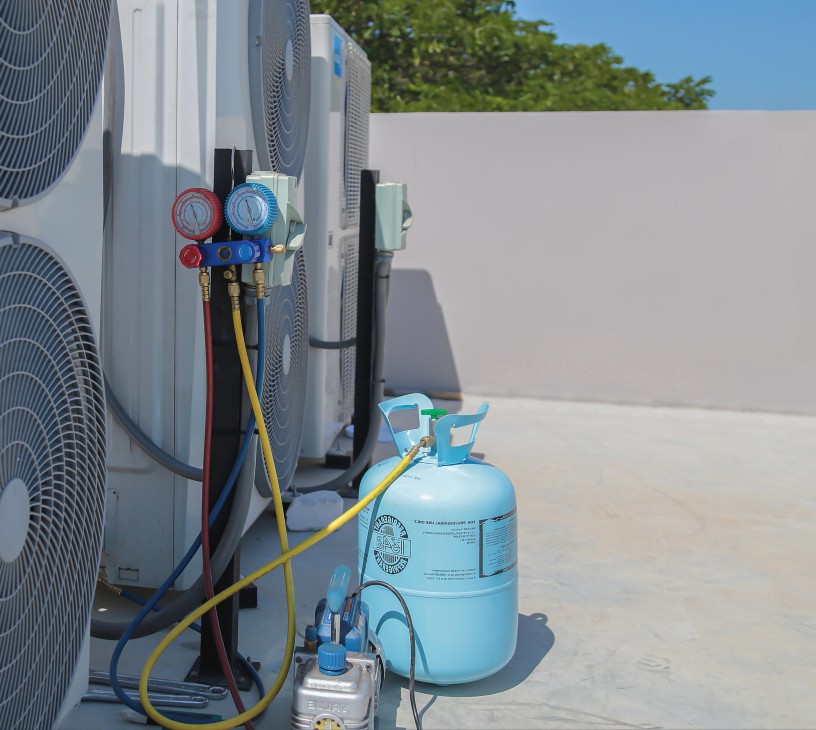
The refrigerants market is undergoing a technology-driven transformation, compelled by global HFC phase-down schedules that mandate a shift toward low-GWP refrigerants. This transition affects the entire vapor compression cycle, impacting equipment design, lubricant compatibility, and service practices for all HVACR systems. The APAC region is central to this dynamic, contributing nearly 47% of the market's incremental growth, fueled by industrialization and the expansion of cold chain logistics. In practice, a large supermarket chain making a capital expenditure decision must now evaluate the total cost of ownership of a transcritical CO2 system against a solution using A2L refrigerants, considering factors like energy efficiency, maintenance expertise for high-pressure systems, and compliance with ASHRAE Standard 34. This choice impacts not just upfront cost but also the long-term refrigerant management plan and adherence to evolving green building standards. The focus on refrigerant reclamation and end-of-life recovery further complicates the supply chain, creating new value streams.

Drivers, Trends, and Challenges in the Refrigerants Market

Strategic decisions in the refrigerants market are increasingly governed by the HFC phase-down impact on HVAC operations and long-term asset management. For facility managers in the food retail sector, compliance with regulations like the EU F-Gas Regulation necessitates a move away from legacy systems.

The choice between technologies such as CO2 refrigeration in food retail and systems designed for propane R-290 in commercial refrigeration involves a complex analysis of capital expenditure, energy efficiency of natural refrigerants, and technician training for A2L refrigerant safety standard compliance.

For instance, while HFO-1234yf for automotive AC systems offers a GWP of less than 1, a significant improvement over its predecessor, implementing it required substantial changes in mobile air conditioning design. Similarly, selecting low GWP alternatives for R-410A in residential units requires careful evaluation.

The expansion of refrigerant reclamation and recycling programs offers a method to manage existing assets, while the use of ammonia for industrial cold storage remains a highly efficient, albeit safety-intensive, option. Ultimately, creating a digital twin for refrigerant management is becoming essential for tracking assets and ensuring compliance across a diverse portfolio.

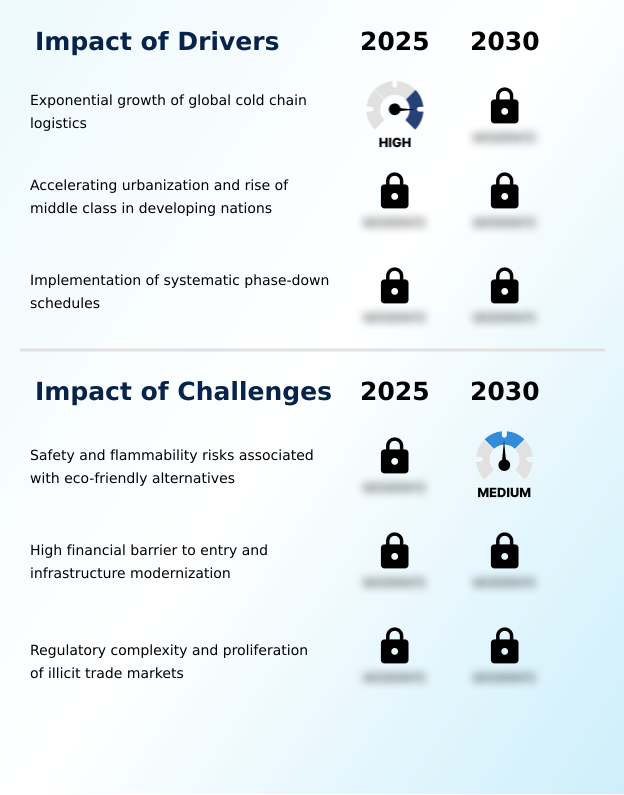
Primary Growth Driver: The exponential growth of global cold chain logistics, driven by demand for perishable goods and pharmaceuticals, is a key driver for the refrigerants market.

Market growth is propelled by a convergence of regulatory mandates and macroeconomic shifts. The implementation of systematic phase-down schedules under the Kigali Amendment acts as a forcing function, compelling the industry to abandon high-GWP HFC refrigerants.

This regulatory push is amplified by the rapid expansion of global cold chain logistics, essential for the food and pharmaceutical sectors.

Concurrently, accelerating urbanization in developing nations, particularly in the APAC region which is growing at 7.6% annually, fuels demand for residential and commercial air conditioning.

This creates a powerful, sustained need for new cooling capacity, from large-scale district cooling projects in new urban developments to the proliferation of mobile air conditioning (MAC) in an expanding global vehicle fleet.

Emerging Market Trend: The proliferation of natural and ultra-low global warming potential substances is a defining market trend. This shift is driven by regulatory mandates and a growing emphasis on sustainable cooling solutions.

The market is advancing beyond chemical innovation, with digitalization emerging as a transformative trend. The integration of IoT sensors and AI-powered analytics enables predictive maintenance, shifting from reactive repairs to proactive management of HVACR systems. This technology is critical for early refrigerant leak detection, which addresses a major source of both environmental impact and operational cost.

Digital platforms now allow for sophisticated system performance monitoring and refrigerant charging optimization, ensuring that equipment runs at its peak energy efficiency ratio (EER). Furthermore, these tools are vital for executing a robust refrigerant management plan, automating the tracking required for regulatory compliance under frameworks like the F-Gas regulation.

This move toward smart systems enhances reliability and extends asset lifespan, fundamentally altering the service and maintenance landscape.

Key Industry Challenge: Safety and flammability risks associated with many eco-friendly alternative refrigerants present a significant challenge, requiring new standards and technician training.

A primary challenge restraining market adoption of next-generation refrigerants is the flammability risk assessment associated with many low-GWP alternatives. The use of A2L and A3 refrigerants, such as propane, necessitates a comprehensive overhaul of building codes and safety standards, alongside significant investment in technician training to handle high-pressure systems safely.

This is compounded by the high capital expenditure required for refrigerant retrofitting or the deployment of entirely new infrastructures like transcritical CO2 systems, a significant barrier for many businesses.

Furthermore, the fragmented global regulatory landscape, with varying phase-down schedules, complicates supply chain management for multinational corporations and creates opportunities for the illicit trade of banned substances, undermining environmental goals and posing safety risks from non-compliant products.

Explore Full Market Dynamics Analysis Request Free Sample

Refrigerants Market Segmentation

The refrigerants industry research report provides comprehensive data including region-wise segment analysis, with forecasts and analysis for the period 2026-2030, as well as historical data from 2020-2024 for the following segments.

Market Segment by Product
  • HFC and blends
  • HFO
  • Isobutane
  • Propane
  • Others
Market Segment by Application
  • Refrigeration system
  • Air conditioning system
  • Chillers
  • Mobile air conditioning
Market Segment by End-user
  • Commercial refrigeration
  • Residential refrigeration
  • Industrial refrigeration
  • Transportation refrigeration
Market Segment by Geography
APAC
China, India, Japan, South Korea, Australia, Indonesia
North America
US, Canada, Mexico
Europe
Germany, UK, France, Italy, The Netherlands, Spain
Middle East and Africa
Saudi Arabia, UAE, South Africa, Israel, Turkey
South America
Brazil, Argentina, Colombia

Product Segment Analysis

The hfc and blends segment is estimated to witness significant growth during the forecast period.

The hydrofluorocarbons (HFCs) and blends segment is navigating a critical transition shaped by global phase-down schedules.

While HFC refrigerants still represent the largest component of the installed base in existing HVACR systems, their high Global Warming Potential (GWP) has triggered stringent regulatory actions under frameworks like the Kigali Amendment.

This creates a bifurcated market reality for procurement decision-makers, balancing the ongoing service needs of legacy equipment against the capital investment required for refrigerant retrofitting or full system replacement.

The focus is shifting towards managing the remaining lifecycle of these systems as the availability of virgin HFCs diminishes, driving up service costs and making the total cost of ownership for older assets a primary concern.

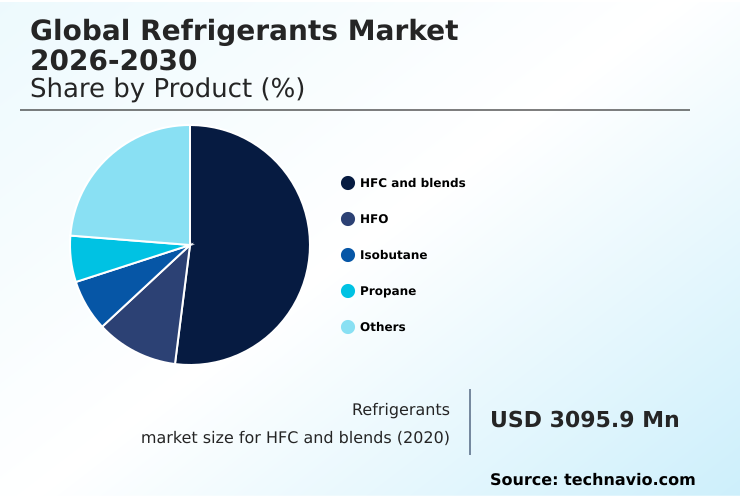
The HFC and blends segment was valued at USD 3.61 billion in 2024 and showed a gradual increase during the forecast period.

Refrigerants Market by Region: APAC Leads with 46.8% Growth Share

APAC is estimated to contribute 46.8% to the growth of the global market during the forecast period.

The geographic landscape is dominated by the APAC region, which is projected to contribute approximately 47% of the market's incremental growth.

This expansion is powered by rapid urbanization and industrial development in countries like China and India, driving demand for both commercial and residential HVACR systems.

In contrast to mature markets focused on refrigerant retrofitting, APAC's growth is largely from new installations, including district cooling projects and the build-out of cold chain logistics to support food and pharmaceutical supply chains.

Regional policies such as India's Cooling Action Plan are shaping technology choices, encouraging the adoption of refrigerants with a lower global warming potential.

The region's manufacturing prowess also makes it a central hub for producing both cooling equipment and thermally conductive materials, influencing global supply chain stability.

Customer Landscape Analysis for the Refrigerants Market

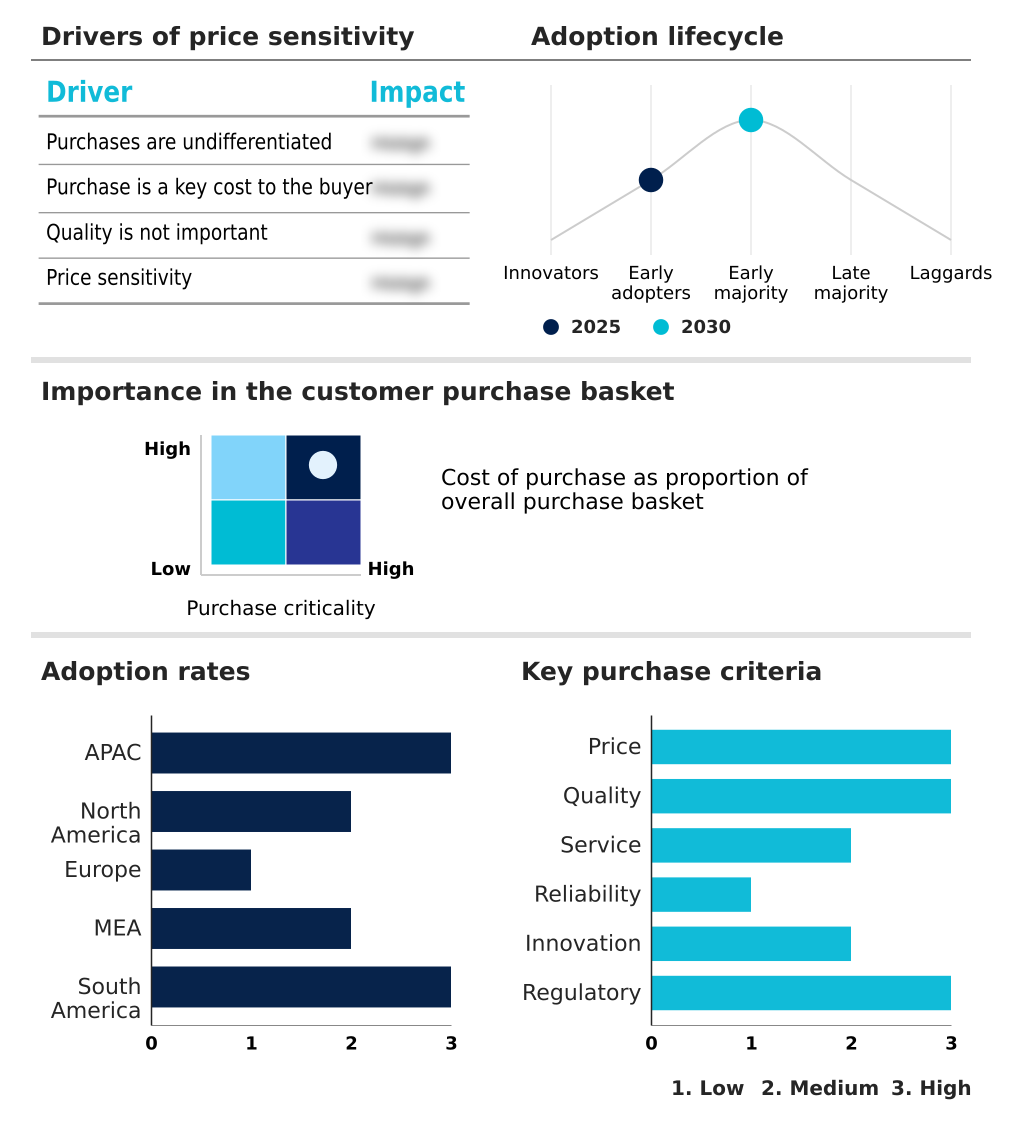
The refrigerants market forecasting report includes the adoption lifecycle of the market, covering from the innovator’s stage to the laggard’s stage. It focuses on adoption rates in different regions based on penetration. Furthermore, the refrigerants market report also includes key purchase criteria and drivers of price sensitivity to help companies evaluate and develop their market growth analysis strategies.

Competitive Landscape of the Refrigerants Market

Companies are implementing various strategies, such as strategic alliances, partnerships, mergers and acquisitions, geographical expansion, and product/service launches, to enhance their presence in the refrigerants market industry.

A Gas International Ltd. - Key offerings center on low-GWP HFO refrigerants, providing advanced thermal management solutions engineered to meet stringent environmental regulations and enhance system efficiency.

The industry research and growth report includes detailed analyses of the competitive landscape of the market and information about key companies, including:

  • A Gas International Ltd.
  • AGC Inc.
  • Air Liquide SA
  • Arkema Group
  • Daikin Industries Ltd.
  • Dongyue Group Ltd.
  • Gujarat Fluorochemicals Ltd.
  • Harp International Ltd.
  • Honeywell International Inc.
  • Hudson Technologies, Inc.
  • Linde Plc
  • National Refrigerants Inc.
  • Orbia
  • Resonac Holdings Corp.
  • Sinochem Hong Kong (Group) Co., Ltd
  • SRF Ltd.
  • Tazzetti Spa
  • The Chemours Co.
  • Trane Technologies Plc
  • WEITRON Inc.

Qualitative and quantitative analysis of companies has been conducted to help clients understand the wider business environment as well as the strengths and weaknesses of key industry players. Data is qualitatively analyzed to categorize companies as pure play, category-focused, industry-focused, and diversified; it is quantitatively analyzed to categorize companies as dominant, leading, strong, tentative, and weak.

Recent Developments in the Refrigerants Market

  • In November 2024, Honeywell International Inc. announced a strategic partnership with a leading automotive OEM to supply its Solstice yf (HFO-1234yf) refrigerant for a new line of electric vehicles, ensuring compliance with EPA regulations under the AIM Act.
  • In February 2025, Taiwan's Ministry of Environment released two official notices implementing Regulations on Hydrofluorocarbons (HFCs) Management, establishing categories of HFCs that are prohibited or restricted from being manufactured, imported, sold, or used.
  • In March 2025, A-Gas completed the acquisition of Refrigerant Services Inc., a prominent Canadian refrigerant services company, thereby expanding its refrigerant recovery and reclamation capacity in North America.
  • In May 2025, Daikin Industries Ltd. announced a USD 100 million investment to expand its R&D facility in Osaka, Japan, focused on developing next-generation heat pump systems using low-GWP refrigerants like R-32 and new HFO blends.

Research Analyst Overview: Refrigerants Market

The operational reality of the refrigerants market is defined by a fundamental tension: managing a vast installed base of equipment designed for HFC refrigerants while navigating a mandatory transition to low-GWP alternatives.

This creates a critical boardroom-level decision concerning capital allocation—investing in new, compliant HVACR systems and heat pump systems versus managing the rising operational costs of servicing legacy equipment with quota-restricted gases. The classification of A2L refrigerants and A3 refrigerants under ASHRAE Standard 34 introduces new flammability risk assessments into facility design and insurance considerations.

For example, while HFO refrigerants offer a viable path forward, their deployment in centrifugal chillers and screw chillers requires specific training and handling protocols.

With the HFC and blends segment still accounting for a major share of the market, the growth of refrigerant reclamation infrastructure is essential to support the service life of existing assets without violating phase-down schedules, impacting everything from mobile air conditioning (MAC) to industrial ammonia refrigeration.

Dive into Technavio’s robust research methodology, blending expert interviews, extensive data synthesis, and validated models for unparalleled Refrigerants Market insights. See full methodology.

Request Free Sample

Market Scope
Page number 311
Base year 2025
Historic period 2020-2024
Forecast period 2026-2030
Growth momentum & CAGR Accelerate at a CAGR of 6.7%
Market growth 2026-2030 USD 2879.2 million
Market structure Fragmented
YoY growth 2025-2026(%) 6.3%
Key countries China, India, Japan, South Korea, Australia, Indonesia, US, Canada, Mexico, Germany, UK, France, Italy, The Netherlands, Spain, Saudi Arabia, UAE, South Africa, Israel, Turkey, Brazil, Argentina and Colombia
Competitive landscape Leading Companies, Market Positioning of Companies, Competitive Strategies, and Industry Risks

Refrigerants Market: Key Questions Answered in This Report

  • What is the expected growth of the Refrigerants Market between 2026 and 2030?

    • The Refrigerants Market is expected to grow by USD 2.88 billion during 2026-2030, registering a CAGR of 6.7%. Year-over-year growth in 2026 is estimated at 6.3%%. This acceleration is shaped by exponential growth of global cold chain logistics, which is intensifying demand across multiple end-use verticals covered in the report.

  • What segmentation does the market report cover?

    • The report is segmented by Product (HFC and blends, HFO, Isobutane, Propane, and Others), Application (Refrigeration system, Air Conditioning system, Chillers, and Mobile air conditioning), End-user (Commercial refrigeration, Residential refrigeration, Industrial refrigeration, and Transportation refrigeration) and Geography (APAC, North America, Europe, Middle East and Africa, South America). Among these, the HFC and blends segment is estimated to witness significant growth during the forecast period, driven by rising adoption across key application areas. Each segment includes detailed qualitative and quantitative analysis, along with historical data from 2020-2024 and forecasts through 2030 with year-over-year growth rates.

  • Which regions are analyzed in the report?

    • The report covers APAC, North America, Europe, Middle East and Africa and South America. APAC is estimated to contribute 46.8% to market growth during the forecast period. Country-level analysis includes China, India, Japan, South Korea, Australia, Indonesia, US, Canada, Mexico, Germany, UK, France, Italy, The Netherlands, Spain, Saudi Arabia, UAE, South Africa, Israel, Turkey, Brazil, Argentina and Colombia, with dedicated market size tables and year-over-year growth for each.

  • What are the key growth drivers and market challenges?

    • The primary driver is exponential growth of global cold chain logistics, which is accelerating investment and industry demand. The main challenge is safety and flammability risks associated with eco-friendly alternatives, creating operational barriers for key market participants. The report quantifies the impact of each driver and challenge across 2026 and 2030 with comparative analysis.

  • Who are the major players in the Refrigerants Market?

    • Key vendors include A Gas International Ltd., AGC Inc., Air Liquide SA, Arkema Group, Daikin Industries Ltd., Dongyue Group Ltd., Gujarat Fluorochemicals Ltd., Harp International Ltd., Honeywell International Inc., Hudson Technologies, Inc., Linde Plc, National Refrigerants Inc., Orbia, Resonac Holdings Corp., Sinochem Hong Kong (Group) Co., Ltd, SRF Ltd., Tazzetti Spa, The Chemours Co., Trane Technologies Plc and WEITRON Inc.. The report provides qualitative and quantitative analysis categorizing companies as dominant, leading, strong, tentative, and weak based on their market positioning. Company profiles include business segment analysis, SWOT assessment, key offerings, and recent strategic developments.

Refrigerants Market Research Insights

Market dynamics are dictated by the interplay between regulatory mandates and technology readiness. The Kigali Amendment compliance framework sets the overarching pace, but regional enforcement, such as the EU's F-Gas regulation and the EPA AIM Act in the US, creates distinct market conditions.

This regulatory pressure accelerates the transition away from high-GWP substances, influencing total cost of ownership calculations for new equipment. For instance, the rapid adoption of low-GWP refrigerants in Europe contrasts with the high-volume growth in APAC, which accounts for over 46% of the market's incremental growth, driven by new construction rather than retrofitting.

This divergence requires a nuanced approach to supply chain management and product strategy, balancing the need for innovative thermal management solutions with the practicalities of lubricant compatibility and refrigerant retrofitting in diverse economic environments.

We can help! Our analysts can customize this refrigerants market research report to meet your requirements.

Get in touch

1. Executive Summary

1.1 Market overview

Executive Summary - Chart on Market Overview
Executive Summary - Data Table on Market Overview
Executive Summary - Chart on Global Market Characteristics
Executive Summary - Chart on Market by Geography
Executive Summary - Chart on Market Segmentation by Product
Executive Summary - Chart on Market Segmentation by Application
Executive Summary - Chart on Market Segmentation by End-user
Executive Summary - Chart on Incremental Growth
Executive Summary - Data Table on Incremental Growth
Executive Summary - Chart on Company Market Positioning

2. Technavio Analysis

2.1 Analysis of price sensitivity, lifecycle, customer purchase basket, adoption rates, and purchase criteria

2.2 Criticality of inputs and Factors of differentiation

Chart on Overview on criticality of inputs and factors of differentiation

2.3 Factors of disruption

Chart on Overview on factors of disruption

2.4 Impact of drivers and challenges

Chart on Impact of drivers and challenges in 2025 and 2030

3. Market Landscape

3.1 Market ecosystem

Chart on Parent Market
Data Table on - Parent Market

3.2 Market characteristics

Chart on Market characteristics analysis

3.3 Value chain analysis

Chart on Value chain analysis

4. Market Sizing

4.1 Market definition

Data Table on Offerings of companies included in the market definition

4.2 Market segment analysis

Market segments

4.3 Market size 2025

4.4 Market outlook: Forecast for 2025-2030

Chart on Global - Market size and forecast 2025-2030 ($ million)
Data Table on Global - Market size and forecast 2025-2030 ($ million)
Chart on Global Market: Year-over-year growth 2025-2030 (%)
Data Table on Global Market: Year-over-year growth 2025-2030 (%)

5. Historic Market Size

5.1 Global Refrigerants Market 2020 - 2024

Historic Market Size - Data Table on Global Refrigerants Market 2020 - 2024 ($ million)

5.2 Product segment analysis 2020 - 2024

Historic Market Size - Product Segment 2020 - 2024 ($ million)

5.3 Application segment analysis 2020 - 2024

Historic Market Size - Application Segment 2020 - 2024 ($ million)

5.4 End-user segment analysis 2020 - 2024

Historic Market Size - End-user Segment 2020 - 2024 ($ million)

5.5 Geography segment analysis 2020 - 2024

Historic Market Size - Geography Segment 2020 - 2024 ($ million)

5.6 Country segment analysis 2020 - 2024

Historic Market Size - Country Segment 2020 - 2024 ($ million)

6. Qualitative Analysis

6.1 Impact of AI on Global Refrigerants Market

7. Five Forces Analysis

7.1 Five forces summary

Five forces analysis - Comparison between 2025 and 2030

7.2 Bargaining power of buyers

Bargaining power of buyers - Impact of key factors 2025 and 2030

7.3 Bargaining power of suppliers

Bargaining power of suppliers - Impact of key factors in 2025 and 2030

7.4 Threat of new entrants

Threat of new entrants - Impact of key factors in 2025 and 2030

7.5 Threat of substitutes

Threat of substitutes - Impact of key factors in 2025 and 2030

7.6 Threat of rivalry

Threat of rivalry - Impact of key factors in 2025 and 2030

7.7 Market condition

Chart on Market condition - Five forces 2025 and 2030

8. Market Segmentation by Product

8.1 Market segments

Chart on Product - Market share 2025-2030 (%)
Data Table on Product - Market share 2025-2030 (%)

8.2 Comparison by Product

Chart on Comparison by Product
Data Table on Comparison by Product

8.3 HFC and blends - Market size and forecast 2025-2030

Chart on HFC and blends - Market size and forecast 2025-2030 ($ million)
Data Table on HFC and blends - Market size and forecast 2025-2030 ($ million)
Chart on HFC and blends - Year-over-year growth 2025-2030 (%)
Data Table on HFC and blends - Year-over-year growth 2025-2030 (%)

8.4 HFO - Market size and forecast 2025-2030

Chart on HFO - Market size and forecast 2025-2030 ($ million)
Data Table on HFO - Market size and forecast 2025-2030 ($ million)
Chart on HFO - Year-over-year growth 2025-2030 (%)
Data Table on HFO - Year-over-year growth 2025-2030 (%)

8.5 Isobutane - Market size and forecast 2025-2030

Chart on Isobutane - Market size and forecast 2025-2030 ($ million)
Data Table on Isobutane - Market size and forecast 2025-2030 ($ million)
Chart on Isobutane - Year-over-year growth 2025-2030 (%)
Data Table on Isobutane - Year-over-year growth 2025-2030 (%)

8.6 Propane - Market size and forecast 2025-2030

Chart on Propane - Market size and forecast 2025-2030 ($ million)
Data Table on Propane - Market size and forecast 2025-2030 ($ million)
Chart on Propane - Year-over-year growth 2025-2030 (%)
Data Table on Propane - Year-over-year growth 2025-2030 (%)

8.7 Others - Market size and forecast 2025-2030

Chart on Others - Market size and forecast 2025-2030 ($ million)
Data Table on Others - Market size and forecast 2025-2030 ($ million)
Chart on Others - Year-over-year growth 2025-2030 (%)
Data Table on Others - Year-over-year growth 2025-2030 (%)

8.8 Market opportunity by Product

Market opportunity by Product ($ million)
Data Table on Market opportunity by Product ($ million)

9. Market Segmentation by Application

9.1 Market segments

Chart on Application - Market share 2025-2030 (%)
Data Table on Application - Market share 2025-2030 (%)

9.2 Comparison by Application

Chart on Comparison by Application
Data Table on Comparison by Application

9.3 Refrigeration system - Market size and forecast 2025-2030

Chart on Refrigeration system - Market size and forecast 2025-2030 ($ million)
Data Table on Refrigeration system - Market size and forecast 2025-2030 ($ million)
Chart on Refrigeration system - Year-over-year growth 2025-2030 (%)
Data Table on Refrigeration system - Year-over-year growth 2025-2030 (%)

9.4 Air conditioning system - Market size and forecast 2025-2030

Chart on Air conditioning system - Market size and forecast 2025-2030 ($ million)
Data Table on Air conditioning system - Market size and forecast 2025-2030 ($ million)
Chart on Air conditioning system - Year-over-year growth 2025-2030 (%)
Data Table on Air conditioning system - Year-over-year growth 2025-2030 (%)

9.5 Chillers - Market size and forecast 2025-2030

Chart on Chillers - Market size and forecast 2025-2030 ($ million)
Data Table on Chillers - Market size and forecast 2025-2030 ($ million)
Chart on Chillers - Year-over-year growth 2025-2030 (%)
Data Table on Chillers - Year-over-year growth 2025-2030 (%)

9.6 Mobile air conditioning - Market size and forecast 2025-2030

Chart on Mobile air conditioning - Market size and forecast 2025-2030 ($ million)
Data Table on Mobile air conditioning - Market size and forecast 2025-2030 ($ million)
Chart on Mobile air conditioning - Year-over-year growth 2025-2030 (%)
Data Table on Mobile air conditioning - Year-over-year growth 2025-2030 (%)

9.7 Market opportunity by Application

Market opportunity by Application ($ million)
Data Table on Market opportunity by Application ($ million)

10. Market Segmentation by End-user

10.1 Market segments

Chart on End-user - Market share 2025-2030 (%)
Data Table on End-user - Market share 2025-2030 (%)

10.2 Comparison by End-user

Chart on Comparison by End-user
Data Table on Comparison by End-user

10.3 Commercial refrigeration - Market size and forecast 2025-2030

Chart on Commercial refrigeration - Market size and forecast 2025-2030 ($ million)
Data Table on Commercial refrigeration - Market size and forecast 2025-2030 ($ million)
Chart on Commercial refrigeration - Year-over-year growth 2025-2030 (%)
Data Table on Commercial refrigeration - Year-over-year growth 2025-2030 (%)

10.4 Residential refrigeration - Market size and forecast 2025-2030

Chart on Residential refrigeration - Market size and forecast 2025-2030 ($ million)
Data Table on Residential refrigeration - Market size and forecast 2025-2030 ($ million)
Chart on Residential refrigeration - Year-over-year growth 2025-2030 (%)
Data Table on Residential refrigeration - Year-over-year growth 2025-2030 (%)

10.5 Industrial refrigeration - Market size and forecast 2025-2030

Chart on Industrial refrigeration - Market size and forecast 2025-2030 ($ million)
Data Table on Industrial refrigeration - Market size and forecast 2025-2030 ($ million)
Chart on Industrial refrigeration - Year-over-year growth 2025-2030 (%)
Data Table on Industrial refrigeration - Year-over-year growth 2025-2030 (%)

10.6 Transportation refrigeration - Market size and forecast 2025-2030

Chart on Transportation refrigeration - Market size and forecast 2025-2030 ($ million)
Data Table on Transportation refrigeration - Market size and forecast 2025-2030 ($ million)
Chart on Transportation refrigeration - Year-over-year growth 2025-2030 (%)
Data Table on Transportation refrigeration - Year-over-year growth 2025-2030 (%)

10.7 Market opportunity by End-user

Market opportunity by End-user ($ million)
Data Table on Market opportunity by End-user ($ million)

11. Customer Landscape

11.1 Customer landscape overview

Analysis of price sensitivity, lifecycle, customer purchase basket, adoption rates, and purchase criteria

12. Geographic Landscape

12.1 Geographic segmentation

Chart on Market share by geography 2025-2030 (%)
Data Table on Market share by geography 2025-2030 (%)

12.2 Geographic comparison

Chart on Geographic comparison
Data Table on Geographic comparison

12.3 APAC - Market size and forecast 2025-2030

Chart on APAC - Market size and forecast 2025-2030 ($ million)
Data Table on APAC - Market size and forecast 2025-2030 ($ million)
Chart on APAC - Year-over-year growth 2025-2030 (%)
Data Table on APAC - Year-over-year growth 2025-2030 (%)
Chart on Regional Comparison - APAC
Data Table on Regional Comparison - APAC

12.3.1 China - Market size and forecast 2025-2030

Chart on China - Market size and forecast 2025-2030 ($ million)
Data Table on China - Market size and forecast 2025-2030 ($ million)
Chart on China - Year-over-year growth 2025-2030 (%)
Data Table on China - Year-over-year growth 2025-2030 (%)

12.3.2 India - Market size and forecast 2025-2030

Chart on India - Market size and forecast 2025-2030 ($ million)
Data Table on India - Market size and forecast 2025-2030 ($ million)
Chart on India - Year-over-year growth 2025-2030 (%)
Data Table on India - Year-over-year growth 2025-2030 (%)

12.3.3 Japan - Market size and forecast 2025-2030

Chart on Japan - Market size and forecast 2025-2030 ($ million)
Data Table on Japan - Market size and forecast 2025-2030 ($ million)
Chart on Japan - Year-over-year growth 2025-2030 (%)
Data Table on Japan - Year-over-year growth 2025-2030 (%)

12.3.4 South Korea - Market size and forecast 2025-2030

Chart on South Korea - Market size and forecast 2025-2030 ($ million)
Data Table on South Korea - Market size and forecast 2025-2030 ($ million)
Chart on South Korea - Year-over-year growth 2025-2030 (%)
Data Table on South Korea - Year-over-year growth 2025-2030 (%)

12.3.5 Australia - Market size and forecast 2025-2030

Chart on Australia - Market size and forecast 2025-2030 ($ million)
Data Table on Australia - Market size and forecast 2025-2030 ($ million)
Chart on Australia - Year-over-year growth 2025-2030 (%)
Data Table on Australia - Year-over-year growth 2025-2030 (%)

12.3.6 Indonesia - Market size and forecast 2025-2030

Chart on Indonesia - Market size and forecast 2025-2030 ($ million)
Data Table on Indonesia - Market size and forecast 2025-2030 ($ million)
Chart on Indonesia - Year-over-year growth 2025-2030 (%)
Data Table on Indonesia - Year-over-year growth 2025-2030 (%)

12.4 North America - Market size and forecast 2025-2030

Chart on North America - Market size and forecast 2025-2030 ($ million)
Data Table on North America - Market size and forecast 2025-2030 ($ million)
Chart on North America - Year-over-year growth 2025-2030 (%)
Data Table on North America - Year-over-year growth 2025-2030 (%)
Chart on Regional Comparison - North America
Data Table on Regional Comparison - North America

12.4.1 US - Market size and forecast 2025-2030

Chart on US - Market size and forecast 2025-2030 ($ million)
Data Table on US - Market size and forecast 2025-2030 ($ million)
Chart on US - Year-over-year growth 2025-2030 (%)
Data Table on US - Year-over-year growth 2025-2030 (%)

12.4.2 Canada - Market size and forecast 2025-2030

Chart on Canada - Market size and forecast 2025-2030 ($ million)
Data Table on Canada - Market size and forecast 2025-2030 ($ million)
Chart on Canada - Year-over-year growth 2025-2030 (%)
Data Table on Canada - Year-over-year growth 2025-2030 (%)

12.4.3 Mexico - Market size and forecast 2025-2030

Chart on Mexico - Market size and forecast 2025-2030 ($ million)
Data Table on Mexico - Market size and forecast 2025-2030 ($ million)
Chart on Mexico - Year-over-year growth 2025-2030 (%)
Data Table on Mexico - Year-over-year growth 2025-2030 (%)

12.5 Europe - Market size and forecast 2025-2030

Chart on Europe - Market size and forecast 2025-2030 ($ million)
Data Table on Europe - Market size and forecast 2025-2030 ($ million)
Chart on Europe - Year-over-year growth 2025-2030 (%)
Data Table on Europe - Year-over-year growth 2025-2030 (%)
Chart on Regional Comparison - Europe
Data Table on Regional Comparison - Europe

12.5.1 Germany - Market size and forecast 2025-2030

Chart on Germany - Market size and forecast 2025-2030 ($ million)
Data Table on Germany - Market size and forecast 2025-2030 ($ million)
Chart on Germany - Year-over-year growth 2025-2030 (%)
Data Table on Germany - Year-over-year growth 2025-2030 (%)

12.5.2 UK - Market size and forecast 2025-2030

Chart on UK - Market size and forecast 2025-2030 ($ million)
Data Table on UK - Market size and forecast 2025-2030 ($ million)
Chart on UK - Year-over-year growth 2025-2030 (%)
Data Table on UK - Year-over-year growth 2025-2030 (%)

12.5.3 France - Market size and forecast 2025-2030

Chart on France - Market size and forecast 2025-2030 ($ million)
Data Table on France - Market size and forecast 2025-2030 ($ million)
Chart on France - Year-over-year growth 2025-2030 (%)
Data Table on France - Year-over-year growth 2025-2030 (%)

12.5.4 Italy - Market size and forecast 2025-2030

Chart on Italy - Market size and forecast 2025-2030 ($ million)
Data Table on Italy - Market size and forecast 2025-2030 ($ million)
Chart on Italy - Year-over-year growth 2025-2030 (%)
Data Table on Italy - Year-over-year growth 2025-2030 (%)

12.5.5 The Netherlands - Market size and forecast 2025-2030

Chart on The Netherlands - Market size and forecast 2025-2030 ($ million)
Data Table on The Netherlands - Market size and forecast 2025-2030 ($ million)
Chart on The Netherlands - Year-over-year growth 2025-2030 (%)
Data Table on The Netherlands - Year-over-year growth 2025-2030 (%)

12.5.6 Spain - Market size and forecast 2025-2030

Chart on Spain - Market size and forecast 2025-2030 ($ million)
Data Table on Spain - Market size and forecast 2025-2030 ($ million)
Chart on Spain - Year-over-year growth 2025-2030 (%)
Data Table on Spain - Year-over-year growth 2025-2030 (%)

12.6 Middle East and Africa - Market size and forecast 2025-2030

Chart on Middle East and Africa - Market size and forecast 2025-2030 ($ million)
Data Table on Middle East and Africa - Market size and forecast 2025-2030 ($ million)
Chart on Middle East and Africa - Year-over-year growth 2025-2030 (%)
Data Table on Middle East and Africa - Year-over-year growth 2025-2030 (%)
Chart on Regional Comparison - Middle East and Africa
Data Table on Regional Comparison - Middle East and Africa

12.6.1 Saudi Arabia - Market size and forecast 2025-2030

Chart on Saudi Arabia - Market size and forecast 2025-2030 ($ million)
Data Table on Saudi Arabia - Market size and forecast 2025-2030 ($ million)
Chart on Saudi Arabia - Year-over-year growth 2025-2030 (%)
Data Table on Saudi Arabia - Year-over-year growth 2025-2030 (%)

12.6.2 UAE - Market size and forecast 2025-2030

Chart on UAE - Market size and forecast 2025-2030 ($ million)
Data Table on UAE - Market size and forecast 2025-2030 ($ million)
Chart on UAE - Year-over-year growth 2025-2030 (%)
Data Table on UAE - Year-over-year growth 2025-2030 (%)

12.6.3 South Africa - Market size and forecast 2025-2030

Chart on South Africa - Market size and forecast 2025-2030 ($ million)
Data Table on South Africa - Market size and forecast 2025-2030 ($ million)
Chart on South Africa - Year-over-year growth 2025-2030 (%)
Data Table on South Africa - Year-over-year growth 2025-2030 (%)

12.6.4 Israel - Market size and forecast 2025-2030

Chart on Israel - Market size and forecast 2025-2030 ($ million)
Data Table on Israel - Market size and forecast 2025-2030 ($ million)
Chart on Israel - Year-over-year growth 2025-2030 (%)
Data Table on Israel - Year-over-year growth 2025-2030 (%)

12.6.5 Turkey - Market size and forecast 2025-2030

Chart on Turkey - Market size and forecast 2025-2030 ($ million)
Data Table on Turkey - Market size and forecast 2025-2030 ($ million)
Chart on Turkey - Year-over-year growth 2025-2030 (%)
Data Table on Turkey - Year-over-year growth 2025-2030 (%)

12.7 South America - Market size and forecast 2025-2030

Chart on South America - Market size and forecast 2025-2030 ($ million)
Data Table on South America - Market size and forecast 2025-2030 ($ million)
Chart on South America - Year-over-year growth 2025-2030 (%)
Data Table on South America - Year-over-year growth 2025-2030 (%)
Chart on Regional Comparison - South America
Data Table on Regional Comparison - South America

12.7.1 Brazil - Market size and forecast 2025-2030

Chart on Brazil - Market size and forecast 2025-2030 ($ million)
Data Table on Brazil - Market size and forecast 2025-2030 ($ million)
Chart on Brazil - Year-over-year growth 2025-2030 (%)
Data Table on Brazil - Year-over-year growth 2025-2030 (%)

12.7.2 Argentina - Market size and forecast 2025-2030

Chart on Argentina - Market size and forecast 2025-2030 ($ million)
Data Table on Argentina - Market size and forecast 2025-2030 ($ million)
Chart on Argentina - Year-over-year growth 2025-2030 (%)
Data Table on Argentina - Year-over-year growth 2025-2030 (%)

12.7.3 Colombia - Market size and forecast 2025-2030

Chart on Colombia - Market size and forecast 2025-2030 ($ million)
Data Table on Colombia - Market size and forecast 2025-2030 ($ million)
Chart on Colombia - Year-over-year growth 2025-2030 (%)
Data Table on Colombia - Year-over-year growth 2025-2030 (%)

12.8 Market opportunity by geography

Market opportunity by geography ($ million)
Data Tables on Market opportunity by geography ($ million)

13. Drivers, Challenges, and Opportunity

13.1 Market drivers

Exponential growth of global cold chain logistics
Accelerating urbanization and rise of middle class in developing nations
Implementation of systematic phase-down schedules

13.2 Market challenges

Safety and flammability risks associated with eco-friendly alternatives
High financial barrier to entry and infrastructure modernization
Regulatory complexity and proliferation of illicit trade markets

13.3 Impact of drivers and challenges

Impact of drivers and challenges in 2025 and 2030

13.4 Market opportunities

Proliferation of natural and ultra-low global warming potential substances
Integration of AI and advanced digital monitoring
Advancement of circular economy and refrigerant reclamation

14. Competitive Landscape

14.1 Overview

14.2

Overview on criticality of inputs and factors of differentiation

14.3 Landscape disruption

Overview on factors of disruption

14.4 Industry risks

Impact of key risks on business

15. Competitive Analysis

15.1 Companies profiled

Companies covered

15.2 Company ranking index

15.3 Market positioning of companies

Matrix on companies position and classification

15.4 AGC Inc.

AGC Inc. - Overview
AGC Inc. - Business segments
AGC Inc. - Key news
AGC Inc. - Key offerings
AGC Inc. - Segment focus
SWOT

15.5 Air Liquide SA

Air Liquide SA - Overview
Air Liquide SA - Business segments
Air Liquide SA - Key news
Air Liquide SA - Key offerings
Air Liquide SA - Segment focus
SWOT

15.6 Arkema Group

Arkema Group - Overview
Arkema Group - Business segments
Arkema Group - Key offerings
Arkema Group - Segment focus
SWOT

15.7 Daikin Industries Ltd.

Daikin Industries Ltd. - Overview
Daikin Industries Ltd. - Business segments
Daikin Industries Ltd. - Key offerings
Daikin Industries Ltd. - Segment focus
SWOT

15.8 Dongyue Group Ltd.

Dongyue Group Ltd. - Overview
Dongyue Group Ltd. - Business segments
Dongyue Group Ltd. - Key offerings
Dongyue Group Ltd. - Segment focus
SWOT

15.9 Gujarat Fluorochemicals Ltd.

Gujarat Fluorochemicals Ltd. - Overview
Gujarat Fluorochemicals Ltd. - Product / Service
Gujarat Fluorochemicals Ltd. - Key offerings
SWOT

15.10 Harp International Ltd.

Harp International Ltd. - Overview
Harp International Ltd. - Product / Service
Harp International Ltd. - Key offerings
SWOT

15.11 Honeywell International Inc.

Honeywell International Inc. - Overview
Honeywell International Inc. - Business segments
Honeywell International Inc. - Key news
Honeywell International Inc. - Key offerings
Honeywell International Inc. - Segment focus
SWOT

15.12 Hudson Technologies, Inc.

Hudson Technologies, Inc. - Overview
Hudson Technologies, Inc. - Product / Service
Hudson Technologies, Inc. - Key offerings
SWOT

15.13 Linde Plc

Linde Plc - Overview
Linde Plc - Business segments
Linde Plc - Key news
Linde Plc - Key offerings
Linde Plc - Segment focus
SWOT

15.14 Orbia

Orbia - Overview
Orbia - Business segments
Orbia - Key offerings
Orbia - Segment focus
SWOT

15.15 Resonac Holdings Corp.

Resonac Holdings Corp. - Overview
Resonac Holdings Corp. - Business segments
Resonac Holdings Corp. - Key news
Resonac Holdings Corp. - Key offerings
Resonac Holdings Corp. - Segment focus
SWOT

15.16 Sinochem Hong Kong (Group) Co., Ltd

Sinochem Hong Kong (Group) Co., Ltd - Overview
Sinochem Hong Kong (Group) Co., Ltd - Product / Service
Sinochem Hong Kong (Group) Co., Ltd - Key offerings
SWOT

15.17 SRF Ltd.

SRF Ltd. - Overview
SRF Ltd. - Business segments
SRF Ltd. - Key offerings
SRF Ltd. - Segment focus
SWOT

15.18 The Chemours Co.

The Chemours Co. - Overview
The Chemours Co. - Business segments
The Chemours Co. - Key news
The Chemours Co. - Key offerings
The Chemours Co. - Segment focus
SWOT

16. Appendix

16.1 Scope of the report

Market definition
Objectives
Notes and caveats

16.2 Inclusions and exclusions checklist

Inclusions checklist
Exclusions checklist

16.3 Currency conversion rates for US$

16.4 Research methodology

16.5 Data procurement

Information sources

16.6 Data validation

16.7 Validation techniques employed for market sizing

16.8 Data synthesis

16.9 360 degree market analysis

16.10 List of abbreviations

Research Methodology

Technavio presents a detailed picture of the market by way of study, synthesis, and summation of data from multiple sources. The analysts have presented the various facets of the market with a particular focus on identifying the key industry influencers. The data thus presented is comprehensive, reliable, and the result of extensive research, both primary and secondary.

INFORMATION SOURCES

Primary sources

  • Manufacturers and suppliers
  • Channel partners
  • Industry experts
  • Strategic decision makers

Secondary sources

  • Industry journals and periodicals
  • Government data
  • Financial reports of key industry players
  • Historical data
  • Press releases

DATA ANALYSIS

Data Synthesis

  • Collation of data
  • Estimation of key figures
  • Analysis of derived insights

Data Validation

  • Triangulation with data models
  • Reference against proprietary databases
  • Corroboration with industry experts

REPORT WRITING

Qualitative

  • Market drivers
  • Market challenges
  • Market trends
  • Five forces analysis

Quantitative

  • Market size and forecast
  • Market segmentation
  • Geographical insights
  • Competitive landscape

Interested in this report?

Get your sample now to see our research methodology and insights!

Download Now

Frequently Asked Questions

Refrigerants market growth will increase by USD 2879.2 million during 2026-2030.

The Refrigerants market is expected to grow at a CAGR of 6.7% during 2026-2030.

Refrigerants market is segmented by Product (HFC and blends, HFO, Isobutane, Propane, Others) Application (Refrigeration system, Air conditioning system, Chillers, Mobile air conditioning) End-user (Commercial refrigeration, Residential refrigeration, Industrial refrigeration, Transportation refrigeration)

A Gas International Ltd., AGC Inc., Air Liquide SA, Arkema Group, Daikin Industries Ltd., Dongyue Group Ltd., Gujarat Fluorochemicals Ltd., Harp International Ltd., Honeywell International Inc., Hudson Technologies, Inc., Linde Plc, National Refrigerants Inc., Orbia, Resonac Holdings Corp., Sinochem Hong Kong (Group) Co., Ltd, SRF Ltd., Tazzetti Spa, The Chemours Co., Trane Technologies Plc, WEITRON Inc. are a few of the key vendors in the Refrigerants market.

APAC will register the highest growth rate of 46.8% among the other regions. Therefore, the Refrigerants market in APAC is expected to garner significant business opportunities for the vendors during the forecast period.

China, India, Japan, South Korea, Australia, Indonesia, US, Canada, Mexico, Germany, UK, France, Italy, The Netherlands, Spain, Saudi Arabia, UAE, South Africa, Israel, Turkey, Brazil, Argentina, Colombia

  • Exponential growth of global cold chain logistics is the driving factor this market.

The Refrigerants market vendors should focus on grabbing business opportunities from the Product segment as it accounted for the largest market share in the base year.
RIA - Research AI Assistant
Ask RIA