Recreational Equipment Market Analysis, Size, and Forecast 2026-2030: North America (US, Canada, and Mexico), Europe (Germany, UK, and France), APAC (China, India, and Japan), South America (Brazil, Argentina, and Colombia), Middle East and Africa (Saudi Arabia, UAE, and South Africa), and Rest of World (ROW)

Recreational Equipment Market Analysis, Size, and Forecast 2026-2030:
North America (US, Canada, and Mexico), Europe (Germany, UK, and France), APAC (China, India, and Japan), South America (Brazil, Argentina, and Colombia), Middle East and Africa (Saudi Arabia, UAE, and South Africa), and Rest of World (ROW)

Published: May 2026 319 Pages SKU: IRTNTR81405

Market Overview at a Glance

$45.93 B
Market Opportunity
7.5%
CAGR 2025 - 2030
29.2%
APAC Growth
$42.04 B
Camping and hiking gear segment 2024

Recreational Equipment Market Size and Growth Forecast 2026-2030

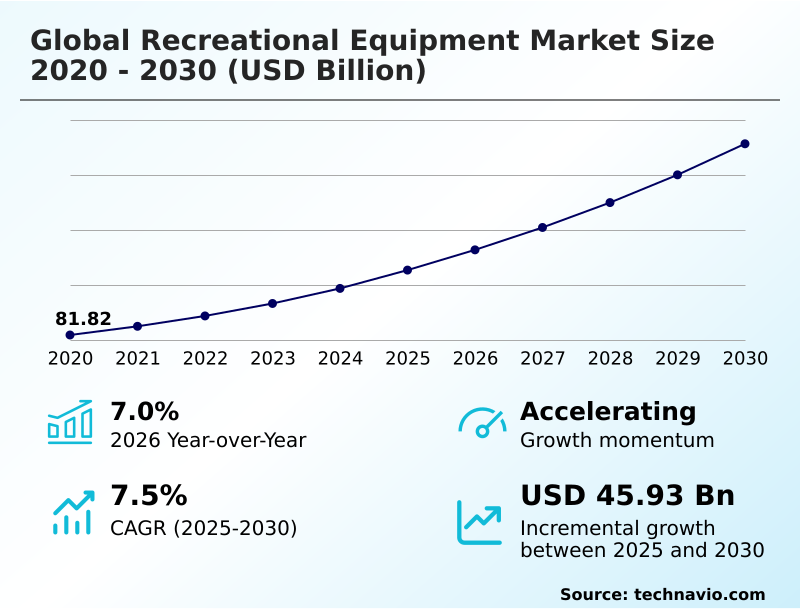
The Recreational Equipment Market size was valued at USD 105.42 billion in 2025 growing at a CAGR of 7.5% during the forecast period 2026-2030.

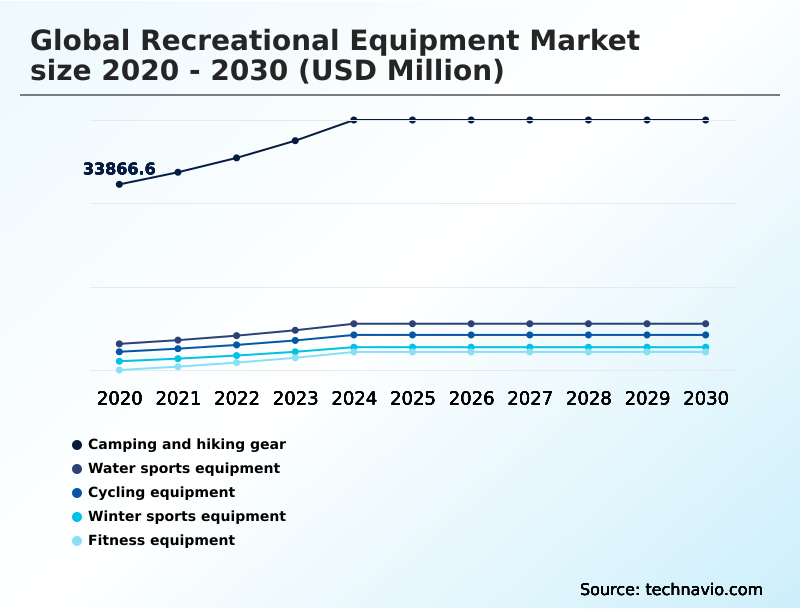
APAC accounts for 29.2% of incremental growth during the forecast period. The Camping and hiking gear segment by Product was valued at USD 42.04 billion in 2024, while the Residential users segment holds the largest revenue share by End-user.

The market is projected to grow by USD 69.53 billion from 2020 to 2030, with USD 45.93 billion of the growth expected during the forecast period of 2025 to 2030.

Get Key Insights on Market Forecast (PDF) Request Free Sample

Recreational Equipment Market Overview

The recreational equipment market is defined by a continuous push for performance and sustainability, with a notable 7.0% year-over-year growth reflecting strong consumer engagement. A key dynamic is the integration of advanced technologies into traditional gear; smart wearable integration and performance enhancing sportswear are no longer niche, but core to product development. This is driven by consumer demand for data-driven training and enhanced safety. For example, a manufacturer of cycling safety helmets now incorporates multi-directional impact protection systems and integrated communication systems, leveraging aerodynamic design principles tested in wind tunnels. These helmets, made from impact-resistant materials, can reduce rotational forces during an impact, a critical factor in preventing brain injury, as specified by testing protocols like those from Virginia Tech. This focus on verifiable safety and performance, coupled with the trend towards eco-friendly manufacturing, dictates procurement decisions for both individual consumers and commercial operators.

Drivers, Trends, and Challenges in the Recreational Equipment Market

Strategic decision-making in the recreational equipment market is increasingly complex, influenced by granular consumer queries like the best lightweight tent for solo backpacking or the impact of biometric sensors on fitness training.

Procurement managers for adventure tourism companies now scrutinize the technical specifications for climbing ropes and thermal insulation standards for sleeping bags to ensure compliance with safety regulations like the Consumer Product Safety Act (CPSA).

The trend toward personalization means consumers are evaluating the custom fitting process for ski boots and seeking out the benefits of carbon fiber in bicycle frames before purchase.

In manufacturing, a focus on eco-friendly materials in outdoor apparel has led to operational shifts, where the adoption of a new waterless dyeing process can be over 50% more capital-intensive upfront than traditional methods but yields significant long-term savings on water and effluent treatment costs.

This environment requires brands to provide detailed guidance, from how to choose a gravel bike for beginners to maintenance tips for high-end mountain bikes, to build trust and capture market share in a landscape shaped by informed, specific consumer needs.

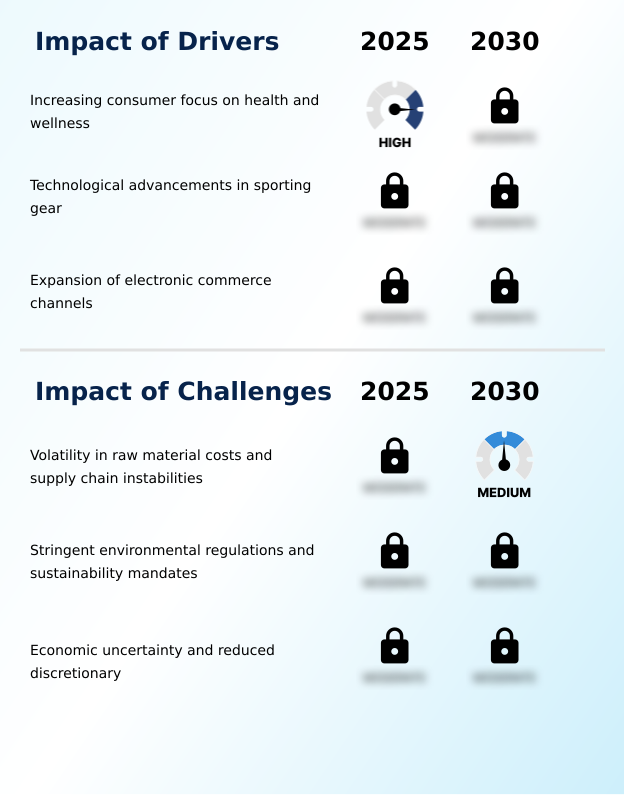
Primary Growth Driver: The primary market driver is the increasing consumer focus on health and wellness, which is boosting demand for recreational activities and related equipment.

Technological advancements are a primary driver, particularly the smart wearable integration within personal fitness equipment. Devices with biometric sensors and gps-enabled navigation are becoming standard, offering users real-time performance data.

This connected fitness technology is attracting a tech-savvy demographic, while innovations in lightweight materials like advanced carbon fiber composites enhance performance in products like all-terrain bicycles.

Furthermore, 3d printing customization is enabling the creation of customized sports equipment, from footwear to helmets, tailored to individual anatomy.

This fusion of digital tech and material science compels frequent upgrades, driving replacement sales for everything from smart fitness watches to outdoor navigation devices.

Emerging Market Trend: A significant market trend is the increasing adoption of sustainable and eco-friendly manufacturing practices. This shift is driven by consumer demand and regulatory pressures for environmental accountability.

The adoption of sustainable manufacturing processes is reshaping the recreational equipment market, with a focus on a circular economy. Manufacturers are increasingly utilizing recycled plastic materials and plant-based polymers to meet consumer demand for eco-conscious outdoor products and adhere to standards like the Global Recycled Standard (GRS).

This shift towards eco-friendly manufacturing and sustainable activewear is not just about material sourcing but also includes modular equipment design to facilitate repairs and extend product lifecycles. The rise of rental platforms and certified second-hand marketplaces for specialized sporting goods further exemplifies this trend, creating new revenue streams while reducing waste and promoting resource efficiency.

Key Industry Challenge: A key challenge facing the industry is the volatility in raw material costs and persistent supply chain instabilities, which impact profitability and production schedules.

The industry faces significant headwinds from material cost volatility and supply chain disruptions affecting key inputs like high-performance polymers and durable alloy frames. The production of robust equipment, such as machines with reinforced steel frames and high-torque motors, relies on a stable supply of these commodities.

Concurrently, stringent regulations like the EU's REACH directive impose compliance burdens and R&D costs for developing alternative, compliant materials without compromising performance. This forces manufacturers to either absorb costs, risking margin compression, or pass them to consumers, potentially reducing demand for non-essential premium golf clubs and other high-ticket items, especially amid economic uncertainty.

Explore Full Market Dynamics Analysis Request Free Sample

Recreational Equipment Market Segmentation

The recreational equipment industry research report provides comprehensive data including region-wise segment analysis, with forecasts and analysis for the period 2026-2030, as well as historical data from 2020-2024 for the following segments.

Market Segment by Product
  • Camping and hiking gear
  • Water sports equipment
  • Cycling equipment
  • Winter sports equipment
  • Fitness equipment
Market Segment by End-user
  • Residential users
  • Commercial facilities
  • Sports clubs
  • Adventure tourism operators
Market Segment by Distribution channel
  • Specialty stores
  • Mass merchandisers
  • Online retailers
  • Department stores
Market Segment by Geography
North America
US, Canada, Mexico
Europe
Germany, UK, France, Italy, Spain, The Netherlands
APAC
China, India, Japan, South Korea, Australia, Indonesia
South America
Brazil, Argentina, Colombia
Middle East and Africa
Saudi Arabia, UAE, South Africa, Turkey, Israel

Product Segment Analysis

The camping and hiking gear segment is estimated to witness significant growth during the forecast period.

The market segmentation reveals camping and hiking gear as a dominant category, representing over 42% of sales in 2024. This segment's growth is propelled by consumer demand for equipment that enhances outdoor experiences through superior technical specifications.

Key innovations focus on lightweight materials and ergonomic equipment design, evident in products featuring carbon fiber composites and waterproof breathable fabrics.

Adherence to performance benchmarks, such as ISO 23537 for thermal insulation technology in sleeping bags, is critical for brand credibility.

The emphasis on foldable equipment design and portability in portable camping solutions also caters to a broad consumer base, from families to solo adventurers seeking lightweight backpacking gear.

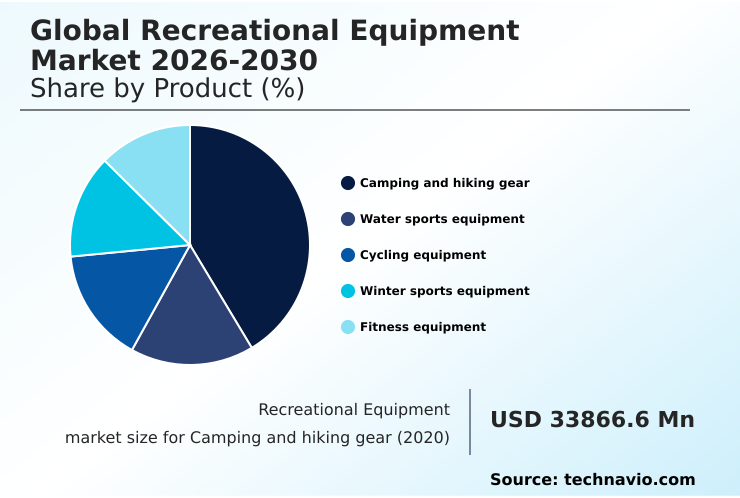
The Camping and hiking gear segment was valued at USD 42.04 billion in 2024 and showed a gradual increase during the forecast period.

Recreational Equipment Market by Region: APAC Leads with 29.2% Growth Share

APAC is estimated to contribute 29.2% to the growth of the global market during the forecast period.

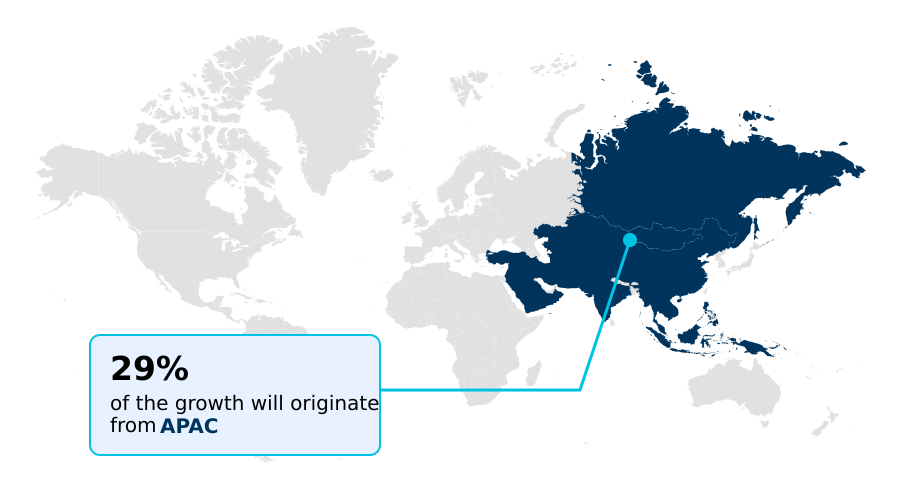
The geographic landscape is diverse, with APAC poised to contribute 29.2% of the market's incremental growth, driven by rising disposable incomes.

In North America, which accounts for nearly 29% of the growth opportunity, demand is mature for outdoor adventure gear and winter sports safety gear. European markets, contributing over 25%, prioritize urban mobility equipment and gear compliant with strict environmental standards.

In emerging South American and Middle Eastern markets, growth is linked to expanding tourism infrastructure, which boosts demand for recreational boating equipment and water sports accessories.

This regional variation requires manufacturers to tailor their product offerings, from durable hiking footwear for alpine regions to advanced marine electronics for coastal markets.

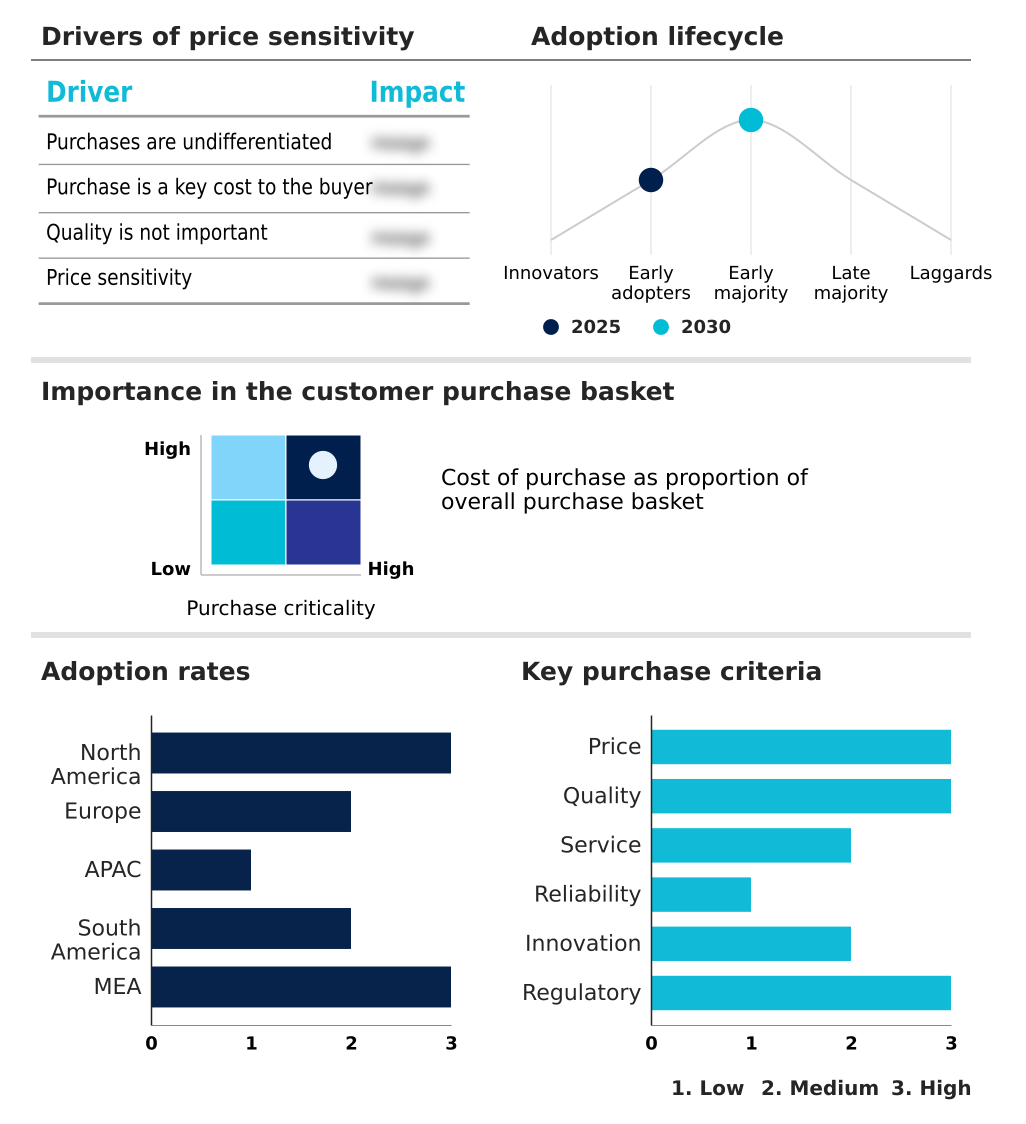
Customer Landscape Analysis for the Recreational Equipment Market

The recreational equipment market forecasting report includes the adoption lifecycle of the market, covering from the innovator’s stage to the laggard’s stage. It focuses on adoption rates in different regions based on penetration. Furthermore, the recreational equipment market report also includes key purchase criteria and drivers of price sensitivity to help companies evaluate and develop their market growth analysis strategies.

Competitive Landscape of the Recreational Equipment Market

Companies are implementing various strategies, such as strategic alliances, partnerships, mergers and acquisitions, geographical expansion, and product/service launches, to enhance their presence in the recreational equipment market industry.

Amer Sports Corp. - Offers a diversified portfolio of recreational equipment spanning winter sports, racquet sports, and performance outdoor apparel, catering to varied athletic and leisure consumer segments.

The industry research and growth report includes detailed analyses of the competitive landscape of the market and information about key companies, including:

  • Amer Sports Corp.
  • Brunswick Corp.
  • Clarus Corp.
  • Columbia Sportswear Co.
  • Decathlon SA
  • Deckers Outdoor Corp.
  • Garmin Ltd.
  • HEAD Sport GmbH
  • Naturehike
  • Newell Brands Inc.
  • Nike Inc.
  • Patagonia Inc.
  • Peloton Interactive Inc.
  • Recreational Equipment Inc.
  • The North Face
  • Topgolf Callaway Brands Corp.
  • Trek Bicycle Corp.
  • VF Corp.
  • Vista Outdoor Inc.
  • Yonex Co. Ltd.

Qualitative and quantitative analysis of companies has been conducted to help clients understand the wider business environment as well as the strengths and weaknesses of key industry players. Data is qualitatively analyzed to categorize companies as pure play, category-focused, industry-focused, and diversified; it is quantitatively analyzed to categorize companies as dominant, leading, strong, tentative, and weak.

Recent Developments in the Recreational Equipment Market

  • In May 2025, iFIT Inc., a leader in connected fitness, announced its strategic acquisition of Reform RX, a provider of advanced Pilates reformers, signaling a significant expansion into the home-based, low-impact strength training segment.
  • In April 2025, Raleigh introduced the Raleigh ONE, a new urban commuter e-bike featuring smart connectivity and a lightweight frame, designed to meet growing demand for sustainable urban mobility solutions.
  • In March 2025, Mountain Equipment, a specialist in alpine gear, launched its Xenith sleeping bag collection, showcasing new lightweight materials and designs to optimize warmth-to-weight performance for backcountry adventurers.
  • In January 2025, ALPS Mountaineering, a manufacturer of performance outdoor gear, introduced a new series of backpacking sleeping bags, enhancing its product line for wilderness exploration and family camping.

Research Analyst Overview: Recreational Equipment Market

The recreational equipment market's growth trajectory is tied to material science and digital integration, with boardroom decisions increasingly focused on sustainable R&D investment. The adoption of lightweight materials, particularly advanced carbon fiber composites, in everything from bicycle frames to ski boots is a critical differentiator. These materials offer superior strength-to-weight ratios, a key purchasing factor.

However, their material cost volatility and complex production, governed by standards like ASTM D7290 for composite testing, present supply chain risks. Simultaneously, the market is being reshaped by smart wearable integration. A prime example is the use of embedded biometric sensors and gps-enabled navigation in high-performance athletic apparel and smart fitness watches.

This trend allows for 3d printing customization of gear based on performance data, creating a powerful ecosystem of connected fitness technology and athletic training accessories. Companies that can navigate the high CAPEX of sustainable manufacturing processes while mastering the integration of digital features will secure a competitive advantage in a market where consumers demand both peak performance and environmental responsibility.

Dive into Technavio’s robust research methodology, blending expert interviews, extensive data synthesis, and validated models for unparalleled Recreational Equipment Market insights. See full methodology.

Request Free Sample

Market Scope
Page number 319
Base year 2025
Historic period 2020-2024
Forecast period 2026-2030
Growth momentum & CAGR Accelerate at a CAGR of 7.5%
Market growth 2026-2030 USD 45929.7 million
Market structure Fragmented
YoY growth 2025-2026(%) 7.0%
Key countries US, Canada, Mexico, Germany, UK, France, Italy, Spain, The Netherlands, China, India, Japan, South Korea, Australia, Indonesia, Brazil, Argentina, Colombia, Saudi Arabia, UAE, South Africa, Turkey and Israel
Competitive landscape Leading Companies, Market Positioning of Companies, Competitive Strategies, and Industry Risks

Recreational Equipment Market: Key Questions Answered in This Report

  • What is the expected growth of the Recreational Equipment Market between 2026 and 2030?

    • The Recreational Equipment Market is expected to grow by USD 45.93 billion during 2026-2030, registering a CAGR of 7.5%. Year-over-year growth in 2026 is estimated at 7.0%%. This acceleration is shaped by increasing consumer focus on health and wellness , which is intensifying demand across multiple end-use verticals covered in the report.

  • What segmentation does the market report cover?

    • The report is segmented by Product (Camping and hiking gear, Water sports equipment, Cycling equipment, Winter sports equipment, and Fitness equipment), End-user (Residential users, Commercial facilities, Sports clubs, and Adventure tourism operators), Distribution Channel (Specialty stores, Mass merchandisers, Online retailers, and Department stores) and Geography (North America, Europe, APAC, South America, Middle East and Africa). Among these, the Camping and hiking gear segment is estimated to witness significant growth during the forecast period, driven by rising adoption across key application areas. Each segment includes detailed qualitative and quantitative analysis, along with historical data from 2020-2024 and forecasts through 2030 with year-over-year growth rates.

  • Which regions are analyzed in the report?

    • The report covers North America, Europe, APAC, South America and Middle East and Africa. APAC is estimated to contribute 29.2% to market growth during the forecast period. Country-level analysis includes US, Canada, Mexico, Germany, UK, France, Italy, Spain, The Netherlands, China, India, Japan, South Korea, Australia, Indonesia, Brazil, Argentina, Colombia, Saudi Arabia, UAE, South Africa, Turkey and Israel, with dedicated market size tables and year-over-year growth for each.

  • What are the key growth drivers and market challenges?

    • The primary driver is increasing consumer focus on health and wellness , which is accelerating investment and industry demand. The main challenge is volatility in raw material costs and supply chain instabilities, creating operational barriers for key market participants. The report quantifies the impact of each driver and challenge across 2026 and 2030 with comparative analysis.

  • Who are the major players in the Recreational Equipment Market?

    • Key vendors include Amer Sports Corp., Brunswick Corp., Clarus Corp., Columbia Sportswear Co., Decathlon SA, Deckers Outdoor Corp., Garmin Ltd., HEAD Sport GmbH, Naturehike, Newell Brands Inc., Nike Inc., Patagonia Inc., Peloton Interactive Inc., Recreational Equipment Inc., The North Face, Topgolf Callaway Brands Corp., Trek Bicycle Corp., VF Corp., Vista Outdoor Inc. and Yonex Co. Ltd.. The report provides qualitative and quantitative analysis categorizing companies as dominant, leading, strong, tentative, and weak based on their market positioning. Company profiles include business segment analysis, SWOT assessment, key offerings, and recent strategic developments.

Recreational Equipment Market Research Insights

Market dynamics are shaped by a competitive push for innovation across segments, with APAC showing the highest regional growth potential at an 8.7% CAGR, compared to North America's 6.7%. Consumers are increasingly seeking specialized sporting goods that offer tangible performance benefits, driving the adoption of high-performance athletic apparel and outdoor adventure gear.

This trend is evident in the development of professional-grade climbing tools and backcountry safety equipment, which must meet stringent UIAA safety standards. In practice, a user's choice between different ergonomic backpack design models is heavily influenced by reviews of their load distribution efficiency and materials, such as sweat-resistant upholstery on contact points.

This granular focus on user experience and safety compliance is a critical differentiator for brands in a crowded marketplace.

We can help! Our analysts can customize this recreational equipment market research report to meet your requirements.

Get in touch

1. Executive Summary

1.1 Market overview

Executive Summary - Chart on Market Overview
Executive Summary - Data Table on Market Overview
Executive Summary - Chart on Global Market Characteristics
Executive Summary - Chart on Market by Geography
Executive Summary - Chart on Market Segmentation by Product
Executive Summary - Chart on Market Segmentation by End-user
Executive Summary - Chart on Market Segmentation by Distribution Channel
Executive Summary - Chart on Incremental Growth
Executive Summary - Data Table on Incremental Growth
Executive Summary - Chart on Company Market Positioning

2. Technavio Analysis

2.1 Analysis of price sensitivity, lifecycle, customer purchase basket, adoption rates, and purchase criteria

2.2 Criticality of inputs and Factors of differentiation

Chart on Overview on criticality of inputs and factors of differentiation

2.3 Factors of disruption

Chart on Overview on factors of disruption

2.4 Impact of drivers and challenges

Chart on Impact of drivers and challenges in 2025 and 2030

3. Market Landscape

3.1 Market ecosystem

Chart on Parent Market
Data Table on - Parent Market

3.2 Market characteristics

Chart on Market characteristics analysis

3.3 Value chain analysis

Chart on Value chain analysis

4. Market Sizing

4.1 Market definition

Data Table on Offerings of companies included in the market definition

4.2 Market segment analysis

Market segments

4.3 Market size 2025

4.4 Market outlook: Forecast for 2025-2030

Chart on Global - Market size and forecast 2025-2030 ($ million)
Data Table on Global - Market size and forecast 2025-2030 ($ million)
Chart on Global Market: Year-over-year growth 2025-2030 (%)
Data Table on Global Market: Year-over-year growth 2025-2030 (%)

5. Historic Market Size

5.1 Global Recreational Equipment Market 2020 - 2024

Historic Market Size - Data Table on Global Recreational Equipment Market 2020 - 2024 ($ million)

5.2 Product segment analysis 2020 - 2024

Historic Market Size - Product Segment 2020 - 2024 ($ million)

5.3 End-user segment analysis 2020 - 2024

Historic Market Size - End-user Segment 2020 - 2024 ($ million)

5.4 Distribution Channel segment analysis 2020 - 2024

Historic Market Size - Distribution Channel Segment 2020 - 2024 ($ million)

5.5 Geography segment analysis 2020 - 2024

Historic Market Size - Geography Segment 2020 - 2024 ($ million)

5.6 Country segment analysis 2020 - 2024

Historic Market Size - Country Segment 2020 - 2024 ($ million)

6. Qualitative Analysis

6.1 Impact of AI on Global Recreational Equipment Market

6.2 Impact of Geopolitical Conflicts on Global Recreational Equipment Market

7. Five Forces Analysis

7.1 Five forces summary

Five forces analysis - Comparison between 2025 and 2030

7.2 Bargaining power of buyers

Bargaining power of buyers - Impact of key factors 2025 and 2030

7.3 Bargaining power of suppliers

Bargaining power of suppliers - Impact of key factors in 2025 and 2030

7.4 Threat of new entrants

Threat of new entrants - Impact of key factors in 2025 and 2030

7.5 Threat of substitutes

Threat of substitutes - Impact of key factors in 2025 and 2030

7.6 Threat of rivalry

Threat of rivalry - Impact of key factors in 2025 and 2030

7.7 Market condition

Chart on Market condition - Five forces 2025 and 2030

8. Market Segmentation by Product

8.1 Market segments

Chart on Product - Market share 2025-2030 (%)
Data Table on Product - Market share 2025-2030 (%)

8.2 Comparison by Product

Chart on Comparison by Product
Data Table on Comparison by Product

8.3 Camping and hiking gear - Market size and forecast 2025-2030

Chart on Camping and hiking gear - Market size and forecast 2025-2030 ($ million)
Data Table on Camping and hiking gear - Market size and forecast 2025-2030 ($ million)
Chart on Camping and hiking gear - Year-over-year growth 2025-2030 (%)
Data Table on Camping and hiking gear - Year-over-year growth 2025-2030 (%)

8.4 Water sports equipment - Market size and forecast 2025-2030

Chart on Water sports equipment - Market size and forecast 2025-2030 ($ million)
Data Table on Water sports equipment - Market size and forecast 2025-2030 ($ million)
Chart on Water sports equipment - Year-over-year growth 2025-2030 (%)
Data Table on Water sports equipment - Year-over-year growth 2025-2030 (%)

8.5 Cycling equipment - Market size and forecast 2025-2030

Chart on Cycling equipment - Market size and forecast 2025-2030 ($ million)
Data Table on Cycling equipment - Market size and forecast 2025-2030 ($ million)
Chart on Cycling equipment - Year-over-year growth 2025-2030 (%)
Data Table on Cycling equipment - Year-over-year growth 2025-2030 (%)

8.6 Winter sports equipment - Market size and forecast 2025-2030

Chart on Winter sports equipment - Market size and forecast 2025-2030 ($ million)
Data Table on Winter sports equipment - Market size and forecast 2025-2030 ($ million)
Chart on Winter sports equipment - Year-over-year growth 2025-2030 (%)
Data Table on Winter sports equipment - Year-over-year growth 2025-2030 (%)

8.7 Fitness equipment - Market size and forecast 2025-2030

Chart on Fitness equipment - Market size and forecast 2025-2030 ($ million)
Data Table on Fitness equipment - Market size and forecast 2025-2030 ($ million)
Chart on Fitness equipment - Year-over-year growth 2025-2030 (%)
Data Table on Fitness equipment - Year-over-year growth 2025-2030 (%)

8.8 Market opportunity by Product

Market opportunity by Product ($ million)
Data Table on Market opportunity by Product ($ million)

9. Market Segmentation by End-user

9.1 Market segments

Chart on End-user - Market share 2025-2030 (%)
Data Table on End-user - Market share 2025-2030 (%)

9.2 Comparison by End-user

Chart on Comparison by End-user
Data Table on Comparison by End-user

9.3 Residential users - Market size and forecast 2025-2030

Chart on Residential users - Market size and forecast 2025-2030 ($ million)
Data Table on Residential users - Market size and forecast 2025-2030 ($ million)
Chart on Residential users - Year-over-year growth 2025-2030 (%)
Data Table on Residential users - Year-over-year growth 2025-2030 (%)

9.4 Commercial facilities - Market size and forecast 2025-2030

Chart on Commercial facilities - Market size and forecast 2025-2030 ($ million)
Data Table on Commercial facilities - Market size and forecast 2025-2030 ($ million)
Chart on Commercial facilities - Year-over-year growth 2025-2030 (%)
Data Table on Commercial facilities - Year-over-year growth 2025-2030 (%)

9.5 Sports clubs - Market size and forecast 2025-2030

Chart on Sports clubs - Market size and forecast 2025-2030 ($ million)
Data Table on Sports clubs - Market size and forecast 2025-2030 ($ million)
Chart on Sports clubs - Year-over-year growth 2025-2030 (%)
Data Table on Sports clubs - Year-over-year growth 2025-2030 (%)

9.6 Adventure tourism operators - Market size and forecast 2025-2030

Chart on Adventure tourism operators - Market size and forecast 2025-2030 ($ million)
Data Table on Adventure tourism operators - Market size and forecast 2025-2030 ($ million)
Chart on Adventure tourism operators - Year-over-year growth 2025-2030 (%)
Data Table on Adventure tourism operators - Year-over-year growth 2025-2030 (%)

9.7 Market opportunity by End-user

Market opportunity by End-user ($ million)
Data Table on Market opportunity by End-user ($ million)

10. Market Segmentation by Distribution Channel

10.1 Market segments

Chart on Distribution Channel - Market share 2025-2030 (%)
Data Table on Distribution Channel - Market share 2025-2030 (%)

10.2 Comparison by Distribution Channel

Chart on Comparison by Distribution Channel
Data Table on Comparison by Distribution Channel

10.3 Specialty stores - Market size and forecast 2025-2030

Chart on Specialty stores - Market size and forecast 2025-2030 ($ million)
Data Table on Specialty stores - Market size and forecast 2025-2030 ($ million)
Chart on Specialty stores - Year-over-year growth 2025-2030 (%)
Data Table on Specialty stores - Year-over-year growth 2025-2030 (%)

10.4 Mass merchandisers - Market size and forecast 2025-2030

Chart on Mass merchandisers - Market size and forecast 2025-2030 ($ million)
Data Table on Mass merchandisers - Market size and forecast 2025-2030 ($ million)
Chart on Mass merchandisers - Year-over-year growth 2025-2030 (%)
Data Table on Mass merchandisers - Year-over-year growth 2025-2030 (%)

10.5 Online retailers - Market size and forecast 2025-2030

Chart on Online retailers - Market size and forecast 2025-2030 ($ million)
Data Table on Online retailers - Market size and forecast 2025-2030 ($ million)
Chart on Online retailers - Year-over-year growth 2025-2030 (%)
Data Table on Online retailers - Year-over-year growth 2025-2030 (%)

10.6 Department stores - Market size and forecast 2025-2030

Chart on Department stores - Market size and forecast 2025-2030 ($ million)
Data Table on Department stores - Market size and forecast 2025-2030 ($ million)
Chart on Department stores - Year-over-year growth 2025-2030 (%)
Data Table on Department stores - Year-over-year growth 2025-2030 (%)

10.7 Market opportunity by Distribution Channel

Market opportunity by Distribution Channel ($ million)
Data Table on Market opportunity by Distribution Channel ($ million)

11. Customer Landscape

11.1 Customer landscape overview

Analysis of price sensitivity, lifecycle, customer purchase basket, adoption rates, and purchase criteria

12. Geographic Landscape

12.1 Geographic segmentation

Chart on Market share by geography 2025-2030 (%)
Data Table on Market share by geography 2025-2030 (%)

12.2 Geographic comparison

Chart on Geographic comparison
Data Table on Geographic comparison

12.3 North America - Market size and forecast 2025-2030

Chart on North America - Market size and forecast 2025-2030 ($ million)
Data Table on North America - Market size and forecast 2025-2030 ($ million)
Chart on North America - Year-over-year growth 2025-2030 (%)
Data Table on North America - Year-over-year growth 2025-2030 (%)
Chart on Regional Comparison - North America
Data Table on Regional Comparison - North America

12.3.1 US - Market size and forecast 2025-2030

Chart on US - Market size and forecast 2025-2030 ($ million)
Data Table on US - Market size and forecast 2025-2030 ($ million)
Chart on US - Year-over-year growth 2025-2030 (%)
Data Table on US - Year-over-year growth 2025-2030 (%)

12.3.2 Canada - Market size and forecast 2025-2030

Chart on Canada - Market size and forecast 2025-2030 ($ million)
Data Table on Canada - Market size and forecast 2025-2030 ($ million)
Chart on Canada - Year-over-year growth 2025-2030 (%)
Data Table on Canada - Year-over-year growth 2025-2030 (%)

12.3.3 Mexico - Market size and forecast 2025-2030

Chart on Mexico - Market size and forecast 2025-2030 ($ million)
Data Table on Mexico - Market size and forecast 2025-2030 ($ million)
Chart on Mexico - Year-over-year growth 2025-2030 (%)
Data Table on Mexico - Year-over-year growth 2025-2030 (%)

12.4 Europe - Market size and forecast 2025-2030

Chart on Europe - Market size and forecast 2025-2030 ($ million)
Data Table on Europe - Market size and forecast 2025-2030 ($ million)
Chart on Europe - Year-over-year growth 2025-2030 (%)
Data Table on Europe - Year-over-year growth 2025-2030 (%)
Chart on Regional Comparison - Europe
Data Table on Regional Comparison - Europe

12.4.1 Germany - Market size and forecast 2025-2030

Chart on Germany - Market size and forecast 2025-2030 ($ million)
Data Table on Germany - Market size and forecast 2025-2030 ($ million)
Chart on Germany - Year-over-year growth 2025-2030 (%)
Data Table on Germany - Year-over-year growth 2025-2030 (%)

12.4.2 UK - Market size and forecast 2025-2030

Chart on UK - Market size and forecast 2025-2030 ($ million)
Data Table on UK - Market size and forecast 2025-2030 ($ million)
Chart on UK - Year-over-year growth 2025-2030 (%)
Data Table on UK - Year-over-year growth 2025-2030 (%)

12.4.3 France - Market size and forecast 2025-2030

Chart on France - Market size and forecast 2025-2030 ($ million)
Data Table on France - Market size and forecast 2025-2030 ($ million)
Chart on France - Year-over-year growth 2025-2030 (%)
Data Table on France - Year-over-year growth 2025-2030 (%)

12.4.4 Italy - Market size and forecast 2025-2030

Chart on Italy - Market size and forecast 2025-2030 ($ million)
Data Table on Italy - Market size and forecast 2025-2030 ($ million)
Chart on Italy - Year-over-year growth 2025-2030 (%)
Data Table on Italy - Year-over-year growth 2025-2030 (%)

12.4.5 Spain - Market size and forecast 2025-2030

Chart on Spain - Market size and forecast 2025-2030 ($ million)
Data Table on Spain - Market size and forecast 2025-2030 ($ million)
Chart on Spain - Year-over-year growth 2025-2030 (%)
Data Table on Spain - Year-over-year growth 2025-2030 (%)

12.4.6 The Netherlands - Market size and forecast 2025-2030

Chart on The Netherlands - Market size and forecast 2025-2030 ($ million)
Data Table on The Netherlands - Market size and forecast 2025-2030 ($ million)
Chart on The Netherlands - Year-over-year growth 2025-2030 (%)
Data Table on The Netherlands - Year-over-year growth 2025-2030 (%)

12.5 APAC - Market size and forecast 2025-2030

Chart on APAC - Market size and forecast 2025-2030 ($ million)
Data Table on APAC - Market size and forecast 2025-2030 ($ million)
Chart on APAC - Year-over-year growth 2025-2030 (%)
Data Table on APAC - Year-over-year growth 2025-2030 (%)
Chart on Regional Comparison - APAC
Data Table on Regional Comparison - APAC

12.5.1 China - Market size and forecast 2025-2030

Chart on China - Market size and forecast 2025-2030 ($ million)
Data Table on China - Market size and forecast 2025-2030 ($ million)
Chart on China - Year-over-year growth 2025-2030 (%)
Data Table on China - Year-over-year growth 2025-2030 (%)

12.5.2 India - Market size and forecast 2025-2030

Chart on India - Market size and forecast 2025-2030 ($ million)
Data Table on India - Market size and forecast 2025-2030 ($ million)
Chart on India - Year-over-year growth 2025-2030 (%)
Data Table on India - Year-over-year growth 2025-2030 (%)

12.5.3 Japan - Market size and forecast 2025-2030

Chart on Japan - Market size and forecast 2025-2030 ($ million)
Data Table on Japan - Market size and forecast 2025-2030 ($ million)
Chart on Japan - Year-over-year growth 2025-2030 (%)
Data Table on Japan - Year-over-year growth 2025-2030 (%)

12.5.4 South Korea - Market size and forecast 2025-2030

Chart on South Korea - Market size and forecast 2025-2030 ($ million)
Data Table on South Korea - Market size and forecast 2025-2030 ($ million)
Chart on South Korea - Year-over-year growth 2025-2030 (%)
Data Table on South Korea - Year-over-year growth 2025-2030 (%)

12.5.5 Australia - Market size and forecast 2025-2030

Chart on Australia - Market size and forecast 2025-2030 ($ million)
Data Table on Australia - Market size and forecast 2025-2030 ($ million)
Chart on Australia - Year-over-year growth 2025-2030 (%)
Data Table on Australia - Year-over-year growth 2025-2030 (%)

12.5.6 Indonesia - Market size and forecast 2025-2030

Chart on Indonesia - Market size and forecast 2025-2030 ($ million)
Data Table on Indonesia - Market size and forecast 2025-2030 ($ million)
Chart on Indonesia - Year-over-year growth 2025-2030 (%)
Data Table on Indonesia - Year-over-year growth 2025-2030 (%)

12.6 South America - Market size and forecast 2025-2030

Chart on South America - Market size and forecast 2025-2030 ($ million)
Data Table on South America - Market size and forecast 2025-2030 ($ million)
Chart on South America - Year-over-year growth 2025-2030 (%)
Data Table on South America - Year-over-year growth 2025-2030 (%)
Chart on Regional Comparison - South America
Data Table on Regional Comparison - South America

12.6.1 Brazil - Market size and forecast 2025-2030

Chart on Brazil - Market size and forecast 2025-2030 ($ million)
Data Table on Brazil - Market size and forecast 2025-2030 ($ million)
Chart on Brazil - Year-over-year growth 2025-2030 (%)
Data Table on Brazil - Year-over-year growth 2025-2030 (%)

12.6.2 Argentina - Market size and forecast 2025-2030

Chart on Argentina - Market size and forecast 2025-2030 ($ million)
Data Table on Argentina - Market size and forecast 2025-2030 ($ million)
Chart on Argentina - Year-over-year growth 2025-2030 (%)
Data Table on Argentina - Year-over-year growth 2025-2030 (%)

12.6.3 Colombia - Market size and forecast 2025-2030

Chart on Colombia - Market size and forecast 2025-2030 ($ million)
Data Table on Colombia - Market size and forecast 2025-2030 ($ million)
Chart on Colombia - Year-over-year growth 2025-2030 (%)
Data Table on Colombia - Year-over-year growth 2025-2030 (%)

12.7 Middle East and Africa - Market size and forecast 2025-2030

Chart on Middle East and Africa - Market size and forecast 2025-2030 ($ million)
Data Table on Middle East and Africa - Market size and forecast 2025-2030 ($ million)
Chart on Middle East and Africa - Year-over-year growth 2025-2030 (%)
Data Table on Middle East and Africa - Year-over-year growth 2025-2030 (%)
Chart on Regional Comparison - Middle East and Africa
Data Table on Regional Comparison - Middle East and Africa

12.7.1 Saudi Arabia - Market size and forecast 2025-2030

Chart on Saudi Arabia - Market size and forecast 2025-2030 ($ million)
Data Table on Saudi Arabia - Market size and forecast 2025-2030 ($ million)
Chart on Saudi Arabia - Year-over-year growth 2025-2030 (%)
Data Table on Saudi Arabia - Year-over-year growth 2025-2030 (%)

12.7.2 UAE - Market size and forecast 2025-2030

Chart on UAE - Market size and forecast 2025-2030 ($ million)
Data Table on UAE - Market size and forecast 2025-2030 ($ million)
Chart on UAE - Year-over-year growth 2025-2030 (%)
Data Table on UAE - Year-over-year growth 2025-2030 (%)

12.7.3 South Africa - Market size and forecast 2025-2030

Chart on South Africa - Market size and forecast 2025-2030 ($ million)
Data Table on South Africa - Market size and forecast 2025-2030 ($ million)
Chart on South Africa - Year-over-year growth 2025-2030 (%)
Data Table on South Africa - Year-over-year growth 2025-2030 (%)

12.7.4 Turkey - Market size and forecast 2025-2030

Chart on Turkey - Market size and forecast 2025-2030 ($ million)
Data Table on Turkey - Market size and forecast 2025-2030 ($ million)
Chart on Turkey - Year-over-year growth 2025-2030 (%)
Data Table on Turkey - Year-over-year growth 2025-2030 (%)

12.7.5 Israel - Market size and forecast 2025-2030

Chart on Israel - Market size and forecast 2025-2030 ($ million)
Data Table on Israel - Market size and forecast 2025-2030 ($ million)
Chart on Israel - Year-over-year growth 2025-2030 (%)
Data Table on Israel - Year-over-year growth 2025-2030 (%)

12.8 Market opportunity by geography

Market opportunity by geography ($ million)
Data Tables on Market opportunity by geography ($ million)

13. Drivers, Challenges, and Opportunity

13.1 Market drivers

Increasing consumer focus on health and wellness
Technological advancements in sporting gear
Expansion of electronic commerce channels

13.2 Market challenges

Volatility in raw material costs and supply chain instabilities
Stringent environmental regulations and sustainability mandates
Economic uncertainty and reduced discretionary

13.3 Impact of drivers and challenges

Impact of drivers and challenges in 2025 and 2030

13.4 Market opportunities

Rise of sustainable and eco-friendly manufacturing practices
Emergence of circular economy and rental models
Growth of experiential tourism and micro-adventures

14. Competitive Landscape

14.1 Overview

14.2

Overview on criticality of inputs and factors of differentiation

14.3 Landscape disruption

Overview on factors of disruption

14.4 Industry risks

Impact of key risks on business

15. Competitive Analysis

15.1 Companies profiled

Companies covered

15.2 Company ranking index

15.3 Market positioning of companies

Matrix on companies position and classification

15.4 Amer Sports Corp.

Amer Sports Corp. - Overview
Amer Sports Corp. - Business segments
Amer Sports Corp. - Key offerings
Amer Sports Corp. - Segment focus
SWOT

15.5 Brunswick Corp.

Brunswick Corp. - Overview
Brunswick Corp. - Business segments
Brunswick Corp. - Key news
Brunswick Corp. - Key offerings
Brunswick Corp. - Segment focus
SWOT

15.6 Columbia Sportswear Co.

Columbia Sportswear Co. - Overview
Columbia Sportswear Co. - Business segments
Columbia Sportswear Co. - Key offerings
Columbia Sportswear Co. - Segment focus
SWOT

15.7 Decathlon SA

Decathlon SA - Overview
Decathlon SA - Product / Service
Decathlon SA - Key offerings
SWOT

15.8 Garmin Ltd.

Garmin Ltd. - Overview
Garmin Ltd. - Business segments
Garmin Ltd. - Key news
Garmin Ltd. - Key offerings
Garmin Ltd. - Segment focus
SWOT

15.9 HEAD Sport GmbH

HEAD Sport GmbH - Overview
HEAD Sport GmbH - Product / Service
HEAD Sport GmbH - Key offerings
SWOT

15.10 Newell Brands Inc.

Newell Brands Inc. - Overview
Newell Brands Inc. - Business segments
Newell Brands Inc. - Key offerings
Newell Brands Inc. - Segment focus
SWOT

15.11 Nike Inc.

Nike Inc. - Overview
Nike Inc. - Business segments
Nike Inc. - Key offerings
Nike Inc. - Segment focus
SWOT

15.12 Patagonia Inc.

Patagonia Inc. - Overview
Patagonia Inc. - Product / Service
Patagonia Inc. - Key offerings
SWOT

15.13 The North Face

The North Face - Overview
The North Face - Product / Service
The North Face - Key offerings
SWOT

15.14 Topgolf Callaway Brands Corp.

Topgolf Callaway Brands Corp. - Overview
Topgolf Callaway Brands Corp. - Business segments
Topgolf Callaway Brands Corp. - Key offerings
Topgolf Callaway Brands Corp. - Segment focus
SWOT

15.15 Trek Bicycle Corp.

Trek Bicycle Corp. - Overview
Trek Bicycle Corp. - Product / Service
Trek Bicycle Corp. - Key offerings
SWOT

15.16 VF Corp.

VF Corp. - Overview
VF Corp. - Business segments
VF Corp. - Key offerings
VF Corp. - Segment focus
SWOT

15.17 Vista Outdoor Inc.

Vista Outdoor Inc. - Overview
Vista Outdoor Inc. - Business segments
Vista Outdoor Inc. - Key offerings
Vista Outdoor Inc. - Segment focus
SWOT

15.18 Yonex Co. Ltd.

Yonex Co. Ltd. - Overview
Yonex Co. Ltd. - Business segments
Yonex Co. Ltd. - Key offerings
Yonex Co. Ltd. - Segment focus
SWOT

16. Appendix

16.1 Scope of the report

Market definition
Objectives
Notes and caveats

16.2 Inclusions and exclusions checklist

Inclusions checklist
Exclusions checklist

16.3 Currency conversion rates for US$

16.4 Research methodology

16.5 Data procurement

Information sources

16.6 Data validation

16.7 Validation techniques employed for market sizing

16.8 Data synthesis

16.9 360 degree market analysis

16.10 List of abbreviations

Research Methodology

Technavio presents a detailed picture of the market by way of study, synthesis, and summation of data from multiple sources. The analysts have presented the various facets of the market with a particular focus on identifying the key industry influencers. The data thus presented is comprehensive, reliable, and the result of extensive research, both primary and secondary.

INFORMATION SOURCES

Primary sources

  • Manufacturers and suppliers
  • Channel partners
  • Industry experts
  • Strategic decision makers

Secondary sources

  • Industry journals and periodicals
  • Government data
  • Financial reports of key industry players
  • Historical data
  • Press releases

DATA ANALYSIS

Data Synthesis

  • Collation of data
  • Estimation of key figures
  • Analysis of derived insights

Data Validation

  • Triangulation with data models
  • Reference against proprietary databases
  • Corroboration with industry experts

REPORT WRITING

Qualitative

  • Market drivers
  • Market challenges
  • Market trends
  • Five forces analysis

Quantitative

  • Market size and forecast
  • Market segmentation
  • Geographical insights
  • Competitive landscape

Interested in this report?

Get your sample now to see our research methodology and insights!

Download Now

Frequently Asked Questions

Recreational Equipment market growth will increase by USD 45929.7 million during 2026-2030.

The Recreational Equipment market is expected to grow at a CAGR of 7.5% during 2026-2030.

Recreational Equipment market is segmented by Product (Camping and hiking gear, Water sports equipment, Cycling equipment, Winter sports equipment, Fitness equipment) End-user (Residential users, Commercial facilities, Sports clubs, Adventure tourism operators) Distribution channel (Specialty stores, Mass merchandisers, Online retailers, Department stores)

Amer Sports Corp., Brunswick Corp., Clarus Corp., Columbia Sportswear Co., Decathlon SA, Deckers Outdoor Corp., Garmin Ltd., HEAD Sport GmbH, Naturehike, Newell Brands Inc., Nike Inc., Patagonia Inc., Peloton Interactive Inc., Recreational Equipment Inc., The North Face, Topgolf Callaway Brands Corp., Trek Bicycle Corp., VF Corp., Vista Outdoor Inc., Yonex Co. Ltd. are a few of the key vendors in the Recreational Equipment market.

APAC will register the highest growth rate of 29.2% among the other regions. Therefore, the Recreational Equipment market in APAC is expected to garner significant business opportunities for the vendors during the forecast period.

US, Canada, Mexico, Germany, UK, France, Italy, Spain, The Netherlands, China, India, Japan, South Korea, Australia, Indonesia, Brazil, Argentina, Colombia, Saudi Arabia, UAE, South Africa, Turkey, Israel

  • Increasing consumer focus on health and wellness is the driving factor this market.

The Recreational Equipment market vendors should focus on grabbing business opportunities from the Product segment as it accounted for the largest market share in the base year.
RIA - Research AI Assistant
Ask RIA