Playing Cards Market Analysis, Size, and Forecast 2026-2030: APAC (China, India, and Japan), North America (US, Canada, and Mexico), Europe (Germany, UK, and France), South America (Brazil, Argentina, and Colombia), Middle East and Africa (South Africa, Saudi Arabia, and UAE), and Rest of World (ROW)

Playing Cards Market Analysis, Size, and Forecast 2026-2030:
APAC (China, India, and Japan), North America (US, Canada, and Mexico), Europe (Germany, UK, and France), South America (Brazil, Argentina, and Colombia), Middle East and Africa (South Africa, Saudi Arabia, and UAE), and Rest of World (ROW)

Published: May 2026 297 Pages SKU: IRTNTR81453

Market Overview at a Glance

$804.7 Mn
Market Opportunity
4.7%
CAGR 2025 - 2030
40.4%
APAC Growth
$1.59 B
Paper segment 2024

Playing Cards Market Size 2026-2030

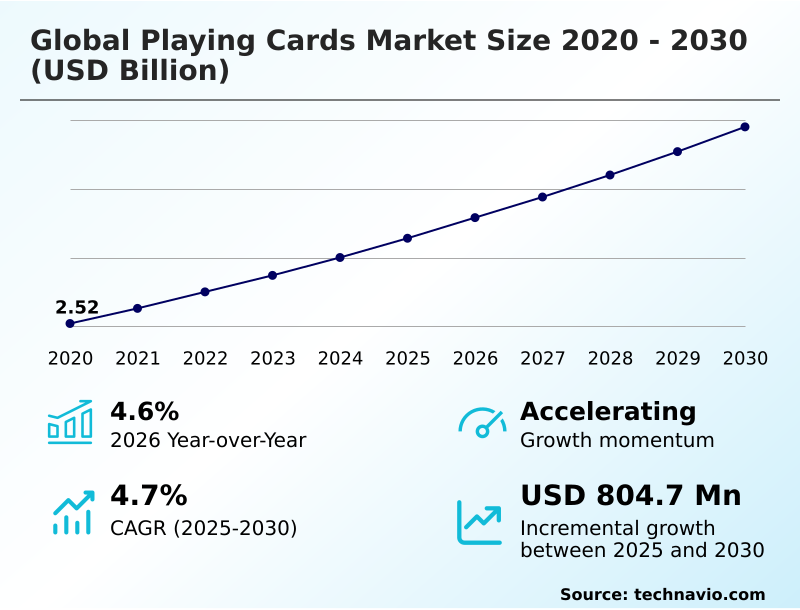
The Playing Cards Market size was valued at USD 3.14 billion in 2025, growing at a CAGR of 4.7% during the forecast period 2026-2030.

Major Market Trends & Insights

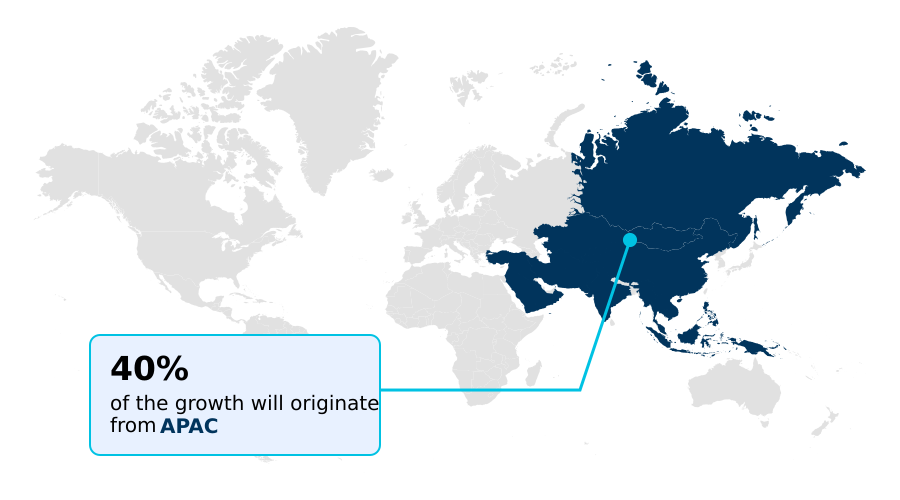
  • APAC dominated the market and accounted for a 40.4% growth during the forecast period.
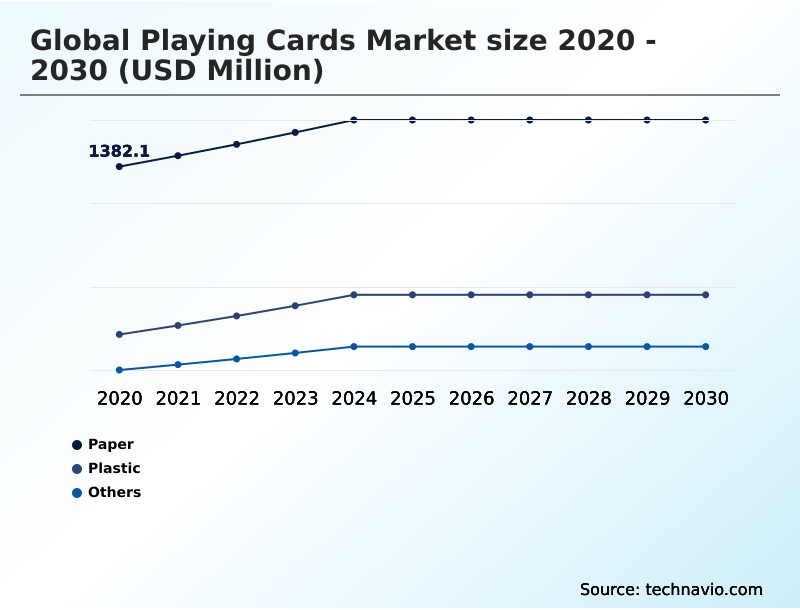
  • By Material - Paper segment was valued at USD 1.59 billion in 2024
  • By Application - Home entertainment segment accounted for the largest market revenue share in 2024

Market Size & Forecast

  • Historic Market Opportunities 2020-2024: USD 1.42 billion
  • Market Future Opportunities 2025-2030: USD 804.7 million
  • CAGR from 2025 to 2030 : 4.7%

Market Summary

  • The playing cards market demonstrates notable resilience by adapting to modern consumer preferences, with the paper segment alone projected to grow by 4.7% annually. This expansion is driven by a societal shift toward tactile, screen-free entertainment, which has revitalized tabletop gaming culture.
  • A key business strategy involves material innovation; for example, manufacturers are transitioning to forest-certified paper and biodegradable coatings, a move that can increase material costs by 10% but appeals to an eco-conscious consumer base. This driver helps counteract the primary challenge: competition from digital entertainment platforms, which capture a significant share of leisure time.
  • Despite this, the demand from professional sectors like casinos, which require high-volume, continuous replacement of decks to ensure game integrity, provides a stable revenue stream, with some establishments replacing decks after a single use to maintain security.

What will be the Size of the Playing Cards Market during the forecast period?

Get Key Insights on Market Forecast (PDF) Request Free Sample

How is the Playing Cards Market Segmented?

The playing cards industry research report provides comprehensive data (region-wise segment analysis), with forecasts and analysis for the period 2026-2030, as well as historical data from 2020-2024 for the following segments.

  • Material
    • Paper
    • Plastic
    • Others
  • Application
    • Home entertainment
    • Casino and gambling
    • Tournament gaming
    • Others
  • Distribution channel
    • Offline
    • Online
  • Geography
    • APAC
      • China
      • India
      • Japan
    • North America
      • US
      • Canada
      • Mexico
    • Europe
      • Germany
      • UK
      • France
    • South America
      • Brazil
      • Argentina
      • Colombia
    • Middle East and Africa
      • South Africa
      • Saudi Arabia
      • UAE
    • Rest of World (ROW)

How is the Playing Cards Market Segmented by Material?

The paper segment is estimated to witness significant growth during the forecast period.

The playing cards market is segmented by material, application, and distribution channel, with each segment reflecting distinct consumer behaviors and supply chain requirements.

The paper segment dominates, accounting for over 52% of the market, driven by its cost-effectiveness for the mass market and advancements in paper engineering.

In contrast, the plastic segment, utilizing synthetic polymers, exhibits robust growth in professional settings, where its durability can reduce replacement costs by up to 40%.

The home entertainment application holds a 37% share, underscoring the product's role in tactile social interactions.

This preference supports the offline distribution channel, which still captures over 65% of sales, demonstrating the value consumers place on physically assessing packaging and card quality before purchase.

Request Free Sample

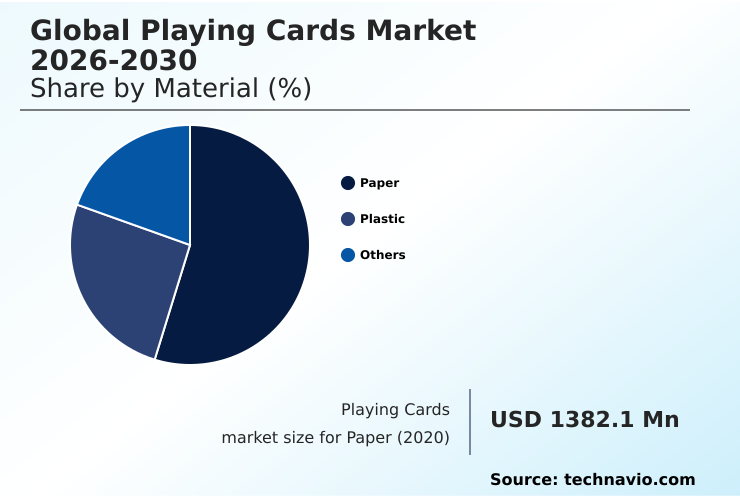
The Paper segment was valued at USD 1.59 billion in 2024 and showed a gradual increase during the forecast period.

Request Free Sample

How demand for the Playing Cards market is rising in the leading region?

APAC is estimated to contribute 40.4% to the growth of the global market during the forecast period.Technavio’s analysts have elaborately explained the regional trends and drivers that shape the market during the forecast period.

See How Playing Cards Market demand is rising in APAC Request Free Sample

The geographic landscape of the playing cards market is led by APAC, which is projected to contribute 40.4% of the market's total incremental growth, expanding at a CAGR of 5.2%.

This outpaces the more mature markets of North America and Europe, which are forecast to grow at 4.9% and 3.9%, respectively.

The dynamism in APAC is driven by countries like China, with a market size of $399.7 million in 2025, and the rapid expansion of casino operations across the region.

This institutional demand for high-security, professional-grade decks contrasts with North America, where the market is heavily influenced by the trend of collector-centric editions and artisanal design.

This divergence requires manufacturers to adapt their product strategies, focusing on security features for APAC and tactile aesthetics for North American consumers.

What are the key Drivers, Trends, and Challenges in the Playing Cards Market?

Our researchers analyzed the data with 2025 as the base year, along with the key drivers, trends, and challenges. A holistic analysis of drivers will help companies refine their marketing strategies to gain a competitive advantage.

  • The evolving regulatory and technological landscape is compelling manufacturers to rethink production from the ground up. For instance, high-security rfid playing card regulations in major gaming jurisdictions are no longer a niche requirement but a new standard, forcing investment in advanced printing and embedding technologies.
  • This intersects with a powerful consumer-driven movement toward sustainable manufacturing in casino supplies, where the focus extends beyond simple recycling. The development of new biodegradable coatings for playing cards is a key R&D focus, with successful formulations reducing landfill waste from a single large casino by over 25% annually.
  • These material science advancements are now influencing artisanal playing card design trends, where eco-credentials have become a significant marketing feature. Simultaneously, digital integration in physical card games is adapting to these new materials, ensuring that augmented reality features function flawlessly on non-traditional surfaces.
  • This convergence of security, sustainability, and technology creates a complex but highly innovative market where adapting to one trend often requires investment across all three, a challenge that separates market leaders from followers.

What are the key market drivers leading to the rise in the adoption of Playing Cards Industry?

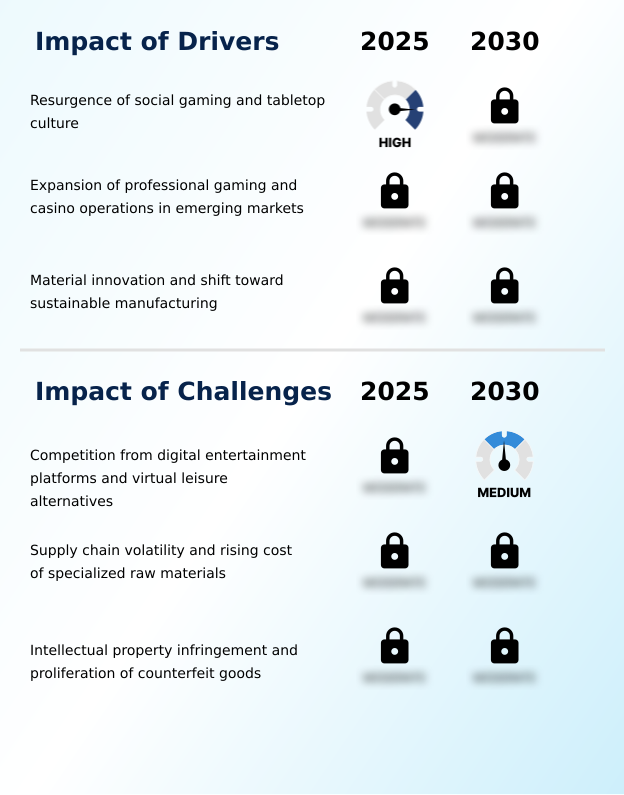
  • The resurgence of social gaming and tabletop culture is a key driver, renewing demand for tactile, screen-free entertainment and interpersonal connection.

  • A primary driver for the playing cards market is the industry-wide shift toward sustainability, with products made from sustainable materials seeing a 15% higher adoption rate among younger consumer demographics.
  • This trend compels manufacturers to prioritize the use of forest-certified paper and move away from traditional synthetic polymers.
  • The development and adoption of new water-borne coatings and vegetable-based inks not only meet stricter environmental regulations but also serve as a key brand differentiator.
  • While this transition can increase initial production costs by approximately 10%, it aligns with the growing demand for circular production models and enhances long-term brand loyalty in an increasingly eco-conscious market.

What are the market trends shaping the Playing Cards Industry?

  • The proliferation of artisanal designs and collector-centric limited editions is an increasingly significant trend. This shift positions playing cards as high-value, functional art objects.

  • The integration of digital technologies with physical playing cards, known as phygital gaming, is a dominant market trend, increasing player engagement by an estimated 30% compared to traditional formats. This evolution leverages augmented reality integration, where mobile apps recognize card designs to unlock interactive content, and RFID embedded cards, which automate tracking in professional gaming.
  • The adoption of a universal object recognition protocol has been pivotal, reducing development costs for hybrid gaming experiences by up to 40%. This trend moves beyond simple card manipulation, enhancing the tactile aesthetics of the physical product with a layer of digital interactivity, a feature particularly popular in tech-forward markets.

What challenges does the Playing Cards Industry face during its growth?

  • A key challenge affecting industry growth is the escalating competition from digital entertainment platforms and immersive virtual leisure alternatives.

  • A significant challenge confronting the playing cards market is intellectual property infringement, with counterfeit goods eroding revenues for legitimate creators of artisanal designs by an estimated 20-25%. These unauthorized replicas, often sold through online marketplaces, lack the sophisticated security features like micro-printing and ultraviolet markings found in authentic products.
  • This not only results in direct financial loss but also damages brand reputation, as the fakes are produced with inferior materials that fail to replicate the intended air-cushion finish and tactile aesthetics. Consequently, manufacturers are forced to invest heavily in anti-counterfeiting technologies, which can increase unit costs by 5-10%.

Exclusive Technavio Analysis on Customer Landscape

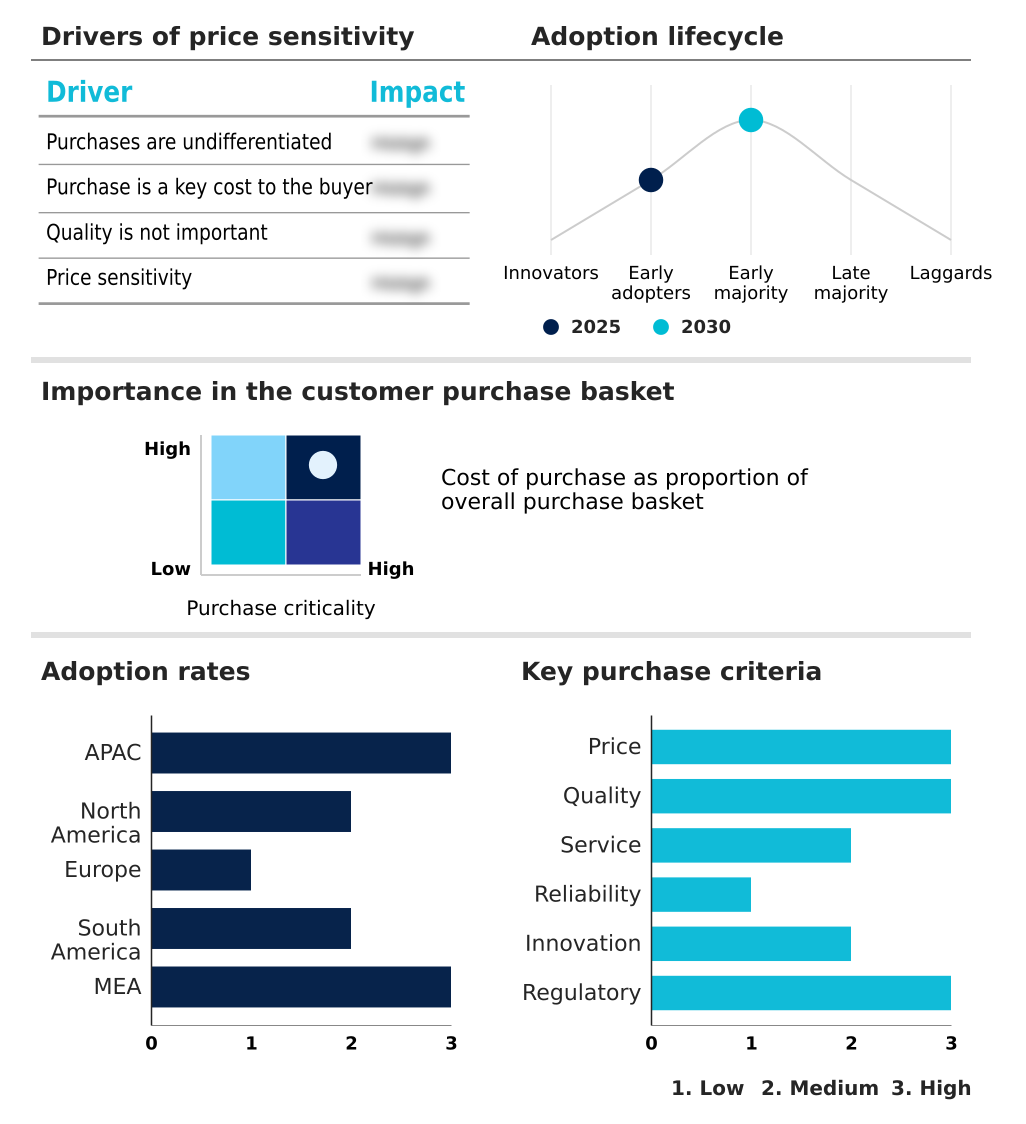
The playing cards market forecasting report includes the adoption lifecycle of the market, covering from the innovator’s stage to the laggard’s stage. It focuses on adoption rates in different regions based on penetration. Furthermore, the playing cards market report also includes key purchase criteria and drivers of price sensitivity to help companies evaluate and develop their market growth analysis strategies.

Customer Landscape of Playing Cards Industry

Competitive Landscape

Companies are implementing various strategies, such as strategic alliances, playing cards market forecast, partnerships, mergers and acquisitions, geographical expansion, and product/service launches, to enhance their presence in the industry.

Angel Playing Cards Co.Ltd. - Key offerings span from standard paper decks for casual use to high-durability plastic cards for casinos and premium, artistically designed collectibles for enthusiasts and professionals.

The industry research and growth report includes detailed analyses of the competitive landscape of the market and information about key companies, including:

  • Angel Playing Cards Co.Ltd.
  • Art of Play
  • Cartamundi Group
  • Copag USA
  • Ellusionist
  • Expert Playing Card Co.
  • Kings Wild Project Inc
  • Kuo Kau Paper Products Co.Ltd.
  • Legends Playing Card Co.
  • Modiano S.p.A.
  • Naipes Heraclio Fournier, S.A.
  • Nintendo Co. Ltd.
  • QP Group Holdings Ltd.
  • Riffle Shuffle Playing Card Co.
  • Shanghai Three-A Playing Cards Co.Ltd.
  • Shenzhen Wangjing Printing Co.
  • Shuffled Ink
  • Teodoro Dal Negro S.p.A.
  • Theory11.
  • Wiener Spielkartenfabrik Ferd.

Qualitative and quantitative analysis of companies has been conducted to help clients understand the wider business environment as well as the strengths and weaknesses of key industry players. Data is qualitatively analyzed to categorize companies as pure play, category-focused, industry-focused, and diversified; it is quantitatively analyzed to categorize companies as dominant, leading, strong, tentative, and weak.

Market Intelligence Radar: High-Impact Developments & Growth Signals

  • In the Leisure Products industry, rising dual-income households have increased discretionary spending, directly boosting sales of premium and collector-centric editions of playing cards, which are increasingly positioned as affordable luxury goods and part of a broader tabletop gaming culture.
  • The strong growth in online sales and omnichannel retailing strategies across the leisure sector has enabled niche playing card manufacturers, especially those focused on artisanal design, to bypass traditional distribution and reach a global audience directly, fostering material innovation.
  • Heightened regulatory compliance regarding toy safety and material content, including restrictions on certain chemicals, has influenced the playing cards market to adopt safer, non-toxic materials like vegetable-based inks and water-borne coatings, aligning with the trend towards sustainable materials.
  • A growing consumer emphasis on healthy lifestyles and screen-free entertainment has revitalized interest in traditional social activities, positioning playing cards as a key tool for cognitive engagement and fostering tactile social interactions away from digital entertainment platforms.

Dive into Technavio’s robust research methodology, blending expert interviews, extensive data synthesis, and validated models for unparalleled Playing Cards Market insights. See full methodology.

Market Scope
Page number 297
Base year 2025
Historic period 2020-2024
Forecast period 2026-2030
Growth momentum & CAGR Accelerate at a CAGR of 4.7%
Market growth 2026-2030 USD 804.7 million
Market structure Fragmented
YoY growth 2025-2026(%) 4.6%
Key countries China, India, Japan, South Korea, Australia, Indonesia, US, Canada, Mexico, Germany, UK, France, Russia, Italy, Spain, Brazil, Argentina, Colombia, South Africa, Saudi Arabia, UAE, Turkey and Egypt
Competitive landscape Leading Companies, Market Positioning of Companies, Competitive Strategies, and Industry Risks

Request Free Sample

Research Analyst Overview

  • The playing cards market ecosystem is a complex value chain that begins with suppliers of raw materials like high-density paper pulp and synthetic polymers, with paper-based materials constituting over 52% of the market. Manufacturers such as Cartamundi Group and various boutique firms transform these inputs using specialized processes to create products with specific tactile aesthetics and security features.
  • Regulatory bodies, including gaming commissions, heavily influence the high-stakes casino segment by mandating standards for card integrity. Distribution is handled through a mix of online platforms, which are growing at a rate 15% faster than traditional retail, and brick-and-mortar stores.
  • The end-users range from home consumers driving the entertainment segment, which holds a 37% share, to professional casinos and tournament organizers who prioritize durability and anti-tampering technology.

What are the Key Data Covered in this Playing Cards Market Research and Growth Report?

  • What is the expected growth of the Playing Cards Market between 2026 and 2030?

    • The Playing Cards Market is expected to grow by USD 804.7 million during 2026-2030, registering a CAGR of 4.7%. Year-over-year growth in 2026 is estimated at 4.6%%. This acceleration is shaped by resurgence of social gaming and tabletop culture, which is intensifying demand across multiple end-use verticals covered in the report.

  • What segmentation does the market report cover?

    • The report is segmented by Material (Paper, Plastic, and Others), Application (Home entertainment, Casino and gambling, Tournament gaming, and Others), Distribution Channel (Offline, and Online) and Geography (APAC, North America, Europe, South America, Middle East and Africa). Among these, the Paper segment is estimated to witness significant growth during the forecast period, driven by rising adoption across key application areas. Each segment includes detailed qualitative and quantitative analysis, along with historical data from 2020-2024 and forecasts through 2030 with year-over-year growth rates.

  • Which regions are analyzed in the report?

    • The report covers APAC, North America, Europe, South America and Middle East and Africa. APAC is estimated to contribute 40.4% to market growth during the forecast period. Country-level analysis includes China, India, Japan, South Korea, Australia, Indonesia, US, Canada, Mexico, Germany, UK, France, Russia, Italy, Spain, Brazil, Argentina, Colombia, South Africa, Saudi Arabia, UAE, Turkey and Egypt, with dedicated market size tables and year-over-year growth for each.

  • What are the key growth drivers and market challenges?

    • The primary driver is resurgence of social gaming and tabletop culture, which is accelerating investment and industry demand. The main challenge is competition from digital entertainment platforms and virtual leisure alternatives, creating operational barriers for key market participants. The report quantifies the impact of each driver and challenge across 2026 and 2030 with comparative analysis.

  • Who are the major players in the Playing Cards Market?

    • Key vendors include Angel Playing Cards Co.Ltd., Art of Play, Cartamundi Group, Copag USA, Ellusionist, Expert Playing Card Co., Kings Wild Project Inc, Kuo Kau Paper Products Co.Ltd., Legends Playing Card Co., Modiano S.p.A., Naipes Heraclio Fournier, S.A., Nintendo Co. Ltd., QP Group Holdings Ltd., Riffle Shuffle Playing Card Co., Shanghai Three-A Playing Cards Co.Ltd., Shenzhen Wangjing Printing Co., Shuffled Ink, Teodoro Dal Negro S.p.A., Theory11. and Wiener Spielkartenfabrik Ferd.. The report provides qualitative and quantitative analysis categorizing companies as dominant, leading, strong, tentative, and weak based on their market positioning. Company profiles include business segment analysis, SWOT assessment, key offerings, and recent strategic developments.

Market Research Insights

  • The competitive landscape for playing cards is consolidated at the top, with the five largest vendors accounting for over 35% of market share, yet vibrant due to a thriving niche segment. Large-scale manufacturers like Cartamundi Group focus on volume and expanding their global manufacturing footprint, recently launching initiatives to reclaim used plastic cards from casinos.
  • In contrast, boutique firms such as Theory11. excel in the luxury and collector segments, leveraging high-concept graphic design and premium packaging, which command prices up to 500% higher than standard decks. These vendors navigate significant supply chain volatility, particularly in the cost of specialized paper pulp and coatings.
  • Successful adaptation involves diversifying sourcing and investing in material science to create proprietary finishes, a key differentiator in both professional and collector markets.

We can help! Our analysts can customize this playing cards market research report to meet your requirements.

Get in touch

1. Executive Summary

1.1 Market overview

Executive Summary - Chart on Market Overview
Executive Summary - Data Table on Market Overview
Executive Summary - Chart on Global Market Characteristics
Executive Summary - Chart on Market by Geography
Executive Summary - Chart on Market Segmentation by Material
Executive Summary - Chart on Market Segmentation by Application
Executive Summary - Chart on Market Segmentation by Distribution Channel
Executive Summary - Chart on Incremental Growth
Executive Summary - Data Table on Incremental Growth
Executive Summary - Chart on Company Market Positioning

2. Technavio Analysis

2.1 Analysis of price sensitivity, lifecycle, customer purchase basket, adoption rates, and purchase criteria

2.2 Criticality of inputs and Factors of differentiation

Chart on Overview on criticality of inputs and factors of differentiation

2.3 Factors of disruption

Chart on Overview on factors of disruption

2.4 Impact of drivers and challenges

Chart on Impact of drivers and challenges in 2025 and 2030

3. Market Landscape

3.1 Market ecosystem

Chart on Parent Market
Data Table on - Parent Market

3.2 Market characteristics

Chart on Market characteristics analysis

3.3 Value chain analysis

Chart on Value chain analysis

4. Market Sizing

4.1 Market definition

Data Table on Offerings of companies included in the market definition

4.2 Market segment analysis

Market segments

4.3 Market size 2025

4.4 Market outlook: Forecast for 2025-2030

Chart on Global - Market size and forecast 2025-2030 ($ million)
Data Table on Global - Market size and forecast 2025-2030 ($ million)
Chart on Global Market: Year-over-year growth 2025-2030 (%)
Data Table on Global Market: Year-over-year growth 2025-2030 (%)

5. Historic Market Size

5.1 Global Playing Cards Market 2020 - 2024

Historic Market Size - Data Table on Global Playing Cards Market 2020 - 2024 ($ million)

5.2 Material segment analysis 2020 - 2024

Historic Market Size - Material Segment 2020 - 2024 ($ million)

5.3 Application segment analysis 2020 - 2024

Historic Market Size - Application Segment 2020 - 2024 ($ million)

5.4 Distribution Channel segment analysis 2020 - 2024

Historic Market Size - Distribution Channel Segment 2020 - 2024 ($ million)

5.5 Geography segment analysis 2020 - 2024

Historic Market Size - Geography Segment 2020 - 2024 ($ million)

5.6 Country segment analysis 2020 - 2024

Historic Market Size - Country Segment 2020 - 2024 ($ million)

6. Qualitative Analysis

6.1 Impact of AI on Global Playing Cards Market

6.2 Impact of geopolitical conflicts on Global Playing Cards Market

7. Five Forces Analysis

7.1 Five forces summary

Five forces analysis - Comparison between 2025 and 2030

7.2 Bargaining power of buyers

Bargaining power of buyers - Impact of key factors 2025 and 2030

7.3 Bargaining power of suppliers

Bargaining power of suppliers - Impact of key factors in 2025 and 2030

7.4 Threat of new entrants

Threat of new entrants - Impact of key factors in 2025 and 2030

7.5 Threat of substitutes

Threat of substitutes - Impact of key factors in 2025 and 2030

7.6 Threat of rivalry

Threat of rivalry - Impact of key factors in 2025 and 2030

7.7 Market condition

Chart on Market condition - Five forces 2025 and 2030

8. Market Segmentation by Material

8.1 Market segments

Chart on Material - Market share 2025-2030 (%)
Data Table on Material - Market share 2025-2030 (%)

8.2 Comparison by Material

Chart on Comparison by Material
Data Table on Comparison by Material

8.3 Paper - Market size and forecast 2025-2030

Chart on Paper - Market size and forecast 2025-2030 ($ million)
Data Table on Paper - Market size and forecast 2025-2030 ($ million)
Chart on Paper - Year-over-year growth 2025-2030 (%)
Data Table on Paper - Year-over-year growth 2025-2030 (%)

8.4 Plastic - Market size and forecast 2025-2030

Chart on Plastic - Market size and forecast 2025-2030 ($ million)
Data Table on Plastic - Market size and forecast 2025-2030 ($ million)
Chart on Plastic - Year-over-year growth 2025-2030 (%)
Data Table on Plastic - Year-over-year growth 2025-2030 (%)

8.5 Others - Market size and forecast 2025-2030

Chart on Others - Market size and forecast 2025-2030 ($ million)
Data Table on Others - Market size and forecast 2025-2030 ($ million)
Chart on Others - Year-over-year growth 2025-2030 (%)
Data Table on Others - Year-over-year growth 2025-2030 (%)

8.6 Market opportunity by Material

Market opportunity by Material ($ million)
Data Table on Market opportunity by Material ($ million)

9. Market Segmentation by Application

9.1 Market segments

Chart on Application - Market share 2025-2030 (%)
Data Table on Application - Market share 2025-2030 (%)

9.2 Comparison by Application

Chart on Comparison by Application
Data Table on Comparison by Application

9.3 Home entertainment - Market size and forecast 2025-2030

Chart on Home entertainment - Market size and forecast 2025-2030 ($ million)
Data Table on Home entertainment - Market size and forecast 2025-2030 ($ million)
Chart on Home entertainment - Year-over-year growth 2025-2030 (%)
Data Table on Home entertainment - Year-over-year growth 2025-2030 (%)

9.4 Casino and gambling - Market size and forecast 2025-2030

Chart on Casino and gambling - Market size and forecast 2025-2030 ($ million)
Data Table on Casino and gambling - Market size and forecast 2025-2030 ($ million)
Chart on Casino and gambling - Year-over-year growth 2025-2030 (%)
Data Table on Casino and gambling - Year-over-year growth 2025-2030 (%)

9.5 Tournament gaming - Market size and forecast 2025-2030

Chart on Tournament gaming - Market size and forecast 2025-2030 ($ million)
Data Table on Tournament gaming - Market size and forecast 2025-2030 ($ million)
Chart on Tournament gaming - Year-over-year growth 2025-2030 (%)
Data Table on Tournament gaming - Year-over-year growth 2025-2030 (%)

9.6 Others - Market size and forecast 2025-2030

Chart on Others - Market size and forecast 2025-2030 ($ million)
Data Table on Others - Market size and forecast 2025-2030 ($ million)
Chart on Others - Year-over-year growth 2025-2030 (%)
Data Table on Others - Year-over-year growth 2025-2030 (%)

9.7 Market opportunity by Application

Market opportunity by Application ($ million)
Data Table on Market opportunity by Application ($ million)

10. Market Segmentation by Distribution Channel

10.1 Market segments

Chart on Distribution Channel - Market share 2025-2030 (%)
Data Table on Distribution Channel - Market share 2025-2030 (%)

10.2 Comparison by Distribution Channel

Chart on Comparison by Distribution Channel
Data Table on Comparison by Distribution Channel

10.3 Offline - Market size and forecast 2025-2030

Chart on Offline - Market size and forecast 2025-2030 ($ million)
Data Table on Offline - Market size and forecast 2025-2030 ($ million)
Chart on Offline - Year-over-year growth 2025-2030 (%)
Data Table on Offline - Year-over-year growth 2025-2030 (%)

10.4 Online - Market size and forecast 2025-2030

Chart on Online - Market size and forecast 2025-2030 ($ million)
Data Table on Online - Market size and forecast 2025-2030 ($ million)
Chart on Online - Year-over-year growth 2025-2030 (%)
Data Table on Online - Year-over-year growth 2025-2030 (%)

10.5 Market opportunity by Distribution Channel

Market opportunity by Distribution Channel ($ million)
Data Table on Market opportunity by Distribution Channel ($ million)

11. Customer Landscape

11.1 Customer landscape overview

Analysis of price sensitivity, lifecycle, customer purchase basket, adoption rates, and purchase criteria

12. Geographic Landscape

12.1 Geographic segmentation

Chart on Market share by geography 2025-2030 (%)
Data Table on Market share by geography 2025-2030 (%)

12.2 Geographic comparison

Chart on Geographic comparison
Data Table on Geographic comparison

12.3 APAC - Market size and forecast 2025-2030

Chart on APAC - Market size and forecast 2025-2030 ($ million)
Data Table on APAC - Market size and forecast 2025-2030 ($ million)
Chart on APAC - Year-over-year growth 2025-2030 (%)
Data Table on APAC - Year-over-year growth 2025-2030 (%)
Chart on Regional Comparison - APAC
Data Table on Regional Comparison - APAC

12.3.1 China - Market size and forecast 2025-2030

Chart on China - Market size and forecast 2025-2030 ($ million)
Data Table on China - Market size and forecast 2025-2030 ($ million)
Chart on China - Year-over-year growth 2025-2030 (%)
Data Table on China - Year-over-year growth 2025-2030 (%)

12.3.2 India - Market size and forecast 2025-2030

Chart on India - Market size and forecast 2025-2030 ($ million)
Data Table on India - Market size and forecast 2025-2030 ($ million)
Chart on India - Year-over-year growth 2025-2030 (%)
Data Table on India - Year-over-year growth 2025-2030 (%)

12.3.3 Japan - Market size and forecast 2025-2030

Chart on Japan - Market size and forecast 2025-2030 ($ million)
Data Table on Japan - Market size and forecast 2025-2030 ($ million)
Chart on Japan - Year-over-year growth 2025-2030 (%)
Data Table on Japan - Year-over-year growth 2025-2030 (%)

12.3.4 South Korea - Market size and forecast 2025-2030

Chart on South Korea - Market size and forecast 2025-2030 ($ million)
Data Table on South Korea - Market size and forecast 2025-2030 ($ million)
Chart on South Korea - Year-over-year growth 2025-2030 (%)
Data Table on South Korea - Year-over-year growth 2025-2030 (%)

12.3.5 Australia - Market size and forecast 2025-2030

Chart on Australia - Market size and forecast 2025-2030 ($ million)
Data Table on Australia - Market size and forecast 2025-2030 ($ million)
Chart on Australia - Year-over-year growth 2025-2030 (%)
Data Table on Australia - Year-over-year growth 2025-2030 (%)

12.3.6 Indonesia - Market size and forecast 2025-2030

Chart on Indonesia - Market size and forecast 2025-2030 ($ million)
Data Table on Indonesia - Market size and forecast 2025-2030 ($ million)
Chart on Indonesia - Year-over-year growth 2025-2030 (%)
Data Table on Indonesia - Year-over-year growth 2025-2030 (%)

12.4 North America - Market size and forecast 2025-2030

Chart on North America - Market size and forecast 2025-2030 ($ million)
Data Table on North America - Market size and forecast 2025-2030 ($ million)
Chart on North America - Year-over-year growth 2025-2030 (%)
Data Table on North America - Year-over-year growth 2025-2030 (%)
Chart on Regional Comparison - North America
Data Table on Regional Comparison - North America

12.4.1 US - Market size and forecast 2025-2030

Chart on US - Market size and forecast 2025-2030 ($ million)
Data Table on US - Market size and forecast 2025-2030 ($ million)
Chart on US - Year-over-year growth 2025-2030 (%)
Data Table on US - Year-over-year growth 2025-2030 (%)

12.4.2 Canada - Market size and forecast 2025-2030

Chart on Canada - Market size and forecast 2025-2030 ($ million)
Data Table on Canada - Market size and forecast 2025-2030 ($ million)
Chart on Canada - Year-over-year growth 2025-2030 (%)
Data Table on Canada - Year-over-year growth 2025-2030 (%)

12.4.3 Mexico - Market size and forecast 2025-2030

Chart on Mexico - Market size and forecast 2025-2030 ($ million)
Data Table on Mexico - Market size and forecast 2025-2030 ($ million)
Chart on Mexico - Year-over-year growth 2025-2030 (%)
Data Table on Mexico - Year-over-year growth 2025-2030 (%)

12.5 Europe - Market size and forecast 2025-2030

Chart on Europe - Market size and forecast 2025-2030 ($ million)
Data Table on Europe - Market size and forecast 2025-2030 ($ million)
Chart on Europe - Year-over-year growth 2025-2030 (%)
Data Table on Europe - Year-over-year growth 2025-2030 (%)
Chart on Regional Comparison - Europe
Data Table on Regional Comparison - Europe

12.5.1 Germany - Market size and forecast 2025-2030

Chart on Germany - Market size and forecast 2025-2030 ($ million)
Data Table on Germany - Market size and forecast 2025-2030 ($ million)
Chart on Germany - Year-over-year growth 2025-2030 (%)
Data Table on Germany - Year-over-year growth 2025-2030 (%)

12.5.2 UK - Market size and forecast 2025-2030

Chart on UK - Market size and forecast 2025-2030 ($ million)
Data Table on UK - Market size and forecast 2025-2030 ($ million)
Chart on UK - Year-over-year growth 2025-2030 (%)
Data Table on UK - Year-over-year growth 2025-2030 (%)

12.5.3 France - Market size and forecast 2025-2030

Chart on France - Market size and forecast 2025-2030 ($ million)
Data Table on France - Market size and forecast 2025-2030 ($ million)
Chart on France - Year-over-year growth 2025-2030 (%)
Data Table on France - Year-over-year growth 2025-2030 (%)

12.5.4 Russia - Market size and forecast 2025-2030

Chart on Russia - Market size and forecast 2025-2030 ($ million)
Data Table on Russia - Market size and forecast 2025-2030 ($ million)
Chart on Russia - Year-over-year growth 2025-2030 (%)
Data Table on Russia - Year-over-year growth 2025-2030 (%)

12.5.5 Italy - Market size and forecast 2025-2030

Chart on Italy - Market size and forecast 2025-2030 ($ million)
Data Table on Italy - Market size and forecast 2025-2030 ($ million)
Chart on Italy - Year-over-year growth 2025-2030 (%)
Data Table on Italy - Year-over-year growth 2025-2030 (%)

12.5.6 Spain - Market size and forecast 2025-2030

Chart on Spain - Market size and forecast 2025-2030 ($ million)
Data Table on Spain - Market size and forecast 2025-2030 ($ million)
Chart on Spain - Year-over-year growth 2025-2030 (%)
Data Table on Spain - Year-over-year growth 2025-2030 (%)

12.6 South America - Market size and forecast 2025-2030

Chart on South America - Market size and forecast 2025-2030 ($ million)
Data Table on South America - Market size and forecast 2025-2030 ($ million)
Chart on South America - Year-over-year growth 2025-2030 (%)
Data Table on South America - Year-over-year growth 2025-2030 (%)
Chart on Regional Comparison - South America
Data Table on Regional Comparison - South America

12.6.1 Brazil - Market size and forecast 2025-2030

Chart on Brazil - Market size and forecast 2025-2030 ($ million)
Data Table on Brazil - Market size and forecast 2025-2030 ($ million)
Chart on Brazil - Year-over-year growth 2025-2030 (%)
Data Table on Brazil - Year-over-year growth 2025-2030 (%)

12.6.2 Argentina - Market size and forecast 2025-2030

Chart on Argentina - Market size and forecast 2025-2030 ($ million)
Data Table on Argentina - Market size and forecast 2025-2030 ($ million)
Chart on Argentina - Year-over-year growth 2025-2030 (%)
Data Table on Argentina - Year-over-year growth 2025-2030 (%)

12.6.3 Colombia - Market size and forecast 2025-2030

Chart on Colombia - Market size and forecast 2025-2030 ($ million)
Data Table on Colombia - Market size and forecast 2025-2030 ($ million)
Chart on Colombia - Year-over-year growth 2025-2030 (%)
Data Table on Colombia - Year-over-year growth 2025-2030 (%)

12.7 Middle East and Africa - Market size and forecast 2025-2030

Chart on Middle East and Africa - Market size and forecast 2025-2030 ($ million)
Data Table on Middle East and Africa - Market size and forecast 2025-2030 ($ million)
Chart on Middle East and Africa - Year-over-year growth 2025-2030 (%)
Data Table on Middle East and Africa - Year-over-year growth 2025-2030 (%)
Chart on Regional Comparison - Middle East and Africa
Data Table on Regional Comparison - Middle East and Africa

12.7.1 South Africa - Market size and forecast 2025-2030

Chart on South Africa - Market size and forecast 2025-2030 ($ million)
Data Table on South Africa - Market size and forecast 2025-2030 ($ million)
Chart on South Africa - Year-over-year growth 2025-2030 (%)
Data Table on South Africa - Year-over-year growth 2025-2030 (%)

12.7.2 Saudi Arabia - Market size and forecast 2025-2030

Chart on Saudi Arabia - Market size and forecast 2025-2030 ($ million)
Data Table on Saudi Arabia - Market size and forecast 2025-2030 ($ million)
Chart on Saudi Arabia - Year-over-year growth 2025-2030 (%)
Data Table on Saudi Arabia - Year-over-year growth 2025-2030 (%)

12.7.3 UAE - Market size and forecast 2025-2030

Chart on UAE - Market size and forecast 2025-2030 ($ million)
Data Table on UAE - Market size and forecast 2025-2030 ($ million)
Chart on UAE - Year-over-year growth 2025-2030 (%)
Data Table on UAE - Year-over-year growth 2025-2030 (%)

12.7.4 Turkey - Market size and forecast 2025-2030

Chart on Turkey - Market size and forecast 2025-2030 ($ million)
Data Table on Turkey - Market size and forecast 2025-2030 ($ million)
Chart on Turkey - Year-over-year growth 2025-2030 (%)
Data Table on Turkey - Year-over-year growth 2025-2030 (%)

12.7.5 Egypt - Market size and forecast 2025-2030

Chart on Egypt - Market size and forecast 2025-2030 ($ million)
Data Table on Egypt - Market size and forecast 2025-2030 ($ million)
Chart on Egypt - Year-over-year growth 2025-2030 (%)
Data Table on Egypt - Year-over-year growth 2025-2030 (%)

12.8 Market opportunity by geography

Market opportunity by geography ($ million)
Data Tables on Market opportunity by geography ($ million)

13. Drivers, Challenges, and Opportunity

13.1 Market drivers

Resurgence of social gaming and tabletop culture
Expansion of professional gaming and casino operations in emerging markets
Material innovation and shift toward sustainable manufacturing

13.2 Market challenges

Competition from digital entertainment platforms and virtual leisure alternatives
Supply chain volatility and rising cost of specialized raw materials
Intellectual property infringement and proliferation of counterfeit goods

13.3 Impact of drivers and challenges

Impact of drivers and challenges in 2025 and 2030

13.4 Market opportunities

Proliferation of artisanal design and collector-centric limited editions
Emergence of hybrid gaming and digital-physical integration
Shift toward sustainable materials and circular production models

14. Competitive Landscape

14.1 Overview

14.2

Overview on criticality of inputs and factors of differentiation

14.3 Landscape disruption

Overview on factors of disruption

14.4 Industry risks

Impact of key risks on business

15. Competitive Analysis

15.1 Companies profiled

Companies covered

15.2 Company ranking index

15.3 Market positioning of companies

Matrix on companies position and classification

15.4 Angel Playing Cards Co.Ltd.

Angel Playing Cards Co.Ltd. - Overview
Angel Playing Cards Co.Ltd. - Product / Service
Angel Playing Cards Co.Ltd. - Key offerings
SWOT

15.5 Art of Play

Art of Play - Overview
Art of Play - Product / Service
Art of Play - Key offerings
SWOT

15.6 Cartamundi Group

Cartamundi Group - Overview
Cartamundi Group - Product / Service
Cartamundi Group - Key offerings
SWOT

15.7 Copag USA

Copag USA - Overview
Copag USA - Product / Service
Copag USA - Key offerings
SWOT

15.8 Ellusionist

Ellusionist - Overview
Ellusionist - Product / Service
Ellusionist - Key offerings
SWOT

15.9 Kuo Kau Paper Products Co.Ltd.

Kuo Kau Paper Products Co.Ltd. - Overview
Kuo Kau Paper Products Co.Ltd. - Product / Service
Kuo Kau Paper Products Co.Ltd. - Key offerings
SWOT

15.10 Modiano S.p.A.

Modiano S.p.A. - Overview
Modiano S.p.A. - Product / Service
Modiano S.p.A. - Key offerings
SWOT

15.11 Naipes Heraclio Fournier, S.A.

Naipes Heraclio Fournier, S.A. - Overview
Naipes Heraclio Fournier, S.A. - Product / Service
Naipes Heraclio Fournier, S.A. - Key offerings
SWOT

15.12 QP Group Holdings Ltd.

QP Group Holdings Ltd. - Overview
QP Group Holdings Ltd. - Product / Service
QP Group Holdings Ltd. - Key offerings
SWOT

15.13 Riffle Shuffle Playing Card Co.

Riffle Shuffle Playing Card Co. - Overview
Riffle Shuffle Playing Card Co. - Product / Service
Riffle Shuffle Playing Card Co. - Key offerings
SWOT

15.14 Shenzhen Wangjing Printing Co.

Shenzhen Wangjing Printing Co. - Overview
Shenzhen Wangjing Printing Co. - Product / Service
Shenzhen Wangjing Printing Co. - Key offerings
SWOT

15.15 Shuffled Ink

Shuffled Ink - Overview
Shuffled Ink - Product / Service
Shuffled Ink - Key offerings
SWOT

15.16 Teodoro Dal Negro S.p.A.

Teodoro Dal Negro S.p.A. - Overview
Teodoro Dal Negro S.p.A. - Product / Service
Teodoro Dal Negro S.p.A. - Key offerings
SWOT

15.17 Theory11.

Theory11. - Overview
Theory11. - Product / Service
Theory11. - Key offerings
SWOT

15.18 Wiener Spielkartenfabrik Ferd.

Wiener Spielkartenfabrik Ferd. - Overview
Wiener Spielkartenfabrik Ferd. - Product / Service
Wiener Spielkartenfabrik Ferd. - Key offerings
SWOT

16. Appendix

16.1 Scope of the report

Market definition
Objectives
Notes and caveats

16.2 Inclusions and exclusions checklist

Inclusions checklist
Exclusions checklist

16.3 Currency conversion rates for US$

16.4 Research methodology

16.5 Data procurement

Information sources

16.6 Data validation

16.7 Validation techniques employed for market sizing

16.8 Data synthesis

16.9 360 degree market analysis

16.10 List of abbreviations

Research Methodology

Technavio presents a detailed picture of the market by way of study, synthesis, and summation of data from multiple sources. The analysts have presented the various facets of the market with a particular focus on identifying the key industry influencers. The data thus presented is comprehensive, reliable, and the result of extensive research, both primary and secondary.

INFORMATION SOURCES

Primary sources

  • Manufacturers and suppliers
  • Channel partners
  • Industry experts
  • Strategic decision makers

Secondary sources

  • Industry journals and periodicals
  • Government data
  • Financial reports of key industry players
  • Historical data
  • Press releases

DATA ANALYSIS

Data Synthesis

  • Collation of data
  • Estimation of key figures
  • Analysis of derived insights

Data Validation

  • Triangulation with data models
  • Reference against proprietary databases
  • Corroboration with industry experts

REPORT WRITING

Qualitative

  • Market drivers
  • Market challenges
  • Market trends
  • Five forces analysis

Quantitative

  • Market size and forecast
  • Market segmentation
  • Geographical insights
  • Competitive landscape

Interested in this report?

Get your sample now to see our research methodology and insights!

Download Now

Frequently Asked Questions

Playing Cards market growth will increase by USD 804.7 million during 2026-2030.

The Playing Cards market is expected to grow at a CAGR of 4.7% during 2026-2030.

Playing Cards market is segmented by Material (Paper, Plastic, Others) Application (Home entertainment, Casino and gambling, Tournament gaming, Others) Distribution channel (Offline, Online)

Angel Playing Cards Co.Ltd., Art of Play, Cartamundi Group, Copag USA, Ellusionist, Expert Playing Card Co., Kings Wild Project Inc, Kuo Kau Paper Products Co.Ltd., Legends Playing Card Co., Modiano S.p.A., Naipes Heraclio Fournier, S.A., Nintendo Co. Ltd., QP Group Holdings Ltd., Riffle Shuffle Playing Card Co., Shanghai Three-A Playing Cards Co.Ltd., Shenzhen Wangjing Printing Co., Shuffled Ink, Teodoro Dal Negro S.p.A., Theory11., Wiener Spielkartenfabrik Ferd. are a few of the key vendors in the Playing Cards market.

APAC will register the highest growth rate of 40.4% among the other regions. Therefore, the Playing Cards market in APAC is expected to garner significant business opportunities for the vendors during the forecast period.

China, India, Japan, South Korea, Australia, Indonesia, US, Canada, Mexico, Germany, UK, France, Russia, Italy, Spain, Brazil, Argentina, Colombia, South Africa, Saudi Arabia, UAE, Turkey, Egypt

  • Resurgence of social gaming and tabletop culture is the driving factor this market.

The Playing Cards market vendors should focus on grabbing business opportunities from the Material segment as it accounted for the largest market share in the base year.
RIA - Research AI Assistant
Ask RIA