Personalized Digital Health Platforms Market Analysis, Size, and Forecast 2026-2030: North America (US, Canada, and Mexico), Europe (UK, Germany, and France), Asia (China, India, and Japan), South America (Brazil), Middle East and Africa (UAE, Saudi Arabia, and South Africa), Rest of World (ROW)

Personalized Digital Health Platforms Market Analysis, Size, and Forecast 2026-2030:
North America (US, Canada, and Mexico), Europe (UK, Germany, and France), Asia (China, India, and Japan), South America (Brazil), Middle East and Africa (UAE, Saudi Arabia, and South Africa), Rest of World (ROW)

Published: May 2026 303 Pages SKU: IRTNTR81369

Market Overview at a Glance

$93.14 B
Market Opportunity
22.1%
CAGR 2025 - 2030
35.5%
North America Growth
$20.92 B
Software segment 2024

Personalized Digital Health Platforms Market Size and Growth Forecast 2026-2030

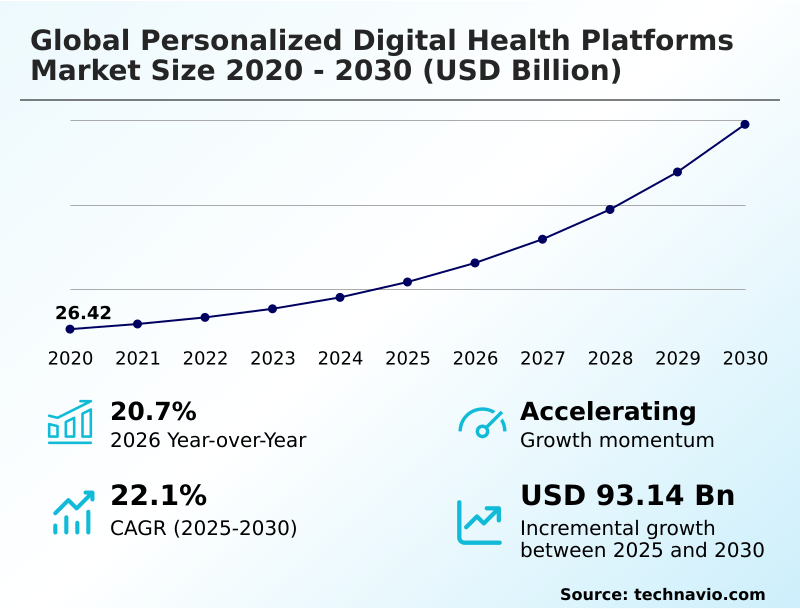
The Personalized Digital Health Platforms Market size was valued at USD 54.27 billion in 2025 growing at a CAGR of 22.1% during the forecast period 2026-2030.

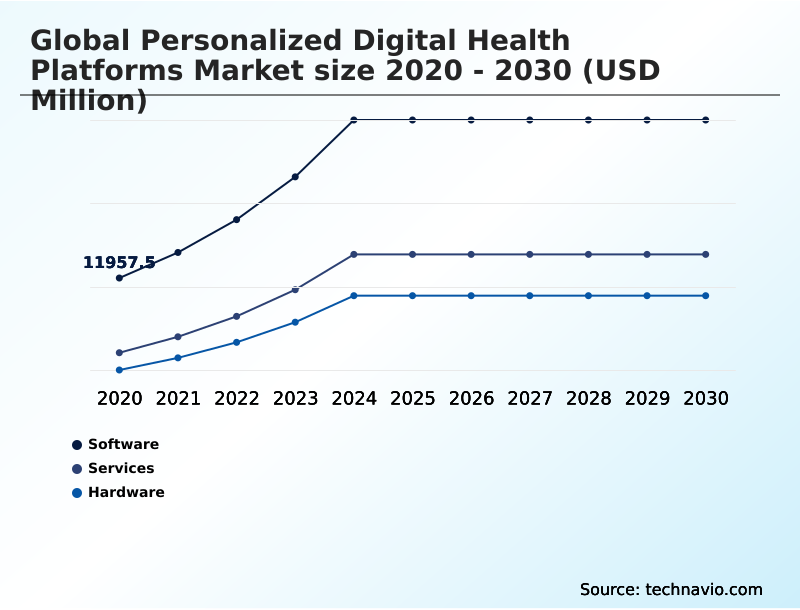
North America accounts for 35.5% of incremental growth during the forecast period. The Software segment by Component was valued at USD 20.92 billion in 2024, while the Healthcare providers segment holds the largest revenue share by End-user.

The market is projected to grow by USD 121.00 billion from 2020 to 2030, with USD 93.14 billion of the growth expected during the forecast period of 2025 to 2030.

Get Key Insights on Market Forecast (PDF) Request Free Sample

Personalized Digital Health Platforms Market Overview

The personalized digital health platforms market is defined by the convergence of data analytics and patient-centric care models, with North America contributing over 35% of incremental growth. The operational core involves wearable sensor technology capturing real-time physiological monitoring data, which is then processed through AI-driven health insights to support proactive health interventions. This ecosystem relies on robust IoMT device connectivity and seamless electronic health records integration to create comprehensive individual health profiles. For instance, a cardiology clinic managing post-operative patients uses a platform for remote patient monitoring, tracking heart rate variability and medication adherence solutions through a patient's mobile health application. This digital therapeutics approach allows for early detection of anomalies, reducing readmission rates by identifying risks before they become critical events. The shift toward value-based care models further propels adoption, as providers are increasingly compensated based on measurable outcomes achieved through such data-driven wellness programs and chronic disease management apps.

Drivers, Trends, and Challenges in the Personalized Digital Health Platforms Market

Strategic decision-making in the personalized digital health platforms market is increasingly influenced by the need to navigate complex regulatory and technical landscapes. The integration of AI for predictive health analytics allows providers to shift from reactive to preventive care, a transition heavily dependent on robust data security in personalized health.

For example, a multi-state hospital system implementing IoMT for remote patient monitoring must ensure its entire data pipeline, from sensor to cloud, is fully compliant with HIPAA to avoid severe penalties. The adoption of blockchain for secure health records is gaining consideration as a method to address patient data interoperability challenges and build trust in digital health platforms.

Meanwhile, telehealth for rural healthcare access and the use of virtual reality for physical rehabilitation are expanding the market's reach. The market in Asia is growing at a faster rate, approximately 2.7 percentage points higher than in North America, which has significant implications for global supply chain and localization strategies.

Vendors are also exploring how biometric data for insurance underwriting could create new revenue streams while managing chronic conditions like diabetes through continuous monitoring. The use of gamification in patient engagement strategies is proving effective in improving adherence, while AI-powered diagnostics in personalized healthcare are enhancing clinical accuracy.

Finally, the impact of real-world evidence on drug development is linking digital health platforms to the pharmaceutical lifecycle.

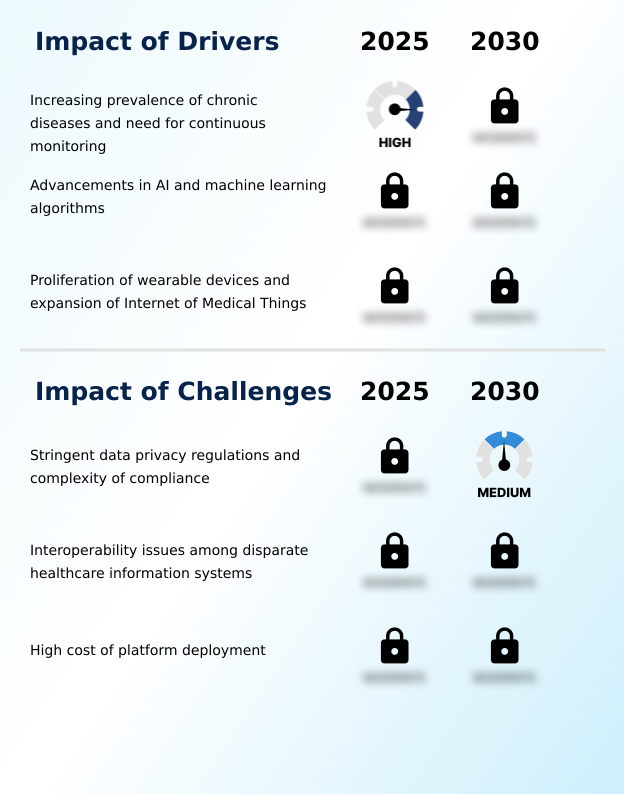
Primary Growth Driver: The increasing prevalence of chronic diseases and the corresponding need for continuous patient monitoring are key drivers of market growth.

Market expansion is fueled by the escalating prevalence of chronic conditions, creating immense demand for continuous monitoring for diabetes management and cardiovascular health tracking. This clinical need is met by rapid advancements in technology.

The proliferation of wearable technology for chronic care and IoMT for remote patient monitoring provides the necessary data streams. Simultaneously, progress in AI and machine learning allows platforms to process this data, offering predictive analytics and personalized recommendations.

These technologies enable a shift toward proactive care, with Asia emerging as the fastest-growing regional market, registering a growth rate of over 23%.

This technological synergy allows for the delivery of scalable and cost-effective personalized healthcare solutions, addressing systemic challenges in healthcare delivery worldwide.

Emerging Market Trend: A significant market trend is the integration of genomic data with advanced biomarker analytics. This shift enables hyper-personalized care pathways based on an individual's unique genetic makeup.

The market is advancing beyond simple activity tracking toward hyper-personalization, driven by three core trends. First, the integration of genomic data with real-time biomarker tracking is enabling highly specific care plans. Platforms are incorporating AI for predictive health analytics to offer customized fitness regimens and personalized nutrition based on genetics.

Second, to address low long-term adherence, vendors are deploying gamification in patient engagement strategies, using principles of behavioral psychology to drive sustainable habit formation. This is critical for applications in digital platforms for mental health support.

Finally, to tackle security concerns, blockchain for secure health records is being explored to enhance data integrity and give users control over their information, which is vital for building trust in digital health platforms and ensuring compliance with regulations like GDPR.

Key Industry Challenge: Stringent data privacy regulations, such as GDPR and HIPAA, and the complexities of ensuring global compliance present a key challenge affecting industry growth.

The market's growth is constrained by significant structural and regulatory hurdles. The foremost challenge involves stringent data privacy regulations, such as HIPAA and GDPR, which impose complex compliance burdens and increase operational costs for secure health data storage and data security in personalized health.

A second major barrier is the lack of patient data interoperability challenges among disparate systems, which silos information and prevents the creation of a unified patient view essential for effective personalized care. This fragments the digital health ecosystem. Finally, high deployment costs and cultural resistance to technology within some healthcare settings hinder widespread adoption of patient-centric care models.

Overcoming these obstacles requires standardized protocols for data exchange, more affordable platform solutions, and demonstrating clear clinical and financial value to all stakeholders.

Explore Full Market Dynamics Analysis Request Free Sample

Personalized Digital Health Platforms Market Segmentation

The personalized digital health platforms industry research report provides comprehensive data including region-wise segment analysis, with forecasts and analysis for the period 2026-2030, as well as historical data from 2020-2024 for the following segments.

Market Segment by Component
  • Software
  • Services
  • Hardware
Market Segment by End-user
  • Healthcare providers
  • Patients and consumers
  • Pharma and biotech companies
  • Healthcare payers
Market Segment by Application
  • Monitoring and follow‑up
  • Preventive care and wellness
  • Diagnosis and treatment support
  • Rehabilitation and recovery
Market Segment by Geography
North America
US, Canada, Mexico
Europe
UK, Germany, France, Italy, The Netherlands, Spain
Asia
China, India, Japan, South Korea, Indonesia, Thailand, Singapore
Rest of World (ROW)

Component Segment Analysis

The software segment is estimated to witness significant growth during the forecast period.

The software segment is the foundational architecture of the personalized digital health platforms market. This category includes AI-driven health insights, clinical decision support algorithms, and patient engagement platforms that process vast arrays of medical data.

These solutions, often deployed on HIPAA compliant cloud infrastructure, enable the aggregation of biometric data analytics from disparate sources, including electronic health records integration.

Accounting for nearly 47% of the market, software innovation is the primary catalyst for expanding capabilities in personalized care.

As health systems transition toward value-based care models, demand for interoperable software that facilitates secure data exchange and delivers proactive health interventions continues to accelerate, defining the competitive landscape for vendors.

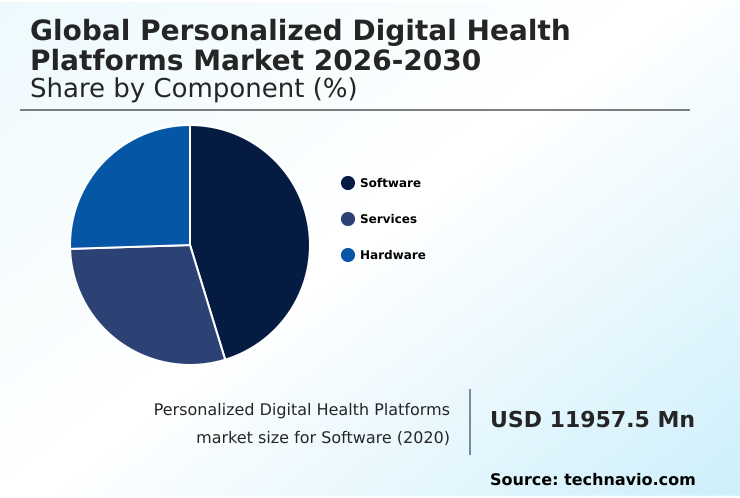
The Software segment was valued at USD 20.92 billion in 2024 and showed a gradual increase during the forecast period.

Personalized Digital Health Platforms Market by Region: North America Leads with 35.5% Growth Share

North America is estimated to contribute 35.5% to the growth of the global market during the forecast period.

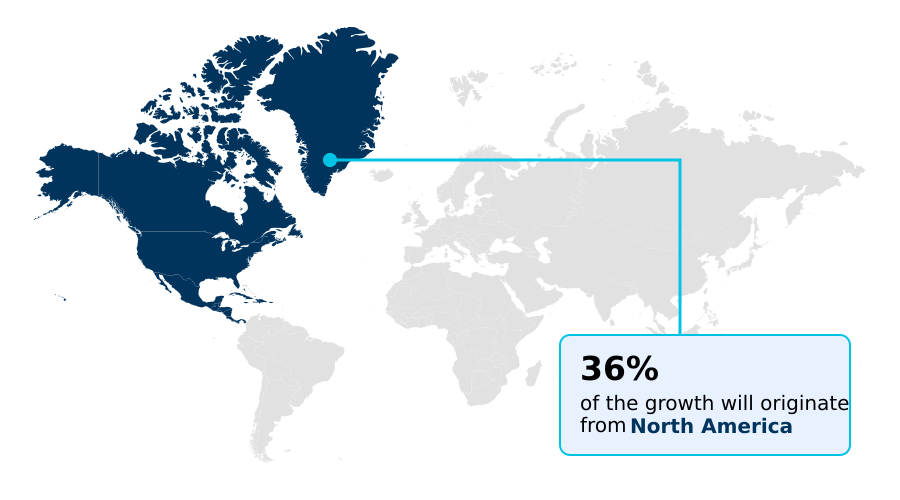
The geographic landscape is characterized by varied adoption rates, with North America representing the largest market, contributing over 35% of the global opportunity.

This dominance is driven by high investment in health technology and a mature regulatory environment that supports clinical workflow automation.

Asia is projected to be the fastest-growing region, where the demand for remote diagnostics and proactive disease prevention is surging due to a massive and increasingly health-conscious population.

In Europe, which accounts for over 26% of the market, the focus is on integrating digital platforms into national health systems under strict GDPR compliance for patient data interoperability challenges.

A key factor across all regions is the push for evidence-based digital care and consumer health technology to manage population health more efficiently.

Customer Landscape Analysis for the Personalized Digital Health Platforms Market

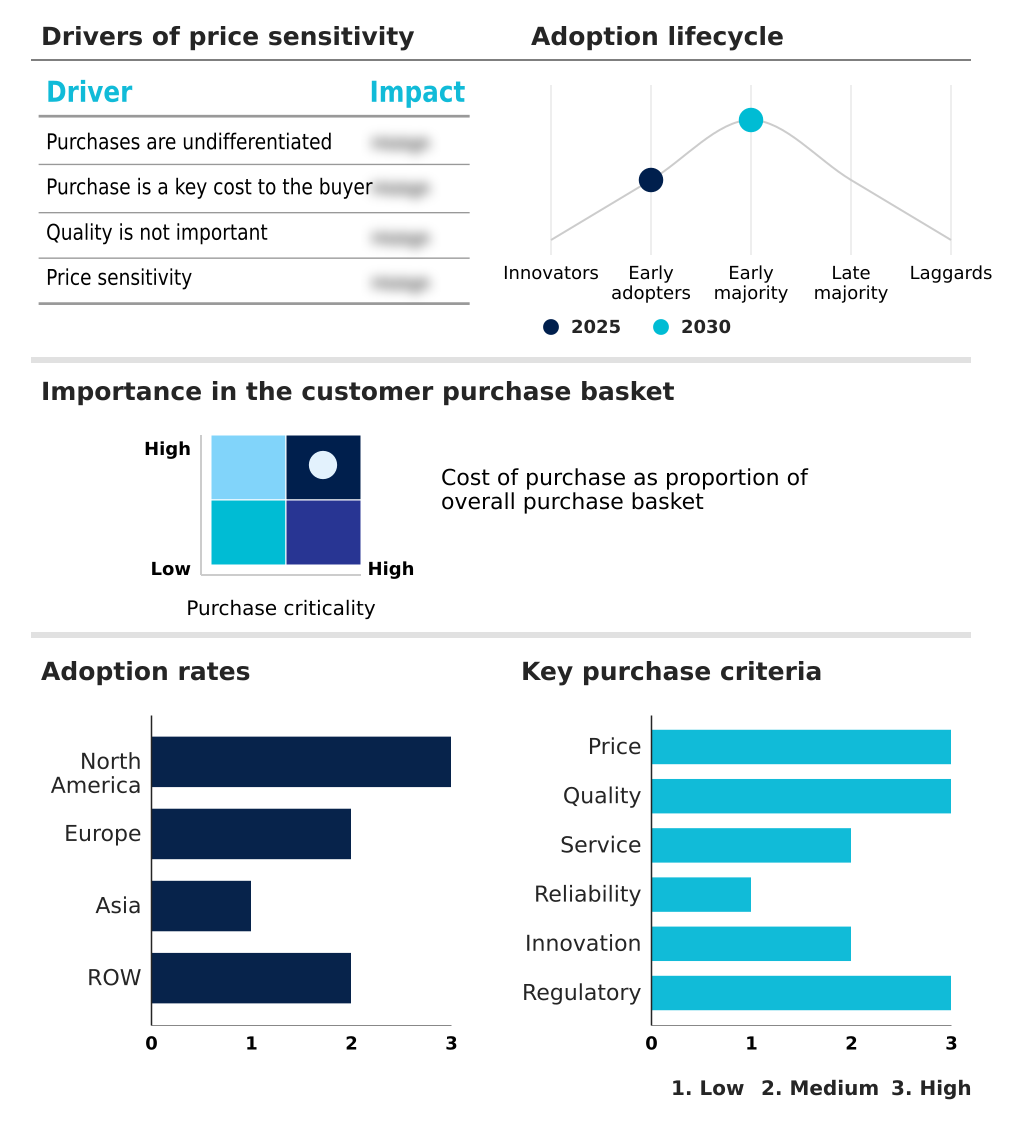
The personalized digital health platforms market forecasting report includes the adoption lifecycle of the market, covering from the innovator’s stage to the laggard’s stage. It focuses on adoption rates in different regions based on penetration. Furthermore, the personalized digital health platforms market report also includes key purchase criteria and drivers of price sensitivity to help companies evaluate and develop their market growth analysis strategies.

Competitive Landscape of the Personalized Digital Health Platforms Market

Companies are implementing various strategies, such as strategic alliances, partnerships, mergers and acquisitions, geographical expansion, and product/service launches, to enhance their presence in the personalized digital health platforms market industry.

American Well Corp. - Delivers comprehensive telehealth platforms integrating virtual primary care, urgent care, and behavioral health services to enhance personalized patient access and treatment.

The industry research and growth report includes detailed analyses of the competitive landscape of the market and information about key companies, including:

  • American Well Corp.
  • Apple Inc.
  • CalmSpace
  • Dexcom Inc.
  • Fitbit LLC
  • Garmin Ltd.
  • Google LLC
  • Myfitnesspal
  • Noom Inc.
  • Omada Health Inc.
  • Oura Health Oy
  • Parsley Health
  • Personify Health Inc.
  • Segterra Inc.
  • Spring Health Inc.
  • Teladoc Health Inc.
  • Thorne HealthTech Inc.
  • Viome Life Sciences, Inc.
  • Wild Health
  • ZOE Limited

Qualitative and quantitative analysis of companies has been conducted to help clients understand the wider business environment as well as the strengths and weaknesses of key industry players. Data is qualitatively analyzed to categorize companies as pure play, category-focused, industry-focused, and diversified; it is quantitatively analyzed to categorize companies as dominant, leading, strong, tentative, and weak.

Recent Developments in the Personalized Digital Health Platforms Market

  • In June, 2025, Hims and Hers Health announced an agreement to acquire the UK-based digital health platform Zava Global GmbH as part of its international expansion strategy.
  • In October, 2025, Midi Health announced the raising of $50 million in funding, aimed at accelerating its mission to transform women's healthcare through its AI-enabled, personalized care platform.
  • In January, 2026, Spring Health announced its plan to acquire Alma, a move reflecting the accelerating shift toward AI-driven, data-integrated mental healthcare delivery systems.
  • In March, 2026, Amazon introduced a new Health AI agent integrated into its website and mobile application, providing users with AI-driven health assistance and round-the-clock access to virtual care.

Research Analyst Overview: Personalized Digital Health Platforms Market

The personalized digital health platforms market's evolution is driven by the operational need for data-driven wellness programs that can function at a population scale. Boardroom decisions on capital allocation are increasingly tied to a platform's ability to facilitate decentralized clinical trials and demonstrate a clear return on investment through improved outcomes in chronic disease management apps.

North America remains the dominant region, and the software segment commands the largest market share, underscoring the criticality of advanced biometric data analytics and AI-driven health insights. A key technical pillar is wearable sensor technology, which provides the continuous, real-time physiological monitoring data essential for predictive health modeling.

Compliance with stringent regulations such as HIPAA necessitates investment in secure data exchange and HIPAA compliant cloud infrastructure. Platforms that successfully integrate genomic data and offer sophisticated digital twin simulation for treatment planning are setting the standard for hyper-personalized nutrition and proactive health interventions, forcing competitors to re-evaluate their R&D priorities.

Dive into Technavio’s robust research methodology, blending expert interviews, extensive data synthesis, and validated models for unparalleled Personalized Digital Health Platforms Market insights. See full methodology.

Request Free Sample

Market Scope
Page number 303
Base year 2025
Historic period 2020-2024
Forecast period 2026-2030
Growth momentum & CAGR Accelerate at a CAGR of 22.1%
Market growth 2026-2030 USD 93143.6 million
Market structure Fragmented
YoY growth 2025-2026(%) 20.7%
Key countries US, Canada, Mexico, UK, Germany, France, Italy, The Netherlands, Spain, Russia, China, India, Japan, South Korea, Indonesia, Thailand, Singapore, Australia, Brazil, UAE, Saudi Arabia, South Africa and Turkey
Competitive landscape Leading Companies, Market Positioning of Companies, Competitive Strategies, and Industry Risks

Personalized Digital Health Platforms Market: Key Questions Answered in This Report

  • What is the expected growth of the Personalized Digital Health Platforms Market between 2026 and 2030?

    • The Personalized Digital Health Platforms Market is expected to grow by USD 93.14 billion during 2026-2030, registering a CAGR of 22.1%. Year-over-year growth in 2026 is estimated at 20.7%%. This acceleration is shaped by increasing prevalence of chronic diseases and need for continuous monitoring, which is intensifying demand across multiple end-use verticals covered in the report.

  • What segmentation does the market report cover?

    • The report is segmented by Component (Software, Services, and Hardware), End-user (Healthcare providers, Patients and consumers, Pharma and biotech companies, and Healthcare payers), Application (Monitoring and follow‑up, Preventive care and wellness, Diagnosis and treatment support, and Rehabilitation and recovery) and Geography (North America, Europe, Asia, Rest of World (ROW)). Among these, the Software segment is estimated to witness significant growth during the forecast period, driven by rising adoption across key application areas. Each segment includes detailed qualitative and quantitative analysis, along with historical data from 2020-2024 and forecasts through 2030 with year-over-year growth rates.

  • Which regions are analyzed in the report?

    • The report covers North America, Europe, Asia and Rest of World (ROW). North America is estimated to contribute 35.5% to market growth during the forecast period. Country-level analysis includes US, Canada, Mexico, UK, Germany, France, Italy, The Netherlands, Spain, Russia, China, India, Japan, South Korea, Indonesia, Thailand, Singapore, Australia, Brazil, UAE, Saudi Arabia, South Africa and Turkey, with dedicated market size tables and year-over-year growth for each.

  • What are the key growth drivers and market challenges?

    • The primary driver is increasing prevalence of chronic diseases and need for continuous monitoring, which is accelerating investment and industry demand. The main challenge is stringent data privacy regulations and complexity of compliance, creating operational barriers for key market participants. The report quantifies the impact of each driver and challenge across 2026 and 2030 with comparative analysis.

  • Who are the major players in the Personalized Digital Health Platforms Market?

    • Key vendors include American Well Corp., Apple Inc., CalmSpace, Dexcom Inc., Fitbit LLC, Garmin Ltd., Google LLC, Myfitnesspal, Noom Inc., Omada Health Inc., Oura Health Oy, Parsley Health, Personify Health Inc., Segterra Inc., Spring Health Inc., Teladoc Health Inc., Thorne HealthTech Inc., Viome Life Sciences, Inc., Wild Health and ZOE Limited. The report provides qualitative and quantitative analysis categorizing companies as dominant, leading, strong, tentative, and weak based on their market positioning. Company profiles include business segment analysis, SWOT assessment, key offerings, and recent strategic developments.

Personalized Digital Health Platforms Market Research Insights

Market dynamics are shaped by demands for evidence-based digital care and patient empowerment tools. As the software segment's contribution to the market is substantially larger than hardware's, focus intensifies on algorithm-based recommendations and sustainable habit formation. Stakeholders must navigate complex data privacy and security frameworks like HIPAA to build trust for sharing user-generated health data.

In practice, an employer deploying a corporate wellness platform must ensure its data aggregation methods for holistic wellness tracking are compliant, using secure health data storage to protect employee privacy.

The drive for interoperable health systems that support personalized care pathways is a critical structural issue, compelling vendors to design platforms that not only deliver clinical value but also integrate seamlessly into existing healthcare IT infrastructure, moving beyond traditional, siloed methods of data management.

We can help! Our analysts can customize this personalized digital health platforms market research report to meet your requirements.

Get in touch

1. Executive Summary

1.1 Market overview

Executive Summary - Chart on Market Overview
Executive Summary - Data Table on Market Overview
Executive Summary - Chart on Global Market Characteristics
Executive Summary - Chart on Market by Geography
Executive Summary - Chart on Market Segmentation by Component
Executive Summary - Chart on Market Segmentation by End-user
Executive Summary - Chart on Market Segmentation by Application
Executive Summary - Chart on Incremental Growth
Executive Summary - Data Table on Incremental Growth
Executive Summary - Chart on Company Market Positioning

2. Technavio Analysis

2.1 Analysis of price sensitivity, lifecycle, customer purchase basket, adoption rates, and purchase criteria

2.2 Criticality of inputs and Factors of differentiation

Chart on Overview on criticality of inputs and factors of differentiation

2.3 Factors of disruption

Chart on Overview on factors of disruption

2.4 Impact of drivers and challenges

Chart on Impact of drivers and challenges in 2025 and 2030

3. Market Landscape

3.1 Market ecosystem

Chart on Parent Market
Data Table on - Parent Market

3.2 Market characteristics

Chart on Market characteristics analysis

3.3 Value chain analysis

Chart on Value chain analysis

4. Market Sizing

4.1 Market definition

Data Table on Offerings of companies included in the market definition

4.2 Market segment analysis

Market segments

4.3 Market size 2025

4.4 Market outlook: Forecast for 2025-2030

Chart on Global - Market size and forecast 2025-2030 ($ million)
Data Table on Global - Market size and forecast 2025-2030 ($ million)
Chart on Global Market: Year-over-year growth 2025-2030 (%)
Data Table on Global Market: Year-over-year growth 2025-2030 (%)

5. Historic Market Size

5.1 Global Personalized Digital Health Platforms Market 2020 - 2024

Historic Market Size - Data Table on Global Personalized Digital Health Platforms Market 2020 - 2024 ($ million)

5.2 Component segment analysis 2020 - 2024

Historic Market Size - Component Segment 2020 - 2024 ($ million)

5.3 End-user segment analysis 2020 - 2024

Historic Market Size - End-user Segment 2020 - 2024 ($ million)

5.4 Application segment analysis 2020 - 2024

Historic Market Size - Application Segment 2020 - 2024 ($ million)

5.5 Geography segment analysis 2020 - 2024

Historic Market Size - Geography Segment 2020 - 2024 ($ million)

5.6 Country segment analysis 2020 - 2024

Historic Market Size - Country Segment 2020 - 2024 ($ million)

6. Qualitative Analysis

6.1 Impact of AI on Global Personalized Digital Health Platforms Market

6.2 Impact of Geopolitical Conflicts on Global Personalized Digital Health Platforms Market

7. Five Forces Analysis

7.1 Five forces summary

Five forces analysis - Comparison between 2025 and 2030

7.2 Bargaining power of buyers

Bargaining power of buyers - Impact of key factors 2025 and 2030

7.3 Bargaining power of suppliers

Bargaining power of suppliers - Impact of key factors in 2025 and 2030

7.4 Threat of new entrants

Threat of new entrants - Impact of key factors in 2025 and 2030

7.5 Threat of substitutes

Threat of substitutes - Impact of key factors in 2025 and 2030

7.6 Threat of rivalry

Threat of rivalry - Impact of key factors in 2025 and 2030

7.7 Market condition

Chart on Market condition - Five forces 2025 and 2030

8. Market Segmentation by Component

8.1 Market segments

Chart on Component - Market share 2025-2030 (%)
Data Table on Component - Market share 2025-2030 (%)

8.2 Comparison by Component

Chart on Comparison by Component
Data Table on Comparison by Component

8.3 Software - Market size and forecast 2025-2030

Chart on Software - Market size and forecast 2025-2030 ($ million)
Data Table on Software - Market size and forecast 2025-2030 ($ million)
Chart on Software - Year-over-year growth 2025-2030 (%)
Data Table on Software - Year-over-year growth 2025-2030 (%)

8.4 Services - Market size and forecast 2025-2030

Chart on Services - Market size and forecast 2025-2030 ($ million)
Data Table on Services - Market size and forecast 2025-2030 ($ million)
Chart on Services - Year-over-year growth 2025-2030 (%)
Data Table on Services - Year-over-year growth 2025-2030 (%)

8.5 Hardware - Market size and forecast 2025-2030

Chart on Hardware - Market size and forecast 2025-2030 ($ million)
Data Table on Hardware - Market size and forecast 2025-2030 ($ million)
Chart on Hardware - Year-over-year growth 2025-2030 (%)
Data Table on Hardware - Year-over-year growth 2025-2030 (%)

8.6 Market opportunity by Component

Market opportunity by Component ($ million)
Data Table on Market opportunity by Component ($ million)

9. Market Segmentation by End-user

9.1 Market segments

Chart on End-user - Market share 2025-2030 (%)
Data Table on End-user - Market share 2025-2030 (%)

9.2 Comparison by End-user

Chart on Comparison by End-user
Data Table on Comparison by End-user

9.3 Healthcare providers - Market size and forecast 2025-2030

Chart on Healthcare providers - Market size and forecast 2025-2030 ($ million)
Data Table on Healthcare providers - Market size and forecast 2025-2030 ($ million)
Chart on Healthcare providers - Year-over-year growth 2025-2030 (%)
Data Table on Healthcare providers - Year-over-year growth 2025-2030 (%)

9.4 Patients and consumers - Market size and forecast 2025-2030

Chart on Patients and consumers - Market size and forecast 2025-2030 ($ million)
Data Table on Patients and consumers - Market size and forecast 2025-2030 ($ million)
Chart on Patients and consumers - Year-over-year growth 2025-2030 (%)
Data Table on Patients and consumers - Year-over-year growth 2025-2030 (%)

9.5 Pharma and biotech companies - Market size and forecast 2025-2030

Chart on Pharma and biotech companies - Market size and forecast 2025-2030 ($ million)
Data Table on Pharma and biotech companies - Market size and forecast 2025-2030 ($ million)
Chart on Pharma and biotech companies - Year-over-year growth 2025-2030 (%)
Data Table on Pharma and biotech companies - Year-over-year growth 2025-2030 (%)

9.6 Healthcare payers - Market size and forecast 2025-2030

Chart on Healthcare payers - Market size and forecast 2025-2030 ($ million)
Data Table on Healthcare payers - Market size and forecast 2025-2030 ($ million)
Chart on Healthcare payers - Year-over-year growth 2025-2030 (%)
Data Table on Healthcare payers - Year-over-year growth 2025-2030 (%)

9.7 Market opportunity by End-user

Market opportunity by End-user ($ million)
Data Table on Market opportunity by End-user ($ million)

10. Market Segmentation by Application

10.1 Market segments

Chart on Application - Market share 2025-2030 (%)
Data Table on Application - Market share 2025-2030 (%)

10.2 Comparison by Application

Chart on Comparison by Application
Data Table on Comparison by Application

10.3 Monitoring and follow‑up - Market size and forecast 2025-2030

Chart on Monitoring and follow‑up - Market size and forecast 2025-2030 ($ million)
Data Table on Monitoring and follow‑up - Market size and forecast 2025-2030 ($ million)
Chart on Monitoring and follow‑up - Year-over-year growth 2025-2030 (%)
Data Table on Monitoring and follow‑up - Year-over-year growth 2025-2030 (%)

10.4 Preventive care and wellness - Market size and forecast 2025-2030

Chart on Preventive care and wellness - Market size and forecast 2025-2030 ($ million)
Data Table on Preventive care and wellness - Market size and forecast 2025-2030 ($ million)
Chart on Preventive care and wellness - Year-over-year growth 2025-2030 (%)
Data Table on Preventive care and wellness - Year-over-year growth 2025-2030 (%)

10.5 Diagnosis and treatment support - Market size and forecast 2025-2030

Chart on Diagnosis and treatment support - Market size and forecast 2025-2030 ($ million)
Data Table on Diagnosis and treatment support - Market size and forecast 2025-2030 ($ million)
Chart on Diagnosis and treatment support - Year-over-year growth 2025-2030 (%)
Data Table on Diagnosis and treatment support - Year-over-year growth 2025-2030 (%)

10.6 Rehabilitation and recovery - Market size and forecast 2025-2030

Chart on Rehabilitation and recovery - Market size and forecast 2025-2030 ($ million)
Data Table on Rehabilitation and recovery - Market size and forecast 2025-2030 ($ million)
Chart on Rehabilitation and recovery - Year-over-year growth 2025-2030 (%)
Data Table on Rehabilitation and recovery - Year-over-year growth 2025-2030 (%)

10.7 Market opportunity by Application

Market opportunity by Application ($ million)
Data Table on Market opportunity by Application ($ million)

11. Customer Landscape

11.1 Customer landscape overview

Analysis of price sensitivity, lifecycle, customer purchase basket, adoption rates, and purchase criteria

12. Geographic Landscape

12.1 Geographic segmentation

Chart on Market share by geography 2025-2030 (%)
Data Table on Market share by geography 2025-2030 (%)

12.2 Geographic comparison

Chart on Geographic comparison
Data Table on Geographic comparison

12.3 North America - Market size and forecast 2025-2030

Chart on North America - Market size and forecast 2025-2030 ($ million)
Data Table on North America - Market size and forecast 2025-2030 ($ million)
Chart on North America - Year-over-year growth 2025-2030 (%)
Data Table on North America - Year-over-year growth 2025-2030 (%)
Chart on Regional Comparison - North America
Data Table on Regional Comparison - North America

12.3.1 US - Market size and forecast 2025-2030

Chart on US - Market size and forecast 2025-2030 ($ million)
Data Table on US - Market size and forecast 2025-2030 ($ million)
Chart on US - Year-over-year growth 2025-2030 (%)
Data Table on US - Year-over-year growth 2025-2030 (%)

12.3.2 Canada - Market size and forecast 2025-2030

Chart on Canada - Market size and forecast 2025-2030 ($ million)
Data Table on Canada - Market size and forecast 2025-2030 ($ million)
Chart on Canada - Year-over-year growth 2025-2030 (%)
Data Table on Canada - Year-over-year growth 2025-2030 (%)

12.3.3 Mexico - Market size and forecast 2025-2030

Chart on Mexico - Market size and forecast 2025-2030 ($ million)
Data Table on Mexico - Market size and forecast 2025-2030 ($ million)
Chart on Mexico - Year-over-year growth 2025-2030 (%)
Data Table on Mexico - Year-over-year growth 2025-2030 (%)

12.4 Europe - Market size and forecast 2025-2030

Chart on Europe - Market size and forecast 2025-2030 ($ million)
Data Table on Europe - Market size and forecast 2025-2030 ($ million)
Chart on Europe - Year-over-year growth 2025-2030 (%)
Data Table on Europe - Year-over-year growth 2025-2030 (%)
Chart on Regional Comparison - Europe
Data Table on Regional Comparison - Europe

12.4.1 UK - Market size and forecast 2025-2030

Chart on UK - Market size and forecast 2025-2030 ($ million)
Data Table on UK - Market size and forecast 2025-2030 ($ million)
Chart on UK - Year-over-year growth 2025-2030 (%)
Data Table on UK - Year-over-year growth 2025-2030 (%)

12.4.2 Germany - Market size and forecast 2025-2030

Chart on Germany - Market size and forecast 2025-2030 ($ million)
Data Table on Germany - Market size and forecast 2025-2030 ($ million)
Chart on Germany - Year-over-year growth 2025-2030 (%)
Data Table on Germany - Year-over-year growth 2025-2030 (%)

12.4.3 France - Market size and forecast 2025-2030

Chart on France - Market size and forecast 2025-2030 ($ million)
Data Table on France - Market size and forecast 2025-2030 ($ million)
Chart on France - Year-over-year growth 2025-2030 (%)
Data Table on France - Year-over-year growth 2025-2030 (%)

12.4.4 Italy - Market size and forecast 2025-2030

Chart on Italy - Market size and forecast 2025-2030 ($ million)
Data Table on Italy - Market size and forecast 2025-2030 ($ million)
Chart on Italy - Year-over-year growth 2025-2030 (%)
Data Table on Italy - Year-over-year growth 2025-2030 (%)

12.4.5 The Netherlands - Market size and forecast 2025-2030

Chart on The Netherlands - Market size and forecast 2025-2030 ($ million)
Data Table on The Netherlands - Market size and forecast 2025-2030 ($ million)
Chart on The Netherlands - Year-over-year growth 2025-2030 (%)
Data Table on The Netherlands - Year-over-year growth 2025-2030 (%)

12.4.6 Spain - Market size and forecast 2025-2030

Chart on Spain - Market size and forecast 2025-2030 ($ million)
Data Table on Spain - Market size and forecast 2025-2030 ($ million)
Chart on Spain - Year-over-year growth 2025-2030 (%)
Data Table on Spain - Year-over-year growth 2025-2030 (%)

12.4.7 Russia - Market size and forecast 2025-2030

Chart on Russia - Market size and forecast 2025-2030 ($ million)
Data Table on Russia - Market size and forecast 2025-2030 ($ million)
Chart on Russia - Year-over-year growth 2025-2030 (%)
Data Table on Russia - Year-over-year growth 2025-2030 (%)

12.5 Asia - Market size and forecast 2025-2030

Chart on Asia - Market size and forecast 2025-2030 ($ million)
Data Table on Asia - Market size and forecast 2025-2030 ($ million)
Chart on Asia - Year-over-year growth 2025-2030 (%)
Data Table on Asia - Year-over-year growth 2025-2030 (%)
Chart on Regional Comparison - Asia
Data Table on Regional Comparison - Asia

12.5.1 China - Market size and forecast 2025-2030

Chart on China - Market size and forecast 2025-2030 ($ million)
Data Table on China - Market size and forecast 2025-2030 ($ million)
Chart on China - Year-over-year growth 2025-2030 (%)
Data Table on China - Year-over-year growth 2025-2030 (%)

12.5.2 India - Market size and forecast 2025-2030

Chart on India - Market size and forecast 2025-2030 ($ million)
Data Table on India - Market size and forecast 2025-2030 ($ million)
Chart on India - Year-over-year growth 2025-2030 (%)
Data Table on India - Year-over-year growth 2025-2030 (%)

12.5.3 Japan - Market size and forecast 2025-2030

Chart on Japan - Market size and forecast 2025-2030 ($ million)
Data Table on Japan - Market size and forecast 2025-2030 ($ million)
Chart on Japan - Year-over-year growth 2025-2030 (%)
Data Table on Japan - Year-over-year growth 2025-2030 (%)

12.5.4 South Korea - Market size and forecast 2025-2030

Chart on South Korea - Market size and forecast 2025-2030 ($ million)
Data Table on South Korea - Market size and forecast 2025-2030 ($ million)
Chart on South Korea - Year-over-year growth 2025-2030 (%)
Data Table on South Korea - Year-over-year growth 2025-2030 (%)

12.5.5 Indonesia - Market size and forecast 2025-2030

Chart on Indonesia - Market size and forecast 2025-2030 ($ million)
Data Table on Indonesia - Market size and forecast 2025-2030 ($ million)
Chart on Indonesia - Year-over-year growth 2025-2030 (%)
Data Table on Indonesia - Year-over-year growth 2025-2030 (%)

12.5.6 Thailand - Market size and forecast 2025-2030

Chart on Thailand - Market size and forecast 2025-2030 ($ million)
Data Table on Thailand - Market size and forecast 2025-2030 ($ million)
Chart on Thailand - Year-over-year growth 2025-2030 (%)
Data Table on Thailand - Year-over-year growth 2025-2030 (%)

12.5.7 Singapore - Market size and forecast 2025-2030

Chart on Singapore - Market size and forecast 2025-2030 ($ million)
Data Table on Singapore - Market size and forecast 2025-2030 ($ million)
Chart on Singapore - Year-over-year growth 2025-2030 (%)
Data Table on Singapore - Year-over-year growth 2025-2030 (%)

12.6 Rest of World (ROW) - Market size and forecast 2025-2030

Chart on Rest of World (ROW) - Market size and forecast 2025-2030 ($ million)
Data Table on Rest of World (ROW) - Market size and forecast 2025-2030 ($ million)
Chart on Rest of World (ROW) - Year-over-year growth 2025-2030 (%)
Data Table on Rest of World (ROW) - Year-over-year growth 2025-2030 (%)
Chart on Regional Comparison - Rest of World (ROW)
Data Table on Regional Comparison - Rest of World (ROW)

12.6.1 Australia - Market size and forecast 2025-2030

Chart on Australia - Market size and forecast 2025-2030 ($ million)
Data Table on Australia - Market size and forecast 2025-2030 ($ million)
Chart on Australia - Year-over-year growth 2025-2030 (%)
Data Table on Australia - Year-over-year growth 2025-2030 (%)

12.6.2 Brazil - Market size and forecast 2025-2030

Chart on Brazil - Market size and forecast 2025-2030 ($ million)
Data Table on Brazil - Market size and forecast 2025-2030 ($ million)
Chart on Brazil - Year-over-year growth 2025-2030 (%)
Data Table on Brazil - Year-over-year growth 2025-2030 (%)

12.6.3 UAE - Market size and forecast 2025-2030

Chart on UAE - Market size and forecast 2025-2030 ($ million)
Data Table on UAE - Market size and forecast 2025-2030 ($ million)
Chart on UAE - Year-over-year growth 2025-2030 (%)
Data Table on UAE - Year-over-year growth 2025-2030 (%)

12.6.4 Saudi Arabia - Market size and forecast 2025-2030

Chart on Saudi Arabia - Market size and forecast 2025-2030 ($ million)
Data Table on Saudi Arabia - Market size and forecast 2025-2030 ($ million)
Chart on Saudi Arabia - Year-over-year growth 2025-2030 (%)
Data Table on Saudi Arabia - Year-over-year growth 2025-2030 (%)

12.6.5 South Africa - Market size and forecast 2025-2030

Chart on South Africa - Market size and forecast 2025-2030 ($ million)
Data Table on South Africa - Market size and forecast 2025-2030 ($ million)
Chart on South Africa - Year-over-year growth 2025-2030 (%)
Data Table on South Africa - Year-over-year growth 2025-2030 (%)

12.6.6 Turkey - Market size and forecast 2025-2030

Chart on Turkey - Market size and forecast 2025-2030 ($ million)
Data Table on Turkey - Market size and forecast 2025-2030 ($ million)
Chart on Turkey - Year-over-year growth 2025-2030 (%)
Data Table on Turkey - Year-over-year growth 2025-2030 (%)

12.7 Market opportunity by geography

Market opportunity by geography ($ million)
Data Tables on Market opportunity by geography ($ million)

13. Drivers, Challenges, and Opportunity

13.1 Market drivers

Increasing prevalence of chronic diseases and need for continuous monitoring
Advancements in AI and machine learning algorithms
Proliferation of wearable devices and expansion of Internet of Medical Things

13.2 Market challenges

Stringent data privacy regulations and complexity of compliance
Interoperability issues among disparate healthcare information systems
High cost of platform deployment

13.3 Impact of drivers and challenges

Impact of drivers and challenges in 2025 and 2030

13.4 Market opportunities

Integration of genomic data and biomarker analytics for hyper-personalization
Emergence of gamification and behavioral economics to drive patient engagement
Adoption of blockchain technology for enhanced data security and interoperability

14. Competitive Landscape

14.1 Overview

14.2

Overview on criticality of inputs and factors of differentiation

14.3 Landscape disruption

Overview on factors of disruption

14.4 Industry risks

Impact of key risks on business

15. Competitive Analysis

15.1 Companies profiled

Companies covered

15.2 Company ranking index

15.3 Market positioning of companies

Matrix on companies position and classification

15.4 American Well Corp.

American Well Corp. - Overview
American Well Corp. - Product / Service
American Well Corp. - Key offerings
SWOT

15.5 Apple Inc.

Apple Inc. - Overview
Apple Inc. - Business segments
Apple Inc. - Key news
Apple Inc. - Key offerings
Apple Inc. - Segment focus
SWOT

15.6 Dexcom Inc.

Dexcom Inc. - Overview
Dexcom Inc. - Product / Service
Dexcom Inc. - Key news
Dexcom Inc. - Key offerings
SWOT

15.7 Fitbit LLC

Fitbit LLC - Overview
Fitbit LLC - Product / Service
Fitbit LLC - Key offerings
SWOT

15.8 Garmin Ltd.

Garmin Ltd. - Overview
Garmin Ltd. - Business segments
Garmin Ltd. - Key news
Garmin Ltd. - Key offerings
Garmin Ltd. - Segment focus
SWOT

15.9 Google LLC

Google LLC - Overview
Google LLC - Product / Service
Google LLC - Key offerings
SWOT

15.10 Myfitnesspal

Myfitnesspal - Overview
Myfitnesspal - Product / Service
Myfitnesspal - Key offerings
SWOT

15.11 Noom Inc.

Noom Inc. - Overview
Noom Inc. - Product / Service
Noom Inc. - Key offerings
SWOT

15.12 Omada Health Inc.

Omada Health Inc. - Overview
Omada Health Inc. - Product / Service
Omada Health Inc. - Key offerings
SWOT

15.13 Oura Health Oy

Oura Health Oy - Overview
Oura Health Oy - Product / Service
Oura Health Oy - Key offerings
SWOT

15.14 Personify Health Inc.

Personify Health Inc. - Overview
Personify Health Inc. - Product / Service
Personify Health Inc. - Key offerings
SWOT

15.15 Spring Health Inc.

Spring Health Inc. - Overview
Spring Health Inc. - Product / Service
Spring Health Inc. - Key offerings
SWOT

15.16 Teladoc Health Inc.

Teladoc Health Inc. - Overview
Teladoc Health Inc. - Product / Service
Teladoc Health Inc. - Key news
Teladoc Health Inc. - Key offerings
SWOT

15.17 Thorne HealthTech Inc.

Thorne HealthTech Inc. - Overview
Thorne HealthTech Inc. - Product / Service
Thorne HealthTech Inc. - Key offerings
SWOT

15.18 ZOE Limited

ZOE Limited - Overview
ZOE Limited - Product / Service
ZOE Limited - Key offerings
SWOT

16. Appendix

16.1 Scope of the report

Market definition
Objectives
Notes and caveats

16.2 Inclusions and exclusions checklist

Inclusions checklist
Exclusions checklist

16.3 Currency conversion rates for US$

16.4 Research methodology

16.5 Data procurement

Information sources

16.6 Data validation

16.7 Validation techniques employed for market sizing

16.8 Data synthesis

16.9 360 degree market analysis

16.10 List of abbreviations

Research Methodology

Technavio presents a detailed picture of the market by way of study, synthesis, and summation of data from multiple sources. The analysts have presented the various facets of the market with a particular focus on identifying the key industry influencers. The data thus presented is comprehensive, reliable, and the result of extensive research, both primary and secondary.

INFORMATION SOURCES

Primary sources

  • Manufacturers and suppliers
  • Channel partners
  • Industry experts
  • Strategic decision makers

Secondary sources

  • Industry journals and periodicals
  • Government data
  • Financial reports of key industry players
  • Historical data
  • Press releases

DATA ANALYSIS

Data Synthesis

  • Collation of data
  • Estimation of key figures
  • Analysis of derived insights

Data Validation

  • Triangulation with data models
  • Reference against proprietary databases
  • Corroboration with industry experts

REPORT WRITING

Qualitative

  • Market drivers
  • Market challenges
  • Market trends
  • Five forces analysis

Quantitative

  • Market size and forecast
  • Market segmentation
  • Geographical insights
  • Competitive landscape

Interested in this report?

Get your sample now to see our research methodology and insights!

Download Now

Frequently Asked Questions

Personalized Digital Health Platforms market growth will increase by USD 93143.6 million during 2026-2030.

The Personalized Digital Health Platforms market is expected to grow at a CAGR of 22.1% during 2026-2030.

Personalized Digital Health Platforms market is segmented by Component (Software, Services, Hardware) End-user (Healthcare providers, Patients and consumers, Pharma and biotech companies, Healthcare payers) Application (Monitoring and follow‑up, Preventive care and wellness, Diagnosis and treatment support, Rehabilitation and recovery)

American Well Corp., Apple Inc., CalmSpace, Dexcom Inc., Fitbit LLC, Garmin Ltd., Google LLC, Myfitnesspal, Noom Inc., Omada Health Inc., Oura Health Oy, Parsley Health, Personify Health Inc., Segterra Inc., Spring Health Inc., Teladoc Health Inc., Thorne HealthTech Inc., Viome Life Sciences, Inc., Wild Health, ZOE Limited are a few of the key vendors in the Personalized Digital Health Platforms market.

North America will register the highest growth rate of 35.5% among the other regions. Therefore, the Personalized Digital Health Platforms market in North America is expected to garner significant business opportunities for the vendors during the forecast period.

US, Canada, Mexico, UK, Germany, France, Italy, The Netherlands, Spain, Russia, China, India, Japan, South Korea, Indonesia, Thailand, Singapore, Australia, Brazil, UAE, Saudi Arabia, South Africa, Turkey

  • Increasing prevalence of chronic diseases and need for continuous monitoring is the driving factor this market.

The Personalized Digital Health Platforms market vendors should focus on grabbing business opportunities from the Component segment as it accounted for the largest market share in the base year.
RIA - Research AI Assistant
Ask RIA