Packaging Market Analysis, Size, and Forecast 2026-2030: APAC (China, Japan, and India), North America (US, Canada, and Mexico), Europe (Germany, UK, and France), Middle East and Africa (Saudi Arabia, UAE, and Turkey), South America (Brazil and Argentina), and Rest of World (ROW)

Packaging Market Analysis, Size, and Forecast 2026-2030:
APAC (China, Japan, and India), North America (US, Canada, and Mexico), Europe (Germany, UK, and France), Middle East and Africa (Saudi Arabia, UAE, and Turkey), South America (Brazil and Argentina), and Rest of World (ROW)

Published: May 2026 323 Pages SKU: IRTNTR44725

Market Overview at a Glance

$327.1 B
Market Opportunity
4.8%
CAGR 2025 - 2030
38.2%
APAC Growth
$401.9 B
Board segment 2024

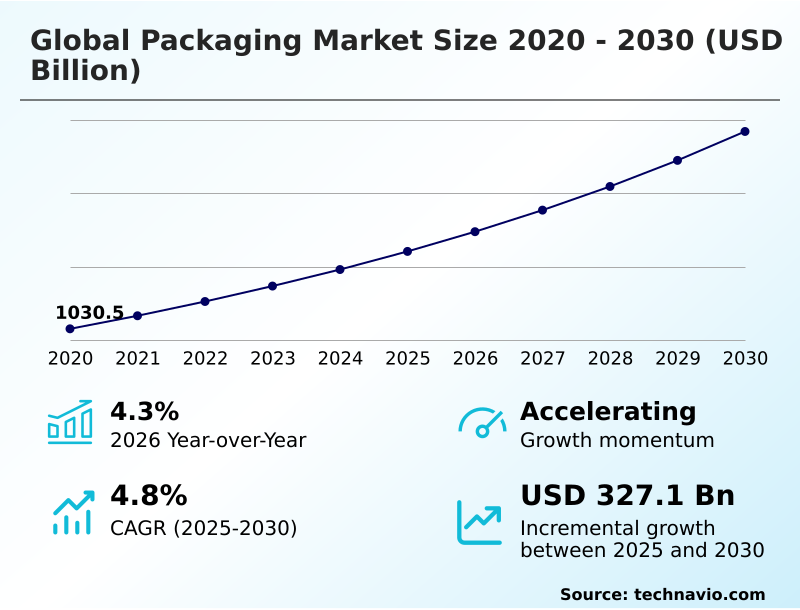
Packaging Market Size 2026-2030

The packaging market size is valued to increase by USD 327.1 billion, at a CAGR of 4.8% from 2025 to 2030. Proliferation of global e-commerce and last-mile logistics efficiency will drive the packaging market.

Major Market Trends & Insights

  • APAC dominated the market and accounted for a 38.2% growth during the forecast period.
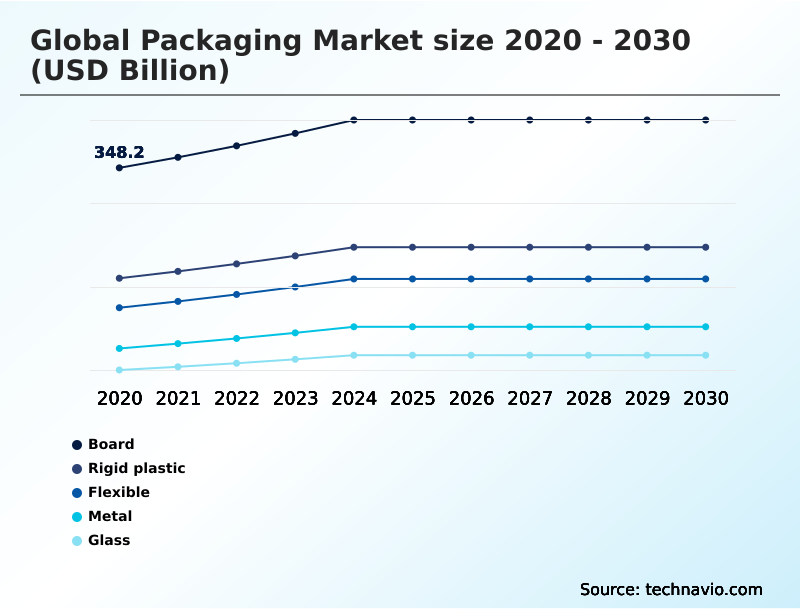
  • By Type - Board segment was valued at USD 401.9 billion in 2024
  • By End-user - Food segment accounted for the largest market revenue share in 2024

Market Size & Forecast

  • Market Opportunities: USD 538.2 billion
  • Market Future Opportunities: USD 327.1 billion
  • CAGR from 2025 to 2030 : 4.8%

Market Summary

  • The packaging market is navigating a period of profound transformation, balancing the need for e-commerce protective packaging with a strategic pivot toward sustainability. This shift is characterized by a move to mono-material packaging and the integration of post-consumer recycled content, driven by both consumer demand and extended producer responsibility legislation.
  • In practice, a food manufacturer may adopt flexible packaging films with enhanced barrier properties to extend product shelf life, while simultaneously using supply chain traceability systems to validate the origin of its bio-based packaging materials. Innovations in digital printing for packaging allow for greater customization, while end-of-line automation enhances operational efficiency.
  • However, the industry grapples with the technical challenges of developing food-grade recycled polymers and ensuring that new formats are compatible with existing waste management infrastructure. Success hinges on a holistic approach that marries advanced material science with circular economy principles to create solutions that are both functional and environmentally responsible.

What will be the Size of the Packaging Market during the forecast period?

Get Key Insights on Market Forecast (PDF) Get Free Sample

How is the Packaging Market Segmented?

The packaging industry research report provides comprehensive data (region-wise segment analysis), with forecasts and estimates in "USD billion" for the period 2026-2030, as well as historical data from 2020-2024 for the following segments.

  • Type
    • Board
    • Rigid plastic
    • Flexible
    • Metal
    • Glass
  • End-user
    • Food
    • Beverage
    • Healthcare
    • Personal care
    • Others
  • Technology
    • Flexography
    • Offset
    • Gravure
    • Digital
    • Screen
  • Geography
    • APAC
      • China
      • Japan
      • India
    • North America
      • US
      • Canada
      • Mexico
    • Europe
      • Germany
      • UK
      • France
    • Middle East and Africa
      • Saudi Arabia
      • UAE
      • Turkey
    • South America
      • Brazil
      • Argentina
    • Rest of World (ROW)

By Type Insights

The board segment is estimated to witness significant growth during the forecast period.

The board segment, a foundational pillar of the industry, is driven by demand for corrugated board solutions in secondary and tertiary packaging systems. Its versatility and environmental credentials, rooted in renewable sourcing, align with circular economy principles.

This is particularly critical in e-commerce, where lightweighting technologies are essential for optimizing logistics and distribution. The material’s excellent surface for high-quality graphics, achieved through advanced ink and coating formulations, makes it a powerful tool for brand communication.

Continuous R&D efforts are focused on enhancing performance, with advancements in moisture-resistant coatings improving applicability and expanding the use of paperboard in primary packaging design, increasing its adoption by 12% in certain food categories.

Get Free Sample

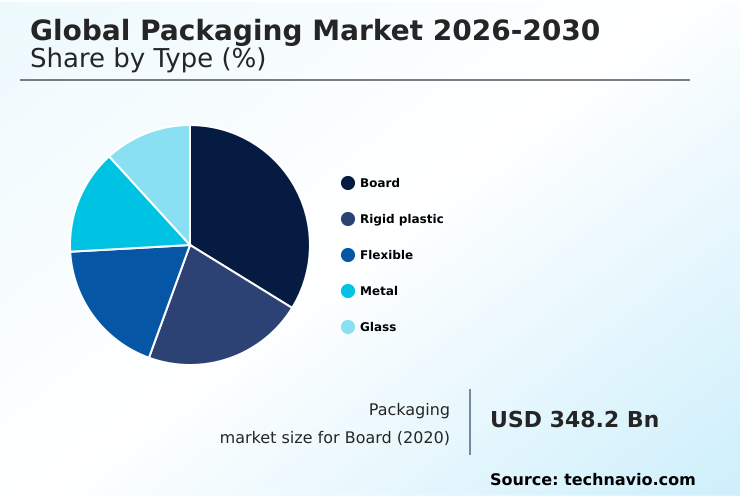
The Board segment was valued at USD 401.9 billion in 2024 and showed a gradual increase during the forecast period.

Get Free Sample

Regional Analysis

APAC is estimated to contribute 38.2% to the growth of the global market during the forecast period.Technavio’s analysts have elaborately explained the regional trends and drivers that shape the market during the forecast period.

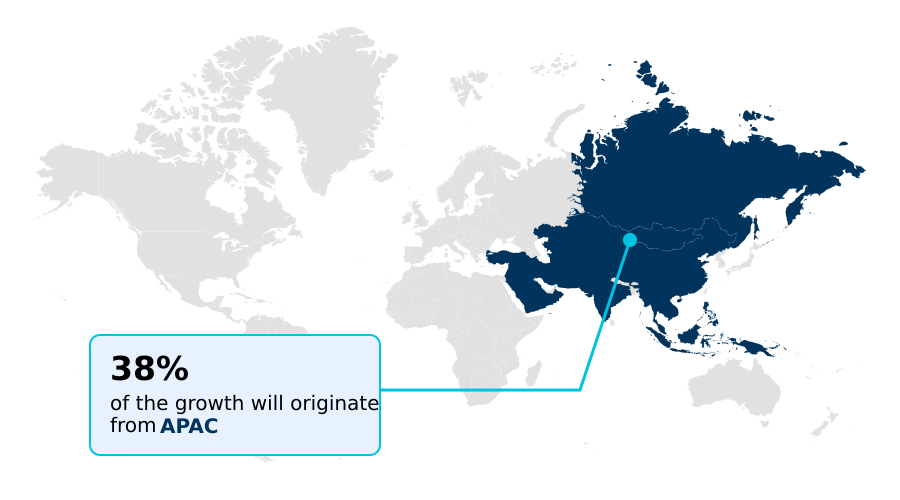
See How Packaging Market Demand is Rising in APAC Get Free Sample

The geographic landscape of the packaging market is defined by varied regional growth and regulatory pressures.

The APAC region is a significant growth engine, contributing 38.15% of the market's incremental growth, driven by demand for flexible packaging films for its expanding food sector.

In contrast, North America and Europe, while representing mature markets, are epicenters of innovation in sustainable packaging solutions and advanced material science.

Growth in South America, at 6.1%, outpaces Europe's 4.1% rate, largely due to the region's focus on bio-based packaging materials derived from its agricultural sector.

Across all regions, the adoption of aseptic carton technology and rigid plastic containers continues, with a strong emphasis on meeting diverse regulatory compliance standards and enhancing brand protection technologies.

Market Dynamics

Our researchers analyzed the data with 2025 as the base year, along with the key drivers, trends, and challenges. A holistic analysis of drivers will help companies refine their marketing strategies to gain a competitive advantage.

  • The strategic implementation of circular economy models in the packaging industry is reshaping supply chains, particularly for sustainable packaging for food and beverage. This transition necessitates advanced recycling technologies for flexible plastics to effectively process materials and reintroduce them into the production cycle.
  • Simultaneously, the impact of raw material volatility on packaging costs is compelling organizations to explore lightweighting strategies for rigid plastic containers and optimize packaging for last-mile delivery. For high-value sectors, meeting pharmaceutical packaging compliance standards is non-negotiable, driving demand for tamper-evident solutions for brand protection and smart packaging for supply chain visibility.
  • Robotic automation in secondary packaging lines is becoming standard, with some companies reporting a threefold reduction in packing errors compared to manual processes. This focus on automation is also seen in packaging design for automated filling lines. The push for sustainability also involves a cost-benefit analysis of returnable packaging and the development of bio-based alternatives to petroleum plastics.
  • The widespread adoption of mono-material solutions for improved recyclability and high-barrier films for perishable food preservation addresses both environmental and functional requirements.
  • As e-commerce packaging for fragile goods becomes more sophisticated, digital printing for personalized consumer packaging offers new avenues for brand engagement, all while navigating the complexities of extended producer responsibility scheme implementation and the challenges in incorporating post-consumer recycled content in aseptic packaging systems for liquid products.

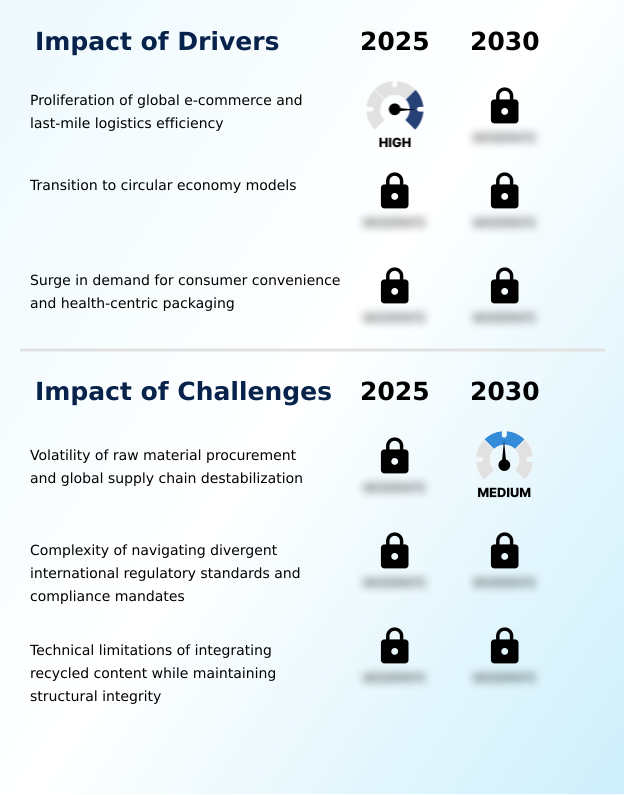
What are the key market drivers leading to the rise in the adoption of Packaging Industry?

  • The proliferation of global e-commerce and the corresponding need for last-mile logistics efficiency serves as a key driver for market growth.

  • Market growth is significantly driven by the expansion of e-commerce, which has amplified the need for robust secondary packaging optimization and efficient logistics and distribution networks. This has spurred innovation in corrugated board solutions designed for transit.
  • Simultaneously, the global shift towards a circular economy has become a primary catalyst, promoting the use of post-consumer recycled content and returnable packaging systems.
  • This driver has accelerated advancements in waste management infrastructure, with some regions improving plastic bottle collection rates by up to 30%.
  • Consumer demand for convenience and health is also crucial, fueling the development of rigid plastic containers with consumer convenience features and advanced dispensing closure systems.

What are the market trends shaping the Packaging Industry?

  • The integration of Packaging 4.0 principles, including advanced smart monitoring systems, is emerging as a transformative market trend.

  • Key trends reshaping the market include the adoption of smart packaging integration and end-of-line automation, which together are reducing processing errors by over 25% in high-volume facilities. The rise of hyper-personalization, enabled by digital printing for packaging, allows for custom packaging production at scale, significantly reducing time-to-market compared to conventional methods.
  • The push for sustainability is driving innovation in heat-sealable coatings and flexible forming films, which contribute to lightweighting efforts. Furthermore, the industrial shift towards Packaging 4.0 is fostering a connected ecosystem where e-commerce protective packaging and aseptic carton technology are optimized in real-time, improving supply chain efficiency and product safety.

What challenges does the Packaging Industry face during its growth?

  • Volatility in raw material procurement and global supply chain destabilization present a key challenge to industry growth.

  • A primary challenge remains raw material volatility, where unpredictable price swings can increase production costs by as much as 20% in a single quarter, disrupting material sourcing strategies. This instability is compounded by a fragmented global regulatory landscape, creating complexities around regulatory compliance standards and extended producer responsibility mandates.
  • Furthermore, technical limitations in chemical recycling processes and the integration of food-grade recycled polymers present significant hurdles. Achieving the desired performance in high-barrier packaging films while using recycled materials requires breakthroughs in multi-layer film coextrusion and substrate compatibility, presenting ongoing R&D challenges for the industry.

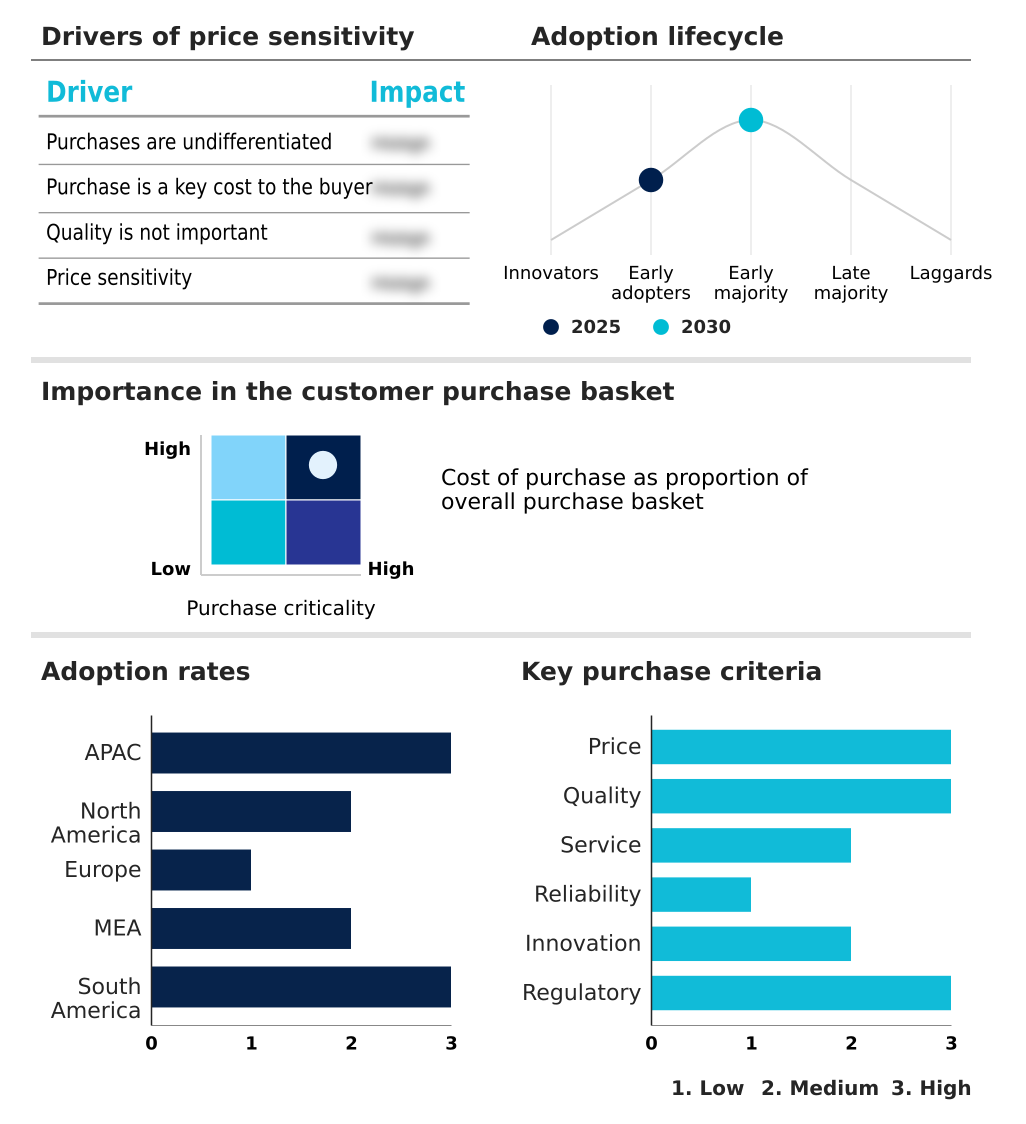
Exclusive Technavio Analysis on Customer Landscape

The packaging market forecasting report includes the adoption lifecycle of the market, covering from the innovator’s stage to the laggard’s stage. It focuses on adoption rates in different regions based on penetration. Furthermore, the packaging market report also includes key purchase criteria and drivers of price sensitivity to help companies evaluate and develop their market growth analysis strategies.

Customer Landscape of Packaging Industry

Competitive Landscape

Companies are implementing various strategies, such as strategic alliances, packaging market forecast, partnerships, mergers and acquisitions, geographical expansion, and product/service launches, to enhance their presence in the industry.

Amcor Plc - Key offerings include a diverse range of rigid and flexible packaging formats, specialty cartons, and closure systems tailored for the food, beverage, healthcare, and personal care sectors.

The industry research and growth report includes detailed analyses of the competitive landscape of the market and information about key companies, including:

  • Amcor Plc
  • AptarGroup Inc.
  • Ball Corp.
  • CCL Industries Inc.
  • Constantia Flexibles GmbH
  • Crown Holdings Inc.
  • DS Smith Plc
  • Gerresheimer AG
  • Graphic Packaging Holding Co.
  • Greif Inc.
  • Huhtamaki Oyj
  • International Paper Co.
  • Mondi Plc
  • O I Glass Inc.
  • Sealed Air Corp.
  • SIG Group AG
  • Silgan Holdings Inc.
  • Smurfit Westrock plc
  • Sonoco Products Co.
  • Stora Enso Oyj

Qualitative and quantitative analysis of companies has been conducted to help clients understand the wider business environment as well as the strengths and weaknesses of key industry players. Data is qualitatively analyzed to categorize companies as pure play, category-focused, industry-focused, and diversified; it is quantitatively analyzed to categorize companies as dominant, leading, strong, tentative, and weak.

Recent Development and News in Packaging market

  • In September 2024, Mondi Plc announced a significant investment in its production lines to scale the output of its new mono-material pouch technology, designed to be fully recyclable while maintaining high-barrier properties for food applications.
  • In November 2024, Smurfit Westrock plc initiated a large-scale deployment of advanced robotic automation and AI-powered vision systems across its North American corrugated packaging plants, targeting a 15% increase in throughput and enhanced quality control.
  • In January 2025, SIG Group AG formalized a strategic partnership with the Ellen MacArthur Foundation to advance circular packaging systems, focusing on minimizing industrial waste and enhancing the recyclability of liquid cartons.
  • In April 2025, Amcor Plc completed its acquisition of Berry Global Group Inc., creating a combined entity focused on high-growth categories like healthcare and specialty nutrition and aiming to scale the production of innovative, sustainable dispensing solutions.

Dive into Technavio’s robust research methodology, blending expert interviews, extensive data synthesis, and validated models for unparalleled Packaging Market insights. See full methodology.

Market Scope
Page number 323
Base year 2025
Historic period 2020-2024
Forecast period 2026-2030
Growth momentum & CAGR Accelerate at a CAGR of 4.8%
Market growth 2026-2030 USD 327.1 billion
Market structure Fragmented
YoY growth 2025-2026(%) 4.3%
Key countries China, Japan, India, South Korea, Australia, Indonesia, US, Canada, Mexico, Germany, UK, France, Italy, Spain, The Netherlands, Saudi Arabia, UAE, Turkey, South Africa, Israel, Brazil, Argentina and Chile
Competitive landscape Leading Companies, Market Positioning of Companies, Competitive Strategies, and Industry Risks

Request Free Sample

Research Analyst Overview

  • The packaging market is undergoing a structural realignment, driven by the dual mandates of sustainability and technological advancement. Boardroom decisions are increasingly focused on Capex for robotic process automation and R&D for bio-based packaging materials.
  • The adoption of circular economy principles is no longer a peripheral concern but a core strategic driver, compelling a re-evaluation of the entire value chain, from raw material inputs to end-of-life management. We see a clear trend in the adoption of mono-material packaging and aseptic filling systems, which simplifies recycling and improves efficiency.
  • For instance, companies investing in high-barrier packaging films that are also recyclable have seen a 10% improvement in market penetration within environmentally conscious segments. The integration of tamper-evident features and supply chain traceability is now standard for high-value goods, while the development of food-grade recycled polymers and chemical recycling processes addresses key sustainability hurdles.
  • This landscape requires a multi-faceted approach, balancing innovations in dispensing closure systems, multi-layer film coextrusion, and modified atmosphere packaging with the practicalities of cold chain logistics.

What are the Key Data Covered in this Packaging Market Research and Growth Report?

  • What is the expected growth of the Packaging Market between 2026 and 2030?

    • USD 327.1 billion, at a CAGR of 4.8%

  • What segmentation does the market report cover?

    • The report is segmented by Type (Board, Rigid plastic, Flexible, Metal, and Glass), End-user (Food, Beverage, Healthcare, Personal care, and Others), Technology (Flexography, Offset, Gravure, Digital, and Screen) and Geography (APAC, North America, Europe, Middle East and Africa, South America)

  • Which regions are analyzed in the report?

    • APAC, North America, Europe, Middle East and Africa and South America

  • What are the key growth drivers and market challenges?

    • Proliferation of global e-commerce and last-mile logistics efficiency, Volatility of raw material procurement and global supply chain destabilization

  • Who are the major players in the Packaging Market?

    • Amcor Plc, AptarGroup Inc., Ball Corp., CCL Industries Inc., Constantia Flexibles GmbH, Crown Holdings Inc., DS Smith Plc, Gerresheimer AG, Graphic Packaging Holding Co., Greif Inc., Huhtamaki Oyj, International Paper Co., Mondi Plc, O I Glass Inc., Sealed Air Corp., SIG Group AG, Silgan Holdings Inc., Smurfit Westrock plc, Sonoco Products Co. and Stora Enso Oyj

Market Research Insights

  • Market dynamics are increasingly shaped by the pursuit of operational efficiency gains and supply chain resilience. The adoption of returnable packaging systems is growing, showing a 15% higher asset utilization rate compared to single-use alternatives in closed-loop systems. Meanwhile, advanced material science is enabling the development of flexible forming films that use 20% less raw material without compromising strength.
  • Custom packaging production, facilitated by digital transformation in packaging, allows for rapid response to consumer demand. These shifts underscore a move toward integrated solutions that optimize the entire packaging lifecycle assessment, from material sourcing strategies to compatibility with evolving waste management infrastructure.

We can help! Our analysts can customize this packaging market research report to meet your requirements.

Get in touch

1. Executive Summary

1.1 Market overview

Executive Summary - Chart on Market Overview
Executive Summary - Data Table on Market Overview
Executive Summary - Chart on Global Market Characteristics
Executive Summary - Chart on Market by Geography
Executive Summary - Chart on Market Segmentation by Type
Executive Summary - Chart on Market Segmentation by End-user
Executive Summary - Chart on Market Segmentation by Technology
Executive Summary - Chart on Incremental Growth
Executive Summary - Data Table on Incremental Growth
Executive Summary - Chart on Company Market Positioning

2. Technavio Analysis

2.1 Analysis of price sensitivity, lifecycle, customer purchase basket, adoption rates, and purchase criteria

2.2 Criticality of inputs and Factors of differentiation

Chart on Overview on criticality of inputs and factors of differentiation

2.3 Factors of disruption

Chart on Overview on factors of disruption

2.4 Impact of drivers and challenges

Chart on Impact of drivers and challenges in 2025 and 2030

3. Market Landscape

3.1 Market ecosystem

Chart on Parent Market
Data Table on - Parent Market

3.2 Market characteristics

Chart on Market characteristics analysis

3.3 Value chain analysis

Chart on Value chain analysis

4. Market Sizing

4.1 Market definition

Data Table on Offerings of companies included in the market definition

4.2 Market segment analysis

Market segments

4.3 Market size 2025

4.4 Market outlook: Forecast for 2025-2030

Chart on Global - Market size and forecast 2025-2030 ($ billion)
Data Table on Global - Market size and forecast 2025-2030 ($ billion)
Chart on Global Market: Year-over-year growth 2025-2030 (%)
Data Table on Global Market: Year-over-year growth 2025-2030 (%)

5. Historic Market Size

5.1 Global Packaging Market 2020 - 2024

Historic Market Size - Data Table on Global Packaging Market 2020 - 2024 ($ billion)

5.2 Type segment analysis 2020 - 2024

Historic Market Size - Type Segment 2020 - 2024 ($ billion)

5.3 End-user segment analysis 2020 - 2024

Historic Market Size - End-user Segment 2020 - 2024 ($ billion)

5.4 Technology segment analysis 2020 - 2024

Historic Market Size - Technology Segment 2020 - 2024 ($ billion)

5.5 Geography segment analysis 2020 - 2024

Historic Market Size - Geography Segment 2020 - 2024 ($ billion)

5.6 Country segment analysis 2020 - 2024

Historic Market Size - Country Segment 2020 - 2024 ($ billion)

6. Qualitative Analysis

6.1 Impact of AI on global packaging market

6.2 Impact of geopolitical conflicts on global packaging market

7. Five Forces Analysis

7.1 Five forces summary

Five forces analysis - Comparison between 2025 and 2030

7.2 Bargaining power of buyers

Bargaining power of buyers - Impact of key factors 2025 and 2030

7.3 Bargaining power of suppliers

Bargaining power of suppliers - Impact of key factors in 2025 and 2030

7.4 Threat of new entrants

Threat of new entrants - Impact of key factors in 2025 and 2030

7.5 Threat of substitutes

Threat of substitutes - Impact of key factors in 2025 and 2030

7.6 Threat of rivalry

Threat of rivalry - Impact of key factors in 2025 and 2030

7.7 Market condition

Chart on Market condition - Five forces 2025 and 2030

8. Market Segmentation by Type

8.1 Market segments

Chart on Type - Market share 2025-2030 (%)
Data Table on Type - Market share 2025-2030 (%)

8.2 Comparison by Type

Chart on Comparison by Type
Data Table on Comparison by Type

8.3 Board - Market size and forecast 2025-2030

Chart on Board - Market size and forecast 2025-2030 ($ billion)
Data Table on Board - Market size and forecast 2025-2030 ($ billion)
Chart on Board - Year-over-year growth 2025-2030 (%)
Data Table on Board - Year-over-year growth 2025-2030 (%)

8.4 Rigid plastic - Market size and forecast 2025-2030

Chart on Rigid plastic - Market size and forecast 2025-2030 ($ billion)
Data Table on Rigid plastic - Market size and forecast 2025-2030 ($ billion)
Chart on Rigid plastic - Year-over-year growth 2025-2030 (%)
Data Table on Rigid plastic - Year-over-year growth 2025-2030 (%)

8.5 Flexible - Market size and forecast 2025-2030

Chart on Flexible - Market size and forecast 2025-2030 ($ billion)
Data Table on Flexible - Market size and forecast 2025-2030 ($ billion)
Chart on Flexible - Year-over-year growth 2025-2030 (%)
Data Table on Flexible - Year-over-year growth 2025-2030 (%)

8.6 Metal - Market size and forecast 2025-2030

Chart on Metal - Market size and forecast 2025-2030 ($ billion)
Data Table on Metal - Market size and forecast 2025-2030 ($ billion)
Chart on Metal - Year-over-year growth 2025-2030 (%)
Data Table on Metal - Year-over-year growth 2025-2030 (%)

8.7 Glass - Market size and forecast 2025-2030

Chart on Glass - Market size and forecast 2025-2030 ($ billion)
Data Table on Glass - Market size and forecast 2025-2030 ($ billion)
Chart on Glass - Year-over-year growth 2025-2030 (%)
Data Table on Glass - Year-over-year growth 2025-2030 (%)

8.8 Market opportunity by Type

Market opportunity by Type ($ billion)
Data Table on Market opportunity by Type ($ billion)

9. Market Segmentation by End-user

9.1 Market segments

Chart on End-user - Market share 2025-2030 (%)
Data Table on End-user - Market share 2025-2030 (%)

9.2 Comparison by End-user

Chart on Comparison by End-user
Data Table on Comparison by End-user

9.3 Food - Market size and forecast 2025-2030

Chart on Food - Market size and forecast 2025-2030 ($ billion)
Data Table on Food - Market size and forecast 2025-2030 ($ billion)
Chart on Food - Year-over-year growth 2025-2030 (%)
Data Table on Food - Year-over-year growth 2025-2030 (%)

9.4 Beverage - Market size and forecast 2025-2030

Chart on Beverage - Market size and forecast 2025-2030 ($ billion)
Data Table on Beverage - Market size and forecast 2025-2030 ($ billion)
Chart on Beverage - Year-over-year growth 2025-2030 (%)
Data Table on Beverage - Year-over-year growth 2025-2030 (%)

9.5 Healthcare - Market size and forecast 2025-2030

Chart on Healthcare - Market size and forecast 2025-2030 ($ billion)
Data Table on Healthcare - Market size and forecast 2025-2030 ($ billion)
Chart on Healthcare - Year-over-year growth 2025-2030 (%)
Data Table on Healthcare - Year-over-year growth 2025-2030 (%)

9.6 Personal care - Market size and forecast 2025-2030

Chart on Personal care - Market size and forecast 2025-2030 ($ billion)
Data Table on Personal care - Market size and forecast 2025-2030 ($ billion)
Chart on Personal care - Year-over-year growth 2025-2030 (%)
Data Table on Personal care - Year-over-year growth 2025-2030 (%)

9.7 Others - Market size and forecast 2025-2030

Chart on Others - Market size and forecast 2025-2030 ($ billion)
Data Table on Others - Market size and forecast 2025-2030 ($ billion)
Chart on Others - Year-over-year growth 2025-2030 (%)
Data Table on Others - Year-over-year growth 2025-2030 (%)

9.8 Market opportunity by End-user

Market opportunity by End-user ($ billion)
Data Table on Market opportunity by End-user ($ billion)

10. Market Segmentation by Technology

10.1 Market segments

Chart on Technology - Market share 2025-2030 (%)
Data Table on Technology - Market share 2025-2030 (%)

10.2 Comparison by Technology

Chart on Comparison by Technology
Data Table on Comparison by Technology

10.3 Flexography - Market size and forecast 2025-2030

Chart on Flexography - Market size and forecast 2025-2030 ($ billion)
Data Table on Flexography - Market size and forecast 2025-2030 ($ billion)
Chart on Flexography - Year-over-year growth 2025-2030 (%)
Data Table on Flexography - Year-over-year growth 2025-2030 (%)

10.4 Offset - Market size and forecast 2025-2030

Chart on Offset - Market size and forecast 2025-2030 ($ billion)
Data Table on Offset - Market size and forecast 2025-2030 ($ billion)
Chart on Offset - Year-over-year growth 2025-2030 (%)
Data Table on Offset - Year-over-year growth 2025-2030 (%)

10.5 Gravure - Market size and forecast 2025-2030

Chart on Gravure - Market size and forecast 2025-2030 ($ billion)
Data Table on Gravure - Market size and forecast 2025-2030 ($ billion)
Chart on Gravure - Year-over-year growth 2025-2030 (%)
Data Table on Gravure - Year-over-year growth 2025-2030 (%)

10.6 Digital - Market size and forecast 2025-2030

Chart on Digital - Market size and forecast 2025-2030 ($ billion)
Data Table on Digital - Market size and forecast 2025-2030 ($ billion)
Chart on Digital - Year-over-year growth 2025-2030 (%)
Data Table on Digital - Year-over-year growth 2025-2030 (%)

10.7 Screen - Market size and forecast 2025-2030

Chart on Screen - Market size and forecast 2025-2030 ($ billion)
Data Table on Screen - Market size and forecast 2025-2030 ($ billion)
Chart on Screen - Year-over-year growth 2025-2030 (%)
Data Table on Screen - Year-over-year growth 2025-2030 (%)

10.8 Market opportunity by Technology

Market opportunity by Technology ($ billion)
Data Table on Market opportunity by Technology ($ billion)

11. Customer Landscape

11.1 Customer landscape overview

Analysis of price sensitivity, lifecycle, customer purchase basket, adoption rates, and purchase criteria

12. Geographic Landscape

12.1 Geographic segmentation

Chart on Market share by geography 2025-2030 (%)
Data Table on Market share by geography 2025-2030 (%)

12.2 Geographic comparison

Chart on Geographic comparison
Data Table on Geographic comparison

12.3 APAC - Market size and forecast 2025-2030

Chart on APAC - Market size and forecast 2025-2030 ($ billion)
Data Table on APAC - Market size and forecast 2025-2030 ($ billion)
Chart on APAC - Year-over-year growth 2025-2030 (%)
Data Table on APAC - Year-over-year growth 2025-2030 (%)
Chart on Regional Comparison - APAC
Data Table on Regional Comparison - APAC

12.3.1 China - Market size and forecast 2025-2030

Chart on China - Market size and forecast 2025-2030 ($ billion)
Data Table on China - Market size and forecast 2025-2030 ($ billion)
Chart on China - Year-over-year growth 2025-2030 (%)
Data Table on China - Year-over-year growth 2025-2030 (%)

12.3.2 Japan - Market size and forecast 2025-2030

Chart on Japan - Market size and forecast 2025-2030 ($ billion)
Data Table on Japan - Market size and forecast 2025-2030 ($ billion)
Chart on Japan - Year-over-year growth 2025-2030 (%)
Data Table on Japan - Year-over-year growth 2025-2030 (%)

12.3.3 India - Market size and forecast 2025-2030

Chart on India - Market size and forecast 2025-2030 ($ billion)
Data Table on India - Market size and forecast 2025-2030 ($ billion)
Chart on India - Year-over-year growth 2025-2030 (%)
Data Table on India - Year-over-year growth 2025-2030 (%)

12.3.4 South Korea - Market size and forecast 2025-2030

Chart on South Korea - Market size and forecast 2025-2030 ($ billion)
Data Table on South Korea - Market size and forecast 2025-2030 ($ billion)
Chart on South Korea - Year-over-year growth 2025-2030 (%)
Data Table on South Korea - Year-over-year growth 2025-2030 (%)

12.3.5 Australia - Market size and forecast 2025-2030

Chart on Australia - Market size and forecast 2025-2030 ($ billion)
Data Table on Australia - Market size and forecast 2025-2030 ($ billion)
Chart on Australia - Year-over-year growth 2025-2030 (%)
Data Table on Australia - Year-over-year growth 2025-2030 (%)

12.3.6 Indonesia - Market size and forecast 2025-2030

Chart on Indonesia - Market size and forecast 2025-2030 ($ billion)
Data Table on Indonesia - Market size and forecast 2025-2030 ($ billion)
Chart on Indonesia - Year-over-year growth 2025-2030 (%)
Data Table on Indonesia - Year-over-year growth 2025-2030 (%)

12.4 North America - Market size and forecast 2025-2030

Chart on North America - Market size and forecast 2025-2030 ($ billion)
Data Table on North America - Market size and forecast 2025-2030 ($ billion)
Chart on North America - Year-over-year growth 2025-2030 (%)
Data Table on North America - Year-over-year growth 2025-2030 (%)
Chart on Regional Comparison - North America
Data Table on Regional Comparison - North America

12.4.1 US - Market size and forecast 2025-2030

Chart on US - Market size and forecast 2025-2030 ($ billion)
Data Table on US - Market size and forecast 2025-2030 ($ billion)
Chart on US - Year-over-year growth 2025-2030 (%)
Data Table on US - Year-over-year growth 2025-2030 (%)

12.4.2 Canada - Market size and forecast 2025-2030

Chart on Canada - Market size and forecast 2025-2030 ($ billion)
Data Table on Canada - Market size and forecast 2025-2030 ($ billion)
Chart on Canada - Year-over-year growth 2025-2030 (%)
Data Table on Canada - Year-over-year growth 2025-2030 (%)

12.4.3 Mexico - Market size and forecast 2025-2030

Chart on Mexico - Market size and forecast 2025-2030 ($ billion)
Data Table on Mexico - Market size and forecast 2025-2030 ($ billion)
Chart on Mexico - Year-over-year growth 2025-2030 (%)
Data Table on Mexico - Year-over-year growth 2025-2030 (%)

12.5 Europe - Market size and forecast 2025-2030

Chart on Europe - Market size and forecast 2025-2030 ($ billion)
Data Table on Europe - Market size and forecast 2025-2030 ($ billion)
Chart on Europe - Year-over-year growth 2025-2030 (%)
Data Table on Europe - Year-over-year growth 2025-2030 (%)
Chart on Regional Comparison - Europe
Data Table on Regional Comparison - Europe

12.5.1 Germany - Market size and forecast 2025-2030

Chart on Germany - Market size and forecast 2025-2030 ($ billion)
Data Table on Germany - Market size and forecast 2025-2030 ($ billion)
Chart on Germany - Year-over-year growth 2025-2030 (%)
Data Table on Germany - Year-over-year growth 2025-2030 (%)

12.5.2 UK - Market size and forecast 2025-2030

Chart on UK - Market size and forecast 2025-2030 ($ billion)
Data Table on UK - Market size and forecast 2025-2030 ($ billion)
Chart on UK - Year-over-year growth 2025-2030 (%)
Data Table on UK - Year-over-year growth 2025-2030 (%)

12.5.3 France - Market size and forecast 2025-2030

Chart on France - Market size and forecast 2025-2030 ($ billion)
Data Table on France - Market size and forecast 2025-2030 ($ billion)
Chart on France - Year-over-year growth 2025-2030 (%)
Data Table on France - Year-over-year growth 2025-2030 (%)

12.5.4 Italy - Market size and forecast 2025-2030

Chart on Italy - Market size and forecast 2025-2030 ($ billion)
Data Table on Italy - Market size and forecast 2025-2030 ($ billion)
Chart on Italy - Year-over-year growth 2025-2030 (%)
Data Table on Italy - Year-over-year growth 2025-2030 (%)

12.5.5 Spain - Market size and forecast 2025-2030

Chart on Spain - Market size and forecast 2025-2030 ($ billion)
Data Table on Spain - Market size and forecast 2025-2030 ($ billion)
Chart on Spain - Year-over-year growth 2025-2030 (%)
Data Table on Spain - Year-over-year growth 2025-2030 (%)

12.5.6 The Netherlands - Market size and forecast 2025-2030

Chart on The Netherlands - Market size and forecast 2025-2030 ($ billion)
Data Table on The Netherlands - Market size and forecast 2025-2030 ($ billion)
Chart on The Netherlands - Year-over-year growth 2025-2030 (%)
Data Table on The Netherlands - Year-over-year growth 2025-2030 (%)

12.6 Middle East and Africa - Market size and forecast 2025-2030

Chart on Middle East and Africa - Market size and forecast 2025-2030 ($ billion)
Data Table on Middle East and Africa - Market size and forecast 2025-2030 ($ billion)
Chart on Middle East and Africa - Year-over-year growth 2025-2030 (%)
Data Table on Middle East and Africa - Year-over-year growth 2025-2030 (%)
Chart on Regional Comparison - Middle East and Africa
Data Table on Regional Comparison - Middle East and Africa

12.6.1 Saudi Arabia - Market size and forecast 2025-2030

Chart on Saudi Arabia - Market size and forecast 2025-2030 ($ billion)
Data Table on Saudi Arabia - Market size and forecast 2025-2030 ($ billion)
Chart on Saudi Arabia - Year-over-year growth 2025-2030 (%)
Data Table on Saudi Arabia - Year-over-year growth 2025-2030 (%)

12.6.2 UAE - Market size and forecast 2025-2030

Chart on UAE - Market size and forecast 2025-2030 ($ billion)
Data Table on UAE - Market size and forecast 2025-2030 ($ billion)
Chart on UAE - Year-over-year growth 2025-2030 (%)
Data Table on UAE - Year-over-year growth 2025-2030 (%)

12.6.3 Turkey - Market size and forecast 2025-2030

Chart on Turkey - Market size and forecast 2025-2030 ($ billion)
Data Table on Turkey - Market size and forecast 2025-2030 ($ billion)
Chart on Turkey - Year-over-year growth 2025-2030 (%)
Data Table on Turkey - Year-over-year growth 2025-2030 (%)

12.6.4 South Africa - Market size and forecast 2025-2030

Chart on South Africa - Market size and forecast 2025-2030 ($ billion)
Data Table on South Africa - Market size and forecast 2025-2030 ($ billion)
Chart on South Africa - Year-over-year growth 2025-2030 (%)
Data Table on South Africa - Year-over-year growth 2025-2030 (%)

12.6.5 Israel - Market size and forecast 2025-2030

Chart on Israel - Market size and forecast 2025-2030 ($ billion)
Data Table on Israel - Market size and forecast 2025-2030 ($ billion)
Chart on Israel - Year-over-year growth 2025-2030 (%)
Data Table on Israel - Year-over-year growth 2025-2030 (%)

12.7 South America - Market size and forecast 2025-2030

Chart on South America - Market size and forecast 2025-2030 ($ billion)
Data Table on South America - Market size and forecast 2025-2030 ($ billion)
Chart on South America - Year-over-year growth 2025-2030 (%)
Data Table on South America - Year-over-year growth 2025-2030 (%)
Chart on Regional Comparison - South America
Data Table on Regional Comparison - South America

12.7.1 Brazil - Market size and forecast 2025-2030

Chart on Brazil - Market size and forecast 2025-2030 ($ billion)
Data Table on Brazil - Market size and forecast 2025-2030 ($ billion)
Chart on Brazil - Year-over-year growth 2025-2030 (%)
Data Table on Brazil - Year-over-year growth 2025-2030 (%)

12.7.2 Argentina - Market size and forecast 2025-2030

Chart on Argentina - Market size and forecast 2025-2030 ($ billion)
Data Table on Argentina - Market size and forecast 2025-2030 ($ billion)
Chart on Argentina - Year-over-year growth 2025-2030 (%)
Data Table on Argentina - Year-over-year growth 2025-2030 (%)

12.7.3 Chile - Market size and forecast 2025-2030

Chart on Chile - Market size and forecast 2025-2030 ($ billion)
Data Table on Chile - Market size and forecast 2025-2030 ($ billion)
Chart on Chile - Year-over-year growth 2025-2030 (%)
Data Table on Chile - Year-over-year growth 2025-2030 (%)

12.8 Market opportunity by geography

Market opportunity by geography ($ billion)
Data Tables on Market opportunity by geography ($ billion)

13. Drivers, Challenges, and Opportunity

13.1 Market drivers

Proliferation of global e-commerce and last-mile logistics efficiency
Transition to circular economy models
Surge in demand for consumer convenience and health-centric packaging

13.2 Market challenges

Volatility of raw material procurement and global supply chain destabilization
Complexity of navigating divergent international regulatory standards and compliance mandates
Technical limitations of integrating recycled content while maintaining structural integrity

13.3 Impact of drivers and challenges

Impact of drivers and challenges in 2025 and 2030

13.4 Market opportunities

Integration of packaging 4.0 and advanced smart monitoring systems
Rise of hyper-personalization and digital printing agility
Industrial automation and robotic optimization in packaging workflows

14. Competitive Landscape

14.1 Overview

14.2

Overview on criticality of inputs and factors of differentiation

14.3 Landscape disruption

Overview on factors of disruption

14.4 Industry risks

Impact of key risks on business

15. Competitive Analysis

15.1 Companies profiled

Companies covered

15.2 Company ranking index

15.3 Market positioning of companies

Matrix on companies position and classification

15.4 Amcor Plc

Amcor Plc - Overview
Amcor Plc - Business segments
Amcor Plc - Key offerings
Amcor Plc - Segment focus
SWOT

15.5 AptarGroup Inc.

AptarGroup Inc. - Overview
AptarGroup Inc. - Business segments
AptarGroup Inc. - Key news
AptarGroup Inc. - Key offerings
AptarGroup Inc. - Segment focus
SWOT

15.6 Ball Corp.

Ball Corp. - Overview
Ball Corp. - Business segments
Ball Corp. - Key offerings
Ball Corp. - Segment focus
SWOT

15.7 CCL Industries Inc.

CCL Industries Inc. - Overview
CCL Industries Inc. - Business segments
CCL Industries Inc. - Key offerings
CCL Industries Inc. - Segment focus
SWOT

15.8 Constantia Flexibles GmbH

Constantia Flexibles GmbH - Overview
Constantia Flexibles GmbH - Product / Service
Constantia Flexibles GmbH - Key offerings
SWOT

15.9 Crown Holdings Inc.

Crown Holdings Inc. - Overview
Crown Holdings Inc. - Business segments
Crown Holdings Inc. - Key offerings
Crown Holdings Inc. - Segment focus
SWOT

15.10 Gerresheimer AG

Gerresheimer AG - Overview
Gerresheimer AG - Business segments
Gerresheimer AG - Key offerings
Gerresheimer AG - Segment focus
SWOT

15.11 Graphic Packaging Holding Co.

Graphic Packaging Holding Co. - Overview
Graphic Packaging Holding Co. - Business segments
Graphic Packaging Holding Co. - Key offerings
Graphic Packaging Holding Co. - Segment focus
SWOT

15.12 Huhtamaki Oyj

Huhtamaki Oyj - Overview
Huhtamaki Oyj - Business segments
Huhtamaki Oyj - Key offerings
Huhtamaki Oyj - Segment focus
SWOT

15.13 International Paper Co.

International Paper Co. - Overview
International Paper Co. - Business segments
International Paper Co. - Key news
International Paper Co. - Key offerings
International Paper Co. - Segment focus
SWOT

15.14 Mondi Plc

Mondi Plc - Overview
Mondi Plc - Business segments
Mondi Plc - Key offerings
Mondi Plc - Segment focus
SWOT

15.15 Sealed Air Corp.

Sealed Air Corp. - Overview
Sealed Air Corp. - Business segments
Sealed Air Corp. - Key offerings
Sealed Air Corp. - Segment focus
SWOT

15.16 SIG Group AG

SIG Group AG - Overview
SIG Group AG - Business segments
SIG Group AG - Key offerings
SIG Group AG - Segment focus
SWOT

15.17 Silgan Holdings Inc.

Silgan Holdings Inc. - Overview
Silgan Holdings Inc. - Business segments
Silgan Holdings Inc. - Key offerings
Silgan Holdings Inc. - Segment focus
SWOT

15.18 Sonoco Products Co.

Sonoco Products Co. - Overview
Sonoco Products Co. - Business segments
Sonoco Products Co. - Key offerings
Sonoco Products Co. - Segment focus
SWOT

16. Appendix

16.1 Scope of the report

Market definition
Objectives
Notes and caveats

16.2 Inclusions and exclusions checklist

Inclusions checklist
Exclusions checklist

16.3 Currency conversion rates for US$

16.4 Research methodology

16.5 Data procurement

Information sources

16.6 Data validation

16.7 Validation techniques employed for market sizing

16.8 Data synthesis

16.9 360 degree market analysis

16.10 List of abbreviations

Research Methodology

Technavio presents a detailed picture of the market by way of study, synthesis, and summation of data from multiple sources. The analysts have presented the various facets of the market with a particular focus on identifying the key industry influencers. The data thus presented is comprehensive, reliable, and the result of extensive research, both primary and secondary.

INFORMATION SOURCES

Primary sources

  • Manufacturers and suppliers
  • Channel partners
  • Industry experts
  • Strategic decision makers

Secondary sources

  • Industry journals and periodicals
  • Government data
  • Financial reports of key industry players
  • Historical data
  • Press releases

DATA ANALYSIS

Data Synthesis

  • Collation of data
  • Estimation of key figures
  • Analysis of derived insights

Data Validation

  • Triangulation with data models
  • Reference against proprietary databases
  • Corroboration with industry experts

REPORT WRITING

Qualitative

  • Market drivers
  • Market challenges
  • Market trends
  • Five forces analysis

Quantitative

  • Market size and forecast
  • Market segmentation
  • Geographical insights
  • Competitive landscape

Interested in this report?

Get your sample now to see our research methodology and insights!

Download Now

Frequently Asked Questions

Packaging market growth will increase by USD 327.1 billion during 2026-2030.

The Packaging market is expected to grow at a CAGR of 4.8% during 2026-2030.

Packaging market is segmented by Type (Board, Rigid plastic, Flexible, Metal, Glass) End-user (Food, Beverage, Healthcare, Personal care, Others) Technology (Flexography, Offset, Gravure, Digital, Screen)

Amcor Plc, AptarGroup Inc., Ball Corp., CCL Industries Inc., Constantia Flexibles GmbH, Crown Holdings Inc., DS Smith Plc, Gerresheimer AG, Graphic Packaging Holding Co., Greif Inc., Huhtamaki Oyj, International Paper Co., Mondi Plc, O I Glass Inc., Sealed Air Corp., SIG Group AG, Silgan Holdings Inc., Smurfit Westrock plc, Sonoco Products Co., Stora Enso Oyj are a few of the key vendors in the Packaging market.

APAC will register the highest growth rate of 38.2% among the other regions. Therefore, the Packaging market in APAC is expected to garner significant business opportunities for the vendors during the forecast period.

China, Japan, India, South Korea, Australia, Indonesia, US, Canada, Mexico, Germany, UK, France, Italy, Spain, The Netherlands, Saudi Arabia, UAE, Turkey, South Africa, Israel, Brazil, Argentina, Chile

  • Proliferation of global e-commerce and last-mile logistics efficiency is the driving factor this market.

The Packaging market vendors should focus on grabbing business opportunities from the Type segment as it accounted for the largest market share in the base year.
RIA - Research AI Assistant
Ask RIA