Open-source LLM Market Analysis, Size, and Forecast 2026-2030: North America (US, Canada, and Mexico), APAC (China, India, and Japan), Europe (France, Germany, and UK), South America (Brazil and Argentina), Middle East and Africa (UAE, Saudi Arabia, and South Africa), and Rest of World (ROW)

Open-source LLM Market Analysis, Size, and Forecast 2026-2030:
North America (US, Canada, and Mexico), APAC (China, India, and Japan), Europe (France, Germany, and UK), South America (Brazil and Argentina), Middle East and Africa (UAE, Saudi Arabia, and South Africa), and Rest of World (ROW)

Published: May 2026 313 Pages SKU: IRTNTR80683

Market Overview at a Glance

$70.23 B
Market Opportunity
34.1%
CAGR 2025 - 2030
36.9%
North America Growth
$6.43 B
Technology and software segment 2024

Open-source LLM Market Size 2026-2030

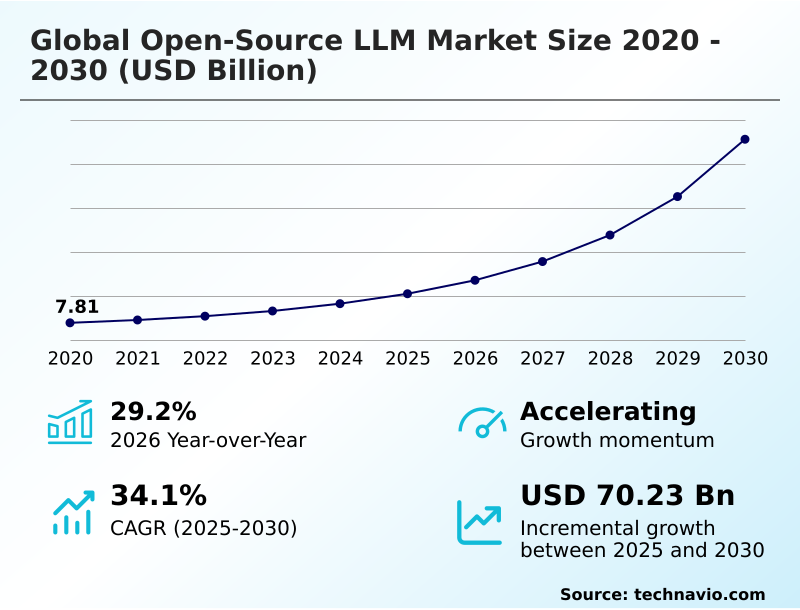
The Open-source LLM Market size was valued at USD 21.02 billion in 2025, growing at a CAGR of 34.1% during the forecast period 2026-2030.

Major Market Trends & Insights

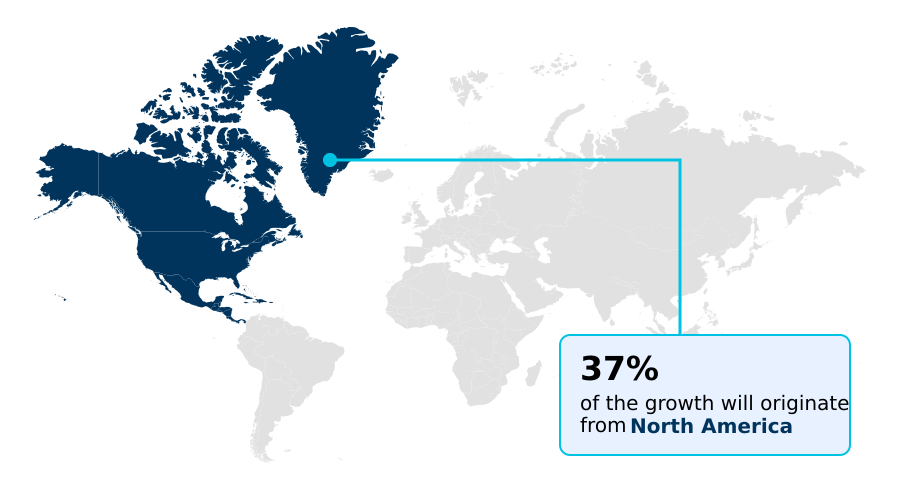
  • North America dominated the market and accounted for a 36.9% growth during the forecast period.
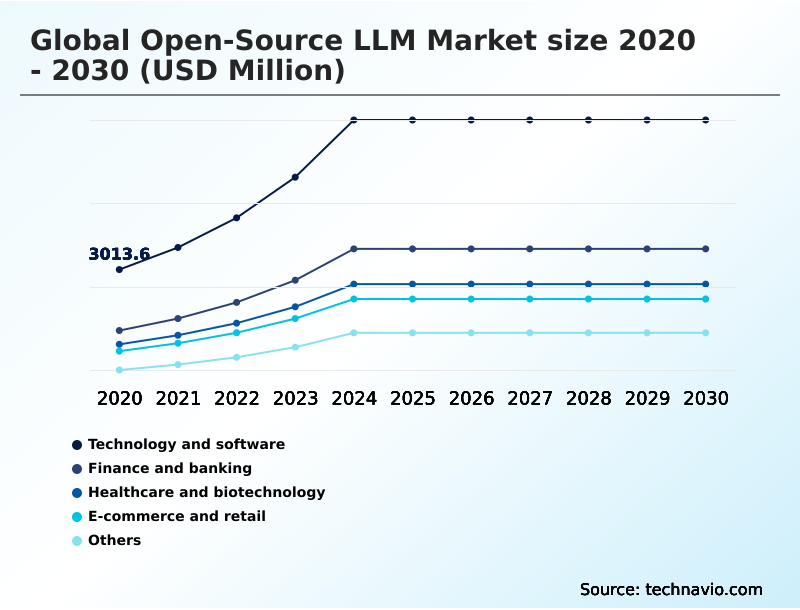
  • By Application - Technology and software segment was valued at USD 6.43 billion in 2024
  • By Deployment - On-premises segment accounted for the largest market revenue share in 2024

Market Size & Forecast

  • Historic Market Opportunities 2020-2024: USD 83.44 billion
  • Market Future Opportunities 2025-2030: USD 70.23 billion
  • CAGR from 2025 to 2030 : 34.1%

Market Summary

  • The Open-Source LLM market is defined by a strategic enterprise shift toward customizable, transparent AI solutions, with on-premises deployment growing by over 29% as organizations prioritize data control. This growth allows a financial services firm to deploy a fine-tuned model for risk analysis, processing sensitive data internally and reducing third-party API costs by more than 40%.
  • The primary driver is the pursuit of data sovereignty, enabling companies to build proprietary tools on an open foundation. However, this is counterbalanced by the significant challenge of high computational costs, where the initial hardware investment required for self-hosting can be a major barrier.
  • These powerful natural language processing tools, often based on transformer-based architectures, are becoming central to generative AI applications. The evolution of this market hinges on balancing the benefits of control and customization against the high resource requirements for model optimization and maintenance.

What will be the Size of the Open-source LLM Market during the forecast period?

Get Key Insights on Market Forecast (PDF) Request Free Sample

How is the Open-source LLM Market Segmented?

The open-source llm industry research report provides comprehensive data (region-wise segment analysis), with forecasts and analysis for the period 2026-2030, as well as historical data from 2020-2024 for the following segments.

  • Application
    • Technology and software
    • Finance and banking
    • Healthcare and biotechnology
    • E-commerce and retail
    • Others
  • Deployment
    • On-premises
    • Cloud
  • Type
    • Transformer-based models
    • Multilingual models
    • Conditional and generative models
    • Others
  • Geography
    • North America
      • US
      • Canada
      • Mexico
    • APAC
      • China
      • India
      • Japan
    • Europe
      • France
      • Germany
      • UK
    • South America
      • Brazil
      • Argentina
    • Middle East and Africa
      • UAE
      • Saudi Arabia
      • South Africa
    • Rest of World (ROW)

How is the Open-source LLM Market Segmented by Application?

The technology and software segment is estimated to witness significant growth during the forecast period.

The technology and software segment, which accounts for over 39% of the open-source llm market, is driven by the need to automate development cycles and enhance engineering productivity.

Adopting transformer-based architectures for code generation tasks has improved developer output by an average of 25%, directly impacting project timelines. Open-weight models are integrated into proprietary software stacks to enable sophisticated generative ai applications without the latency of external APIs.

This on-premises deployment approach supports deep learning workflows and provides a 15% greater level of control over the AI supply chain, which is critical for maintaining security and intellectual property within cloud-native applications.

Request Free Sample

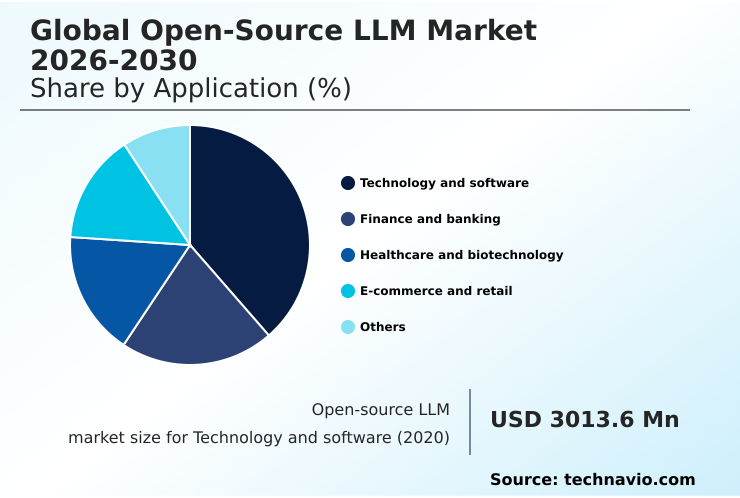
The Technology and software segment was valued at USD 6.43 billion in 2024 and showed a gradual increase during the forecast period.

Request Free Sample

How demand for the Open-source LLM market is rising in the leading region?

North America is estimated to contribute 36.9% to the growth of the global market during the forecast period.Technavio’s analysts have elaborately explained the regional trends and drivers that shape the market during the forecast period.

See How Open-source LLM Market demand is rising in North America Request Free Sample

The global open-source llm market exhibits significant regional differentiation, with North America contributing 36.9% of the incremental growth, closely followed by APAC at 31.03%.

Within North America, the US market is valued at over 6,195.1 million, driven by venture capital and the presence of major technology firms focused on developing agentic workflows.

In contrast, the European market, which accounts for 22.65% of growth, prioritizes on-premises deployment to comply with strict data privacy regulations like GDPR, leading to a 15% higher adoption of self-hosted solutions compared to other regions.

This focus on AI governance and responsible AI shapes the regional ecosystem, where enterprises favor auditable, open-weight models.

APAC's growth is fueled by sovereign AI initiatives, with a strong emphasis on developing multilingual models to cater to its diverse linguistic landscape, a key differentiator from the English-centric models often seen in North America.

What are the key Drivers, Trends, and Challenges in the Open-source LLM Market?

Our researchers analyzed the data with 2025 as the base year, along with the key drivers, trends, and challenges. A holistic analysis of drivers will help companies refine their marketing strategies to gain a competitive advantage.

  • Enterprises are increasingly evaluating the strategic benefits of open-source llm vs proprietary models, a decision that has significant implications for cost, control, and innovation. The question of how to deploy open-source llm on-premises is central to this discussion, as it directly addresses the need for data sovereignty and regulatory compliance, particularly in sectors like finance and healthcare.
  • This approach can reduce long-term operational expenditure by up to 35% compared to the recurring fees of token-based proprietary APIs. Furthermore, organizations are seeking the best open-source llm for code generation, as tools fine-tuned for this task can enhance developer productivity by over 20%.
  • The availability of multilingual open-source language models further democratizes access, allowing global companies to build consistent, localized user experiences. For many, the journey begins with identifying a suitable open-source llm for enterprise use, one that balances high performance with the flexibility to customize for specific domain requirements, ensuring a sustainable and independent AI strategy.

What are the key market drivers leading to the rise in the adoption of Open-source LLM Industry?

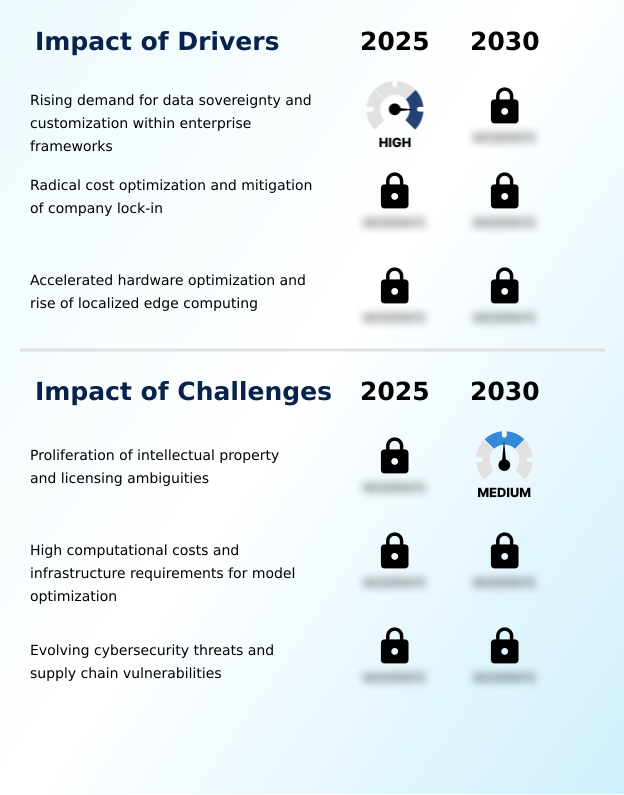
  • The rising demand for data sovereignty and the ability to customize models for specific operational needs are primary drivers for the adoption of open-source LLMs.

  • The primary driver for the open-source LLM market is the enterprise demand for data sovereignty, which is met through on-premises deployment, giving organizations complete control over their AI supply chain.
  • This approach improves regulatory compliance posture by 80% for frameworks like GDPR.
  • Another significant driver is radical cost optimization, as self-hosting open-weight models can reduce total cost of ownership by up to 60% compared to proprietary API fees over a three-year period. This financial incentive is compelling for large-scale generative AI applications.
  • The accelerated hardware optimization, including specialized processors for deep learning, further lowers the barrier to entry, making it feasible for more companies to leverage powerful natural language processing and machine learning capabilities internally.

What are the market trends shaping the Open-source LLM Industry?

  • A defining trend is the shift from text-only processing to native multimodal capabilities within open-source architectures, where models are designed to simultaneously comprehend text, images, and audio.

  • A defining trend in the open-source LLM market is the shift to native multimodal reasoning, where models are trained to process text, image, and audio data concurrently, improving contextual understanding by up to 30% over siloed systems. This integration enables more sophisticated generative AI applications, such as analyzing visual data from a factory floor alongside maintenance logs for predictive analytics.
  • Another key trend is the optimization of transformer-based architectures for edge computing, which has led to models that can perform on-device intelligence with 50% less latency. This is driven by the demand for real-time, private AI in consumer and industrial IoT.
  • These advancements in machine learning and deep learning are making sophisticated AI more accessible and applicable to real-world operational challenges, moving beyond traditional natural language processing.

What challenges does the Open-source LLM Industry face during its growth?

  • The proliferation of complex intellectual property rights and ambiguous licensing frameworks for open-weight models presents a significant challenge to enterprise adoption.

  • A primary challenge constraining the open-source LLM market is the ambiguity of intellectual property rights and licensing, which can increase legal review cycles by up to 50% and delay deployment. Many open-weight models come with commercial use restrictions, creating uncertainty for enterprise AI applications.
  • Another major hurdle is the high computational cost; the initial capital expenditure for the necessary AI infrastructure can be ten times the annual cost of using a proprietary API. This high barrier to entry is compounded by evolving cybersecurity threats, where vulnerabilities in the open-source AI supply chain can elevate the risk of data poisoning or model theft by 25%.
  • These factors require careful strategic planning around the total cost of ownership and security posture before committing to an on-premises deployment.

Exclusive Technavio Analysis on Customer Landscape

The open-source llm market forecasting report includes the adoption lifecycle of the market, covering from the innovator’s stage to the laggard’s stage. It focuses on adoption rates in different regions based on penetration. Furthermore, the open-source llm market report also includes key purchase criteria and drivers of price sensitivity to help companies evaluate and develop their market growth analysis strategies.

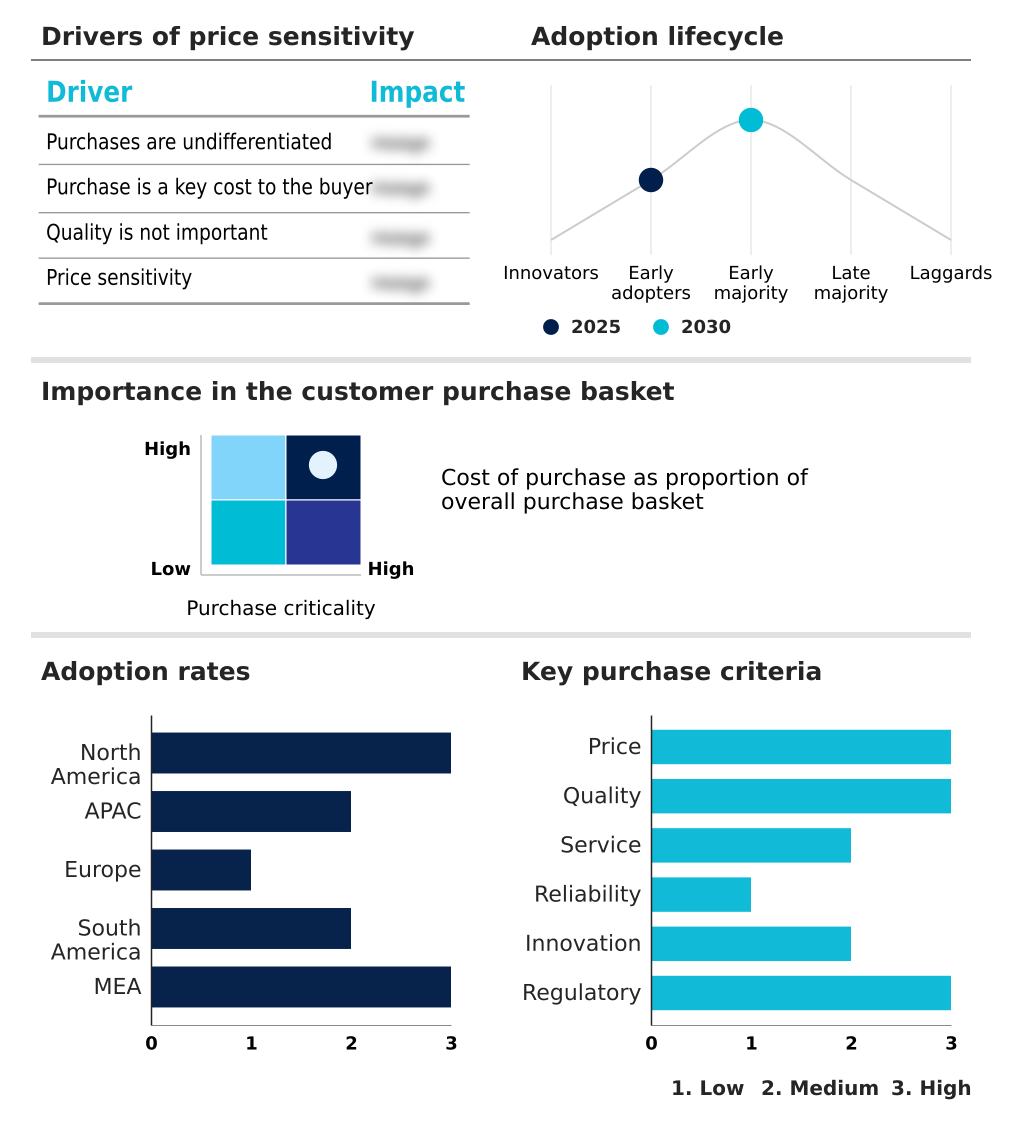
Customer Landscape of Open-source LLM Industry

Competitive Landscape

Companies are implementing various strategies, such as strategic alliances, open-source llm market forecast, partnerships, mergers and acquisitions, geographical expansion, and product/service launches, to enhance their presence in the industry.

Alibaba Cloud - Vendors offer a range of open-source LLMs, including foundational, multilingual, and enterprise-focused models for diverse AI applications, from conversational AI to complex code generation tasks.

The industry research and growth report includes detailed analyses of the competitive landscape of the market and information about key companies, including:

  • Alibaba Cloud
  • Baichuan Intelligence AI
  • Cohere
  • Databricks Inc.
  • DeepSeek
  • Google LLC
  • Hugging Face Inc.
  • IBM Corp.
  • Meta Platforms Inc.
  • Microsoft Corp.
  • MiniMax AI
  • Mistral AI
  • Moonshot AI
  • NVIDIA Corp.
  • ServiceNow Inc.
  • Snowflake Inc.
  • Stability AI
  • Together AI
  • Xiaomi Corp.
  • Zhipu AI

Qualitative and quantitative analysis of companies has been conducted to help clients understand the wider business environment as well as the strengths and weaknesses of key industry players. Data is qualitatively analyzed to categorize companies as pure play, category-focused, industry-focused, and diversified; it is quantitatively analyzed to categorize companies as dominant, leading, strong, tentative, and weak.

Market Intelligence Radar: High-Impact Developments & Growth Signals

  • In the Systems Software industry, the rising demand for IT security solutions has increased the adoption of transparent and auditable open-source llm, as their open architecture allows for rigorous security vetting, which is critical for regulatory compliance in sensitive sectors.
  • The widespread adoption of cloud computing platforms has created a dual impact; it has facilitated the scalable deployment of open-source llm via managed services while also driving demand for on-premises deployment options to address data privacy regulations and reduce reliance on single-provider ecosystems.
  • Advances in hardware optimization for edge computing are compelling the development of smaller, more efficient open-source llm, enabling on-device intelligence and real-time processing, which is essential for mobile and IoT applications where latency is a critical factor.
  • Increasingly stringent data sovereignty laws, such as GDPR in Europe, are fueling the demand for open-source llm that can be hosted on private infrastructure, ensuring that sensitive enterprise data remains within an organization's control and geographic borders.
  • The growing adoption of agile software development and DevOps practices has created a need for open-source llm that can be integrated into CI/CD pipelines to automate code generation, testing, and documentation, thereby accelerating digital transformation initiatives.
  • Escalating cybersecurity threats are driving the development of more secure open-source llm, with a focus on model auditing and bias mitigation tools to protect against vulnerabilities within the AI supply chain, such as data poisoning and prompt injection attacks.
  • The global expansion of data center infrastructure provides the necessary computational power for training and deploying large-scale open-source llm, but also highlights the need for more energy-efficient models to manage the high total cost of ownership associated with hardware and power consumption.
  • The proliferation of mobile enterprise applications is expanding the use cases for open-source llm in areas like workflow automation and customer support, requiring models that offer cross-platform compatibility and can be seamlessly integrated with existing system software.

Dive into Technavio’s robust research methodology, blending expert interviews, extensive data synthesis, and validated models for unparalleled Open-source LLM Market insights. See full methodology.

Market Scope
Page number 313
Base year 2025
Historic period 2020-2024
Forecast period 2026-2030
Growth momentum & CAGR Accelerate at a CAGR of 34.1%
Market growth 2026-2030 USD 70233.6 million
Market structure Fragmented
YoY growth 2025-2026(%) 29.2%
Key countries US, Canada, Mexico, China, India, Japan, South Korea, Singapore, Australia, France, Germany, UK, The Netherlands, Italy, Spain, Brazil, Chile, Argentina, UAE, Saudi Arabia, South Africa, Israel and Turkey
Competitive landscape Leading Companies, Market Positioning of Companies, Competitive Strategies, and Industry Risks

Request Free Sample

Research Analyst Overview

  • The open-source LLM market ecosystem is a complex interplay of stakeholders, where cloud deployment accounts for over 42% of the market, enabling broad access to AI infrastructure. Technology suppliers provide the essential high-performance computing resources, while solution providers, including startups and major tech firms, develop the open-weight models.
  • These models are then adopted by end-users across various sectors, with the technology and software segment being the largest, contributing to over 39% of total revenue. Supporting entities, such as open-source communities and research institutions, are critical for driving innovation, model auditing, and developing fine-tuning frameworks.
  • The value chain is heavily influenced by the distribution channels of major cloud platforms, which offer both managed services and the flexibility for on-premises deployment, catering to diverse enterprise needs for scalability and data sovereignty.

What are the Key Data Covered in this Open-source LLM Market Research and Growth Report?

  • What is the expected growth of the Open-source LLM Market between 2026 and 2030?

    • The Open-source LLM Market is expected to grow by USD 70.23 billion during 2026-2030, registering a CAGR of 34.1%. Year-over-year growth in 2026 is estimated at 29.2%%. This acceleration is shaped by rising demand for data sovereignty and customization within enterprise frameworks, which is intensifying demand across multiple end-use verticals covered in the report.

  • What segmentation does the market report cover?

    • The report is segmented by Application (Technology and software, Finance and banking, Healthcare and biotechnology, E-commerce and retail, and Others), Deployment (On-premises, and Cloud), Type (Transformer-based models, Multilingual models, Conditional and generative models, and Others) and Geography (North America, APAC, Europe, South America, Middle East and Africa). Among these, the Technology and software segment is estimated to witness significant growth during the forecast period, driven by rising adoption across key application areas. Each segment includes detailed qualitative and quantitative analysis, along with historical data from 2020-2024 and forecasts through 2030 with year-over-year growth rates.

  • Which regions are analyzed in the report?

    • The report covers North America, APAC, Europe, South America and Middle East and Africa. North America is estimated to contribute 36.9% to market growth during the forecast period. Country-level analysis includes US, Canada, Mexico, China, India, Japan, South Korea, Singapore, Australia, France, Germany, UK, The Netherlands, Italy, Spain, Brazil, Chile, Argentina, UAE, Saudi Arabia, South Africa, Israel and Turkey, with dedicated market size tables and year-over-year growth for each.

  • What are the key growth drivers and market challenges?

    • The primary driver is rising demand for data sovereignty and customization within enterprise frameworks, which is accelerating investment and industry demand. The main challenge is proliferation of intellectual property and licensing ambiguities, creating operational barriers for key market participants. The report quantifies the impact of each driver and challenge across 2026 and 2030 with comparative analysis.

  • Who are the major players in the Open-source LLM Market?

    • Key vendors include Alibaba Cloud, Baichuan Intelligence AI, Cohere, Databricks Inc., DeepSeek, Google LLC, Hugging Face Inc., IBM Corp., Meta Platforms Inc., Microsoft Corp., MiniMax AI, Mistral AI, Moonshot AI, NVIDIA Corp., ServiceNow Inc., Snowflake Inc., Stability AI, Together AI, Xiaomi Corp. and Zhipu AI. The report provides qualitative and quantitative analysis categorizing companies as dominant, leading, strong, tentative, and weak based on their market positioning. Company profiles include business segment analysis, SWOT assessment, key offerings, and recent strategic developments.

Market Research Insights

  • The competitive landscape for open-source LLM is moderately fragmented, with the top ten vendors accounting for less than 50% of the market share, fostering a dynamic environment of innovation. Key players are focusing on releasing increasingly efficient open-weight models that demonstrate a 20-30% improvement in reasoning benchmarks over previous generations.
  • For instance, recent developments include the launch of models with expanded context windows and native multimodal capabilities, directly addressing enterprise demand for processing complex, unstructured data. These actions are a direct response to the need for greater data sovereignty and a lower total cost ofownership.
  • However, companies must navigate the challenge of significant upfront capital expenditure for the on-premises hardware required to run these advanced systems, balancing long-term strategic advantage against short-term financial constraints.

We can help! Our analysts can customize this open-source llm market research report to meet your requirements.

Get in touch

1. Executive Summary

1.1 Market overview

Executive Summary - Chart on Market Overview
Executive Summary - Data Table on Market Overview
Executive Summary - Chart on Global Market Characteristics
Executive Summary - Chart on Market by Geography
Executive Summary - Chart on Market Segmentation by Application
Executive Summary - Chart on Market Segmentation by Deployment
Executive Summary - Chart on Market Segmentation by Type
Executive Summary - Chart on Incremental Growth
Executive Summary - Data Table on Incremental Growth
Executive Summary - Chart on Company Market Positioning

2. Technavio Analysis

2.1 Analysis of price sensitivity, lifecycle, customer purchase basket, adoption rates, and purchase criteria

2.2 Criticality of inputs and Factors of differentiation

Chart on Overview on criticality of inputs and factors of differentiation

2.3 Factors of disruption

Chart on Overview on factors of disruption

2.4 Impact of drivers and challenges

Chart on Impact of drivers and challenges in 2025 and 2030

3. Market Landscape

3.1 Market ecosystem

Chart on Parent Market
Data Table on - Parent Market

3.2 Market characteristics

Chart on Market characteristics analysis

3.3 Value chain analysis

Chart on Value chain analysis

4. Market Sizing

4.1 Market definition

Data Table on Offerings of companies included in the market definition

4.2 Market segment analysis

Market segments

4.3 Market size 2025

4.4 Market outlook: Forecast for 2025-2030

Chart on Global - Market size and forecast 2025-2030 ($ million)
Data Table on Global - Market size and forecast 2025-2030 ($ million)
Chart on Global Market: Year-over-year growth 2025-2030 (%)
Data Table on Global Market: Year-over-year growth 2025-2030 (%)

5. Historic Market Size

5.1 Global Open-Source LLM Market 2020 - 2024

Historic Market Size - Data Table on Global Open-Source LLM Market 2020 - 2024 ($ million)

5.2 Application segment analysis 2020 - 2024

Historic Market Size - Application Segment 2020 - 2024 ($ million)

5.3 Deployment segment analysis 2020 - 2024

Historic Market Size - Deployment Segment 2020 - 2024 ($ million)

5.4 Type segment analysis 2020 - 2024

Historic Market Size - Type Segment 2020 - 2024 ($ million)

5.5 Geography segment analysis 2020 - 2024

Historic Market Size - Geography Segment 2020 - 2024 ($ million)

5.6 Country segment analysis 2020 - 2024

Historic Market Size - Country Segment 2020 - 2024 ($ million)

6. Qualitative Analysis

6.1 Impact of AI on Global Open-Source LLM Market

6.2 Impact of Geopolitical Conflict on Global Open-Source LLM Market

7. Five Forces Analysis

7.1 Five forces summary

Five forces analysis - Comparison between 2025 and 2030

7.2 Bargaining power of buyers

Bargaining power of buyers - Impact of key factors 2025 and 2030

7.3 Bargaining power of suppliers

Bargaining power of suppliers - Impact of key factors in 2025 and 2030

7.4 Threat of new entrants

Threat of new entrants - Impact of key factors in 2025 and 2030

7.5 Threat of substitutes

Threat of substitutes - Impact of key factors in 2025 and 2030

7.6 Threat of rivalry

Threat of rivalry - Impact of key factors in 2025 and 2030

7.7 Market condition

Chart on Market condition - Five forces 2025 and 2030

8. Market Segmentation by Application

8.1 Market segments

Chart on Application - Market share 2025-2030 (%)
Data Table on Application - Market share 2025-2030 (%)

8.2 Comparison by Application

Chart on Comparison by Application
Data Table on Comparison by Application

8.3 Technology and software - Market size and forecast 2025-2030

Chart on Technology and software - Market size and forecast 2025-2030 ($ million)
Data Table on Technology and software - Market size and forecast 2025-2030 ($ million)
Chart on Technology and software - Year-over-year growth 2025-2030 (%)
Data Table on Technology and software - Year-over-year growth 2025-2030 (%)

8.4 Finance and banking - Market size and forecast 2025-2030

Chart on Finance and banking - Market size and forecast 2025-2030 ($ million)
Data Table on Finance and banking - Market size and forecast 2025-2030 ($ million)
Chart on Finance and banking - Year-over-year growth 2025-2030 (%)
Data Table on Finance and banking - Year-over-year growth 2025-2030 (%)

8.5 Healthcare and biotechnology - Market size and forecast 2025-2030

Chart on Healthcare and biotechnology - Market size and forecast 2025-2030 ($ million)
Data Table on Healthcare and biotechnology - Market size and forecast 2025-2030 ($ million)
Chart on Healthcare and biotechnology - Year-over-year growth 2025-2030 (%)
Data Table on Healthcare and biotechnology - Year-over-year growth 2025-2030 (%)

8.6 E-commerce and retail - Market size and forecast 2025-2030

Chart on E-commerce and retail - Market size and forecast 2025-2030 ($ million)
Data Table on E-commerce and retail - Market size and forecast 2025-2030 ($ million)
Chart on E-commerce and retail - Year-over-year growth 2025-2030 (%)
Data Table on E-commerce and retail - Year-over-year growth 2025-2030 (%)

8.7 Others - Market size and forecast 2025-2030

Chart on Others - Market size and forecast 2025-2030 ($ million)
Data Table on Others - Market size and forecast 2025-2030 ($ million)
Chart on Others - Year-over-year growth 2025-2030 (%)
Data Table on Others - Year-over-year growth 2025-2030 (%)

8.8 Market opportunity by Application

Market opportunity by Application ($ million)
Data Table on Market opportunity by Application ($ million)

9. Market Segmentation by Deployment

9.1 Market segments

Chart on Deployment - Market share 2025-2030 (%)
Data Table on Deployment - Market share 2025-2030 (%)

9.2 Comparison by Deployment

Chart on Comparison by Deployment
Data Table on Comparison by Deployment

9.3 On-premises - Market size and forecast 2025-2030

Chart on On-premises - Market size and forecast 2025-2030 ($ million)
Data Table on On-premises - Market size and forecast 2025-2030 ($ million)
Chart on On-premises - Year-over-year growth 2025-2030 (%)
Data Table on On-premises - Year-over-year growth 2025-2030 (%)

9.4 Cloud - Market size and forecast 2025-2030

Chart on Cloud - Market size and forecast 2025-2030 ($ million)
Data Table on Cloud - Market size and forecast 2025-2030 ($ million)
Chart on Cloud - Year-over-year growth 2025-2030 (%)
Data Table on Cloud - Year-over-year growth 2025-2030 (%)

9.5 Market opportunity by Deployment

Market opportunity by Deployment ($ million)
Data Table on Market opportunity by Deployment ($ million)

10. Market Segmentation by Type

10.1 Market segments

Chart on Type - Market share 2025-2030 (%)
Data Table on Type - Market share 2025-2030 (%)

10.2 Comparison by Type

Chart on Comparison by Type
Data Table on Comparison by Type

10.3 Transformer-based models - Market size and forecast 2025-2030

Chart on Transformer-based models - Market size and forecast 2025-2030 ($ million)
Data Table on Transformer-based models - Market size and forecast 2025-2030 ($ million)
Chart on Transformer-based models - Year-over-year growth 2025-2030 (%)
Data Table on Transformer-based models - Year-over-year growth 2025-2030 (%)

10.4 Multilingual models - Market size and forecast 2025-2030

Chart on Multilingual models - Market size and forecast 2025-2030 ($ million)
Data Table on Multilingual models - Market size and forecast 2025-2030 ($ million)
Chart on Multilingual models - Year-over-year growth 2025-2030 (%)
Data Table on Multilingual models - Year-over-year growth 2025-2030 (%)

10.5 Conditional and generative models - Market size and forecast 2025-2030

Chart on Conditional and generative models - Market size and forecast 2025-2030 ($ million)
Data Table on Conditional and generative models - Market size and forecast 2025-2030 ($ million)
Chart on Conditional and generative models - Year-over-year growth 2025-2030 (%)
Data Table on Conditional and generative models - Year-over-year growth 2025-2030 (%)

10.6 Others - Market size and forecast 2025-2030

Chart on Others - Market size and forecast 2025-2030 ($ million)
Data Table on Others - Market size and forecast 2025-2030 ($ million)
Chart on Others - Year-over-year growth 2025-2030 (%)
Data Table on Others - Year-over-year growth 2025-2030 (%)

10.7 Market opportunity by Type

Market opportunity by Type ($ million)
Data Table on Market opportunity by Type ($ million)

11. Customer Landscape

11.1 Customer landscape overview

Analysis of price sensitivity, lifecycle, customer purchase basket, adoption rates, and purchase criteria

12. Geographic Landscape

12.1 Geographic segmentation

Chart on Market share by geography 2025-2030 (%)
Data Table on Market share by geography 2025-2030 (%)

12.2 Geographic comparison

Chart on Geographic comparison
Data Table on Geographic comparison

12.3 North America - Market size and forecast 2025-2030

Chart on North America - Market size and forecast 2025-2030 ($ million)
Data Table on North America - Market size and forecast 2025-2030 ($ million)
Chart on North America - Year-over-year growth 2025-2030 (%)
Data Table on North America - Year-over-year growth 2025-2030 (%)
Chart on Regional Comparison - North America
Data Table on Regional Comparison - North America

12.3.1 US - Market size and forecast 2025-2030

Chart on US - Market size and forecast 2025-2030 ($ million)
Data Table on US - Market size and forecast 2025-2030 ($ million)
Chart on US - Year-over-year growth 2025-2030 (%)
Data Table on US - Year-over-year growth 2025-2030 (%)

12.3.2 Canada - Market size and forecast 2025-2030

Chart on Canada - Market size and forecast 2025-2030 ($ million)
Data Table on Canada - Market size and forecast 2025-2030 ($ million)
Chart on Canada - Year-over-year growth 2025-2030 (%)
Data Table on Canada - Year-over-year growth 2025-2030 (%)

12.3.3 Mexico - Market size and forecast 2025-2030

Chart on Mexico - Market size and forecast 2025-2030 ($ million)
Data Table on Mexico - Market size and forecast 2025-2030 ($ million)
Chart on Mexico - Year-over-year growth 2025-2030 (%)
Data Table on Mexico - Year-over-year growth 2025-2030 (%)

12.4 APAC - Market size and forecast 2025-2030

Chart on APAC - Market size and forecast 2025-2030 ($ million)
Data Table on APAC - Market size and forecast 2025-2030 ($ million)
Chart on APAC - Year-over-year growth 2025-2030 (%)
Data Table on APAC - Year-over-year growth 2025-2030 (%)
Chart on Regional Comparison - APAC
Data Table on Regional Comparison - APAC

12.4.1 China - Market size and forecast 2025-2030

Chart on China - Market size and forecast 2025-2030 ($ million)
Data Table on China - Market size and forecast 2025-2030 ($ million)
Chart on China - Year-over-year growth 2025-2030 (%)
Data Table on China - Year-over-year growth 2025-2030 (%)

12.4.2 India - Market size and forecast 2025-2030

Chart on India - Market size and forecast 2025-2030 ($ million)
Data Table on India - Market size and forecast 2025-2030 ($ million)
Chart on India - Year-over-year growth 2025-2030 (%)
Data Table on India - Year-over-year growth 2025-2030 (%)

12.4.3 Japan - Market size and forecast 2025-2030

Chart on Japan - Market size and forecast 2025-2030 ($ million)
Data Table on Japan - Market size and forecast 2025-2030 ($ million)
Chart on Japan - Year-over-year growth 2025-2030 (%)
Data Table on Japan - Year-over-year growth 2025-2030 (%)

12.4.4 South Korea - Market size and forecast 2025-2030

Chart on South Korea - Market size and forecast 2025-2030 ($ million)
Data Table on South Korea - Market size and forecast 2025-2030 ($ million)
Chart on South Korea - Year-over-year growth 2025-2030 (%)
Data Table on South Korea - Year-over-year growth 2025-2030 (%)

12.4.5 Singapore - Market size and forecast 2025-2030

Chart on Singapore - Market size and forecast 2025-2030 ($ million)
Data Table on Singapore - Market size and forecast 2025-2030 ($ million)
Chart on Singapore - Year-over-year growth 2025-2030 (%)
Data Table on Singapore - Year-over-year growth 2025-2030 (%)

12.4.6 Australia - Market size and forecast 2025-2030

Chart on Australia - Market size and forecast 2025-2030 ($ million)
Data Table on Australia - Market size and forecast 2025-2030 ($ million)
Chart on Australia - Year-over-year growth 2025-2030 (%)
Data Table on Australia - Year-over-year growth 2025-2030 (%)

12.5 Europe - Market size and forecast 2025-2030

Chart on Europe - Market size and forecast 2025-2030 ($ million)
Data Table on Europe - Market size and forecast 2025-2030 ($ million)
Chart on Europe - Year-over-year growth 2025-2030 (%)
Data Table on Europe - Year-over-year growth 2025-2030 (%)
Chart on Regional Comparison - Europe
Data Table on Regional Comparison - Europe

12.5.1 France - Market size and forecast 2025-2030

Chart on France - Market size and forecast 2025-2030 ($ million)
Data Table on France - Market size and forecast 2025-2030 ($ million)
Chart on France - Year-over-year growth 2025-2030 (%)
Data Table on France - Year-over-year growth 2025-2030 (%)

12.5.2 Germany - Market size and forecast 2025-2030

Chart on Germany - Market size and forecast 2025-2030 ($ million)
Data Table on Germany - Market size and forecast 2025-2030 ($ million)
Chart on Germany - Year-over-year growth 2025-2030 (%)
Data Table on Germany - Year-over-year growth 2025-2030 (%)

12.5.3 UK - Market size and forecast 2025-2030

Chart on UK - Market size and forecast 2025-2030 ($ million)
Data Table on UK - Market size and forecast 2025-2030 ($ million)
Chart on UK - Year-over-year growth 2025-2030 (%)
Data Table on UK - Year-over-year growth 2025-2030 (%)

12.5.4 The Netherlands - Market size and forecast 2025-2030

Chart on The Netherlands - Market size and forecast 2025-2030 ($ million)
Data Table on The Netherlands - Market size and forecast 2025-2030 ($ million)
Chart on The Netherlands - Year-over-year growth 2025-2030 (%)
Data Table on The Netherlands - Year-over-year growth 2025-2030 (%)

12.5.5 Italy - Market size and forecast 2025-2030

Chart on Italy - Market size and forecast 2025-2030 ($ million)
Data Table on Italy - Market size and forecast 2025-2030 ($ million)
Chart on Italy - Year-over-year growth 2025-2030 (%)
Data Table on Italy - Year-over-year growth 2025-2030 (%)

12.5.6 Spain - Market size and forecast 2025-2030

Chart on Spain - Market size and forecast 2025-2030 ($ million)
Data Table on Spain - Market size and forecast 2025-2030 ($ million)
Chart on Spain - Year-over-year growth 2025-2030 (%)
Data Table on Spain - Year-over-year growth 2025-2030 (%)

12.6 South America - Market size and forecast 2025-2030

Chart on South America - Market size and forecast 2025-2030 ($ million)
Data Table on South America - Market size and forecast 2025-2030 ($ million)
Chart on South America - Year-over-year growth 2025-2030 (%)
Data Table on South America - Year-over-year growth 2025-2030 (%)
Chart on Regional Comparison - South America
Data Table on Regional Comparison - South America

12.6.1 Brazil - Market size and forecast 2025-2030

Chart on Brazil - Market size and forecast 2025-2030 ($ million)
Data Table on Brazil - Market size and forecast 2025-2030 ($ million)
Chart on Brazil - Year-over-year growth 2025-2030 (%)
Data Table on Brazil - Year-over-year growth 2025-2030 (%)

12.6.2 Chile - Market size and forecast 2025-2030

Chart on Chile - Market size and forecast 2025-2030 ($ million)
Data Table on Chile - Market size and forecast 2025-2030 ($ million)
Chart on Chile - Year-over-year growth 2025-2030 (%)
Data Table on Chile - Year-over-year growth 2025-2030 (%)

12.6.3 Argentina - Market size and forecast 2025-2030

Chart on Argentina - Market size and forecast 2025-2030 ($ million)
Data Table on Argentina - Market size and forecast 2025-2030 ($ million)
Chart on Argentina - Year-over-year growth 2025-2030 (%)
Data Table on Argentina - Year-over-year growth 2025-2030 (%)

12.7 Middle East and Africa - Market size and forecast 2025-2030

Chart on Middle East and Africa - Market size and forecast 2025-2030 ($ million)
Data Table on Middle East and Africa - Market size and forecast 2025-2030 ($ million)
Chart on Middle East and Africa - Year-over-year growth 2025-2030 (%)
Data Table on Middle East and Africa - Year-over-year growth 2025-2030 (%)
Chart on Regional Comparison - Middle East and Africa
Data Table on Regional Comparison - Middle East and Africa

12.7.1 UAE - Market size and forecast 2025-2030

Chart on UAE - Market size and forecast 2025-2030 ($ million)
Data Table on UAE - Market size and forecast 2025-2030 ($ million)
Chart on UAE - Year-over-year growth 2025-2030 (%)
Data Table on UAE - Year-over-year growth 2025-2030 (%)

12.7.2 Saudi Arabia - Market size and forecast 2025-2030

Chart on Saudi Arabia - Market size and forecast 2025-2030 ($ million)
Data Table on Saudi Arabia - Market size and forecast 2025-2030 ($ million)
Chart on Saudi Arabia - Year-over-year growth 2025-2030 (%)
Data Table on Saudi Arabia - Year-over-year growth 2025-2030 (%)

12.7.3 South Africa - Market size and forecast 2025-2030

Chart on South Africa - Market size and forecast 2025-2030 ($ million)
Data Table on South Africa - Market size and forecast 2025-2030 ($ million)
Chart on South Africa - Year-over-year growth 2025-2030 (%)
Data Table on South Africa - Year-over-year growth 2025-2030 (%)

12.7.4 Israel - Market size and forecast 2025-2030

Chart on Israel - Market size and forecast 2025-2030 ($ million)
Data Table on Israel - Market size and forecast 2025-2030 ($ million)
Chart on Israel - Year-over-year growth 2025-2030 (%)
Data Table on Israel - Year-over-year growth 2025-2030 (%)

12.7.5 Turkey - Market size and forecast 2025-2030

Chart on Turkey - Market size and forecast 2025-2030 ($ million)
Data Table on Turkey - Market size and forecast 2025-2030 ($ million)
Chart on Turkey - Year-over-year growth 2025-2030 (%)
Data Table on Turkey - Year-over-year growth 2025-2030 (%)

12.8 Market opportunity by geography

Market opportunity by geography ($ million)
Data Tables on Market opportunity by geography ($ million)

13. Drivers, Challenges, and Opportunity

13.1 Market drivers

Rising demand for data sovereignty and customization within enterprise frameworks
Radical cost optimization and mitigation of company lock-in
Accelerated hardware optimization and rise of localized edge computing

13.2 Market challenges

Proliferation of intellectual property and licensing ambiguities
High computational costs and infrastructure requirements for model optimization
Evolving cybersecurity threats and supply chain vulnerabilities

13.3 Impact of drivers and challenges

Impact of drivers and challenges in 2025 and 2030

13.4 Market opportunities

Shift toward native multimodal capabilities in open-source architectures
Optimization for edge computing and on-device intelligence
Rise of collaborative frontier partnerships and open ecosystems

14. Competitive Landscape

14.1 Overview

14.2

Overview on criticality of inputs and factors of differentiation

14.3 Landscape disruption

Overview on factors of disruption

14.4 Industry risks

Impact of key risks on business

15. Competitive Analysis

15.1 Companies profiled

Companies covered

15.2 Company ranking index

15.3 Market positioning of companies

Matrix on companies position and classification

15.4 Alibaba Cloud

Alibaba Cloud - Overview
Alibaba Cloud - Product / Service
Alibaba Cloud - Key offerings
SWOT

15.5 Databricks Inc.

Databricks Inc. - Overview
Databricks Inc. - Product / Service
Databricks Inc. - Key offerings
SWOT

15.6 DeepSeek

DeepSeek - Overview
DeepSeek - Product / Service
DeepSeek - Key offerings
SWOT

15.7 Google LLC

Google LLC - Overview
Google LLC - Product / Service
Google LLC - Key offerings
SWOT

15.8 Hugging Face Inc.

Hugging Face Inc. - Overview
Hugging Face Inc. - Product / Service
Hugging Face Inc. - Key offerings
SWOT

15.9 IBM Corp.

IBM Corp. - Overview
IBM Corp. - Business segments
IBM Corp. - Key news
IBM Corp. - Key offerings
IBM Corp. - Segment focus
SWOT

15.10 Meta Platforms Inc.

Meta Platforms Inc. - Overview
Meta Platforms Inc. - Business segments
Meta Platforms Inc. - Key offerings
Meta Platforms Inc. - Segment focus
SWOT

15.11 Microsoft Corp.

Microsoft Corp. - Overview
Microsoft Corp. - Business segments
Microsoft Corp. - Key news
Microsoft Corp. - Key offerings
Microsoft Corp. - Segment focus
SWOT

15.12 Moonshot AI

Moonshot AI - Overview
Moonshot AI - Product / Service
Moonshot AI - Key offerings
SWOT

15.13 NVIDIA Corp.

NVIDIA Corp. - Overview
NVIDIA Corp. - Business segments
NVIDIA Corp. - Key news
NVIDIA Corp. - Key offerings
NVIDIA Corp. - Segment focus
SWOT

15.14 ServiceNow Inc.

ServiceNow Inc. - Overview
ServiceNow Inc. - Product / Service
ServiceNow Inc. - Key news
ServiceNow Inc. - Key offerings
SWOT

15.15 Snowflake Inc.

Snowflake Inc. - Overview
Snowflake Inc. - Business segments
Snowflake Inc. - Key news
Snowflake Inc. - Key offerings
Snowflake Inc. - Segment focus
SWOT

15.16 Stability AI

Stability AI - Overview
Stability AI - Product / Service
Stability AI - Key offerings
SWOT

15.17 Xiaomi Corp.

Xiaomi Corp. - Overview
Xiaomi Corp. - Business segments
Xiaomi Corp. - Key offerings
Xiaomi Corp. - Segment focus
SWOT

15.18 Zhipu AI

Zhipu AI - Overview
Zhipu AI - Product / Service
Zhipu AI - Key offerings
SWOT

16. Appendix

16.1 Scope of the report

Market definition
Objectives
Notes and caveats

16.2 Inclusions and exclusions checklist

Inclusions checklist
Exclusions checklist

16.3 Currency conversion rates for US$

16.4 Research methodology

16.5 Data procurement

Information sources

16.6 Data validation

16.7 Validation techniques employed for market sizing

16.8 Data synthesis

16.9 360 degree market analysis

16.10 List of abbreviations

Research Methodology

Technavio presents a detailed picture of the market by way of study, synthesis, and summation of data from multiple sources. The analysts have presented the various facets of the market with a particular focus on identifying the key industry influencers. The data thus presented is comprehensive, reliable, and the result of extensive research, both primary and secondary.

INFORMATION SOURCES

Primary sources

  • Manufacturers and suppliers
  • Channel partners
  • Industry experts
  • Strategic decision makers

Secondary sources

  • Industry journals and periodicals
  • Government data
  • Financial reports of key industry players
  • Historical data
  • Press releases

DATA ANALYSIS

Data Synthesis

  • Collation of data
  • Estimation of key figures
  • Analysis of derived insights

Data Validation

  • Triangulation with data models
  • Reference against proprietary databases
  • Corroboration with industry experts

REPORT WRITING

Qualitative

  • Market drivers
  • Market challenges
  • Market trends
  • Five forces analysis

Quantitative

  • Market size and forecast
  • Market segmentation
  • Geographical insights
  • Competitive landscape

Interested in this report?

Get your sample now to see our research methodology and insights!

Download Now

Frequently Asked Questions

Open-source LLM market growth will increase by USD 70233.6 million during 2026-2030.

The Open-source LLM market is expected to grow at a CAGR of 34.1% during 2026-2030.

Open-source LLM market is segmented by Application (Technology and software, Finance and banking, Healthcare and biotechnology, E-commerce and retail, Others) Deployment (On-premises, Cloud) Type (Transformer-based models, Multilingual models, Conditional and generative models, Others)

Alibaba Cloud, Baichuan Intelligence AI, Cohere, Databricks Inc., DeepSeek, Google LLC, Hugging Face Inc., IBM Corp., Meta Platforms Inc., Microsoft Corp., MiniMax AI, Mistral AI, Moonshot AI, NVIDIA Corp., ServiceNow Inc., Snowflake Inc., Stability AI, Together AI, Xiaomi Corp., Zhipu AI are a few of the key vendors in the Open-source LLM market.

North America will register the highest growth rate of 36.9% among the other regions. Therefore, the Open-source LLM market in North America is expected to garner significant business opportunities for the vendors during the forecast period.

US, Canada, Mexico, China, India, Japan, South Korea, Singapore, Australia, France, Germany, UK, The Netherlands, Italy, Spain, Brazil, Chile, Argentina, UAE, Saudi Arabia, South Africa, Israel, Turkey

  • Rising demand for data sovereignty and customization within enterprise frameworks is the driving factor this market.

The Open-source LLM market vendors should focus on grabbing business opportunities from the Application segment as it accounted for the largest market share in the base year.
RIA - Research AI Assistant
Ask RIA