Online Baby Products Retailing Market Analysis, Size, and Forecast 2026-2030: APAC (China, Japan, and India), North America (US, Canada, and Mexico), Europe (Germany, UK, and France), Middle East and Africa (Saudi Arabia, UAE, and South Africa), South America (Brazil and Argentina), and Rest of World (ROW)

Online Baby Products Retailing Market Analysis, Size, and Forecast 2026-2030:
APAC (China, Japan, and India), North America (US, Canada, and Mexico), Europe (Germany, UK, and France), Middle East and Africa (Saudi Arabia, UAE, and South Africa), South America (Brazil and Argentina), and Rest of World (ROW)

Published: May 2026 302 Pages SKU: IRTNTR44817

Market Overview at a Glance

$30.6 B
Market Opportunity
13.5%
CAGR 2025 - 2030
35%
APAC Growth
$23.9 B
Mobile segment 2024

Online Baby Products Retailing Market Size 2026-2030

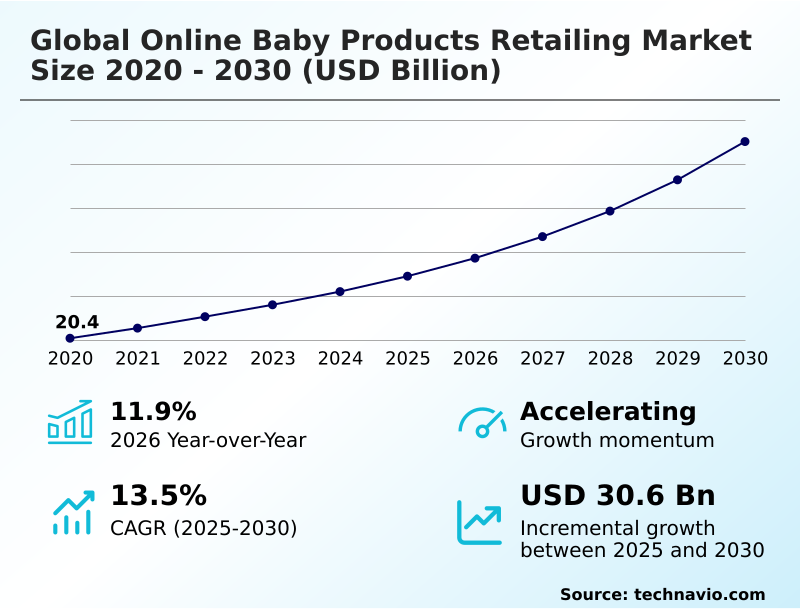
The Online Baby Products Retailing Market size was valued at USD 34.5 billion in 2025, growing at a CAGR of 13.5% during the forecast period 2026-2030.

Major Market Trends & Insights

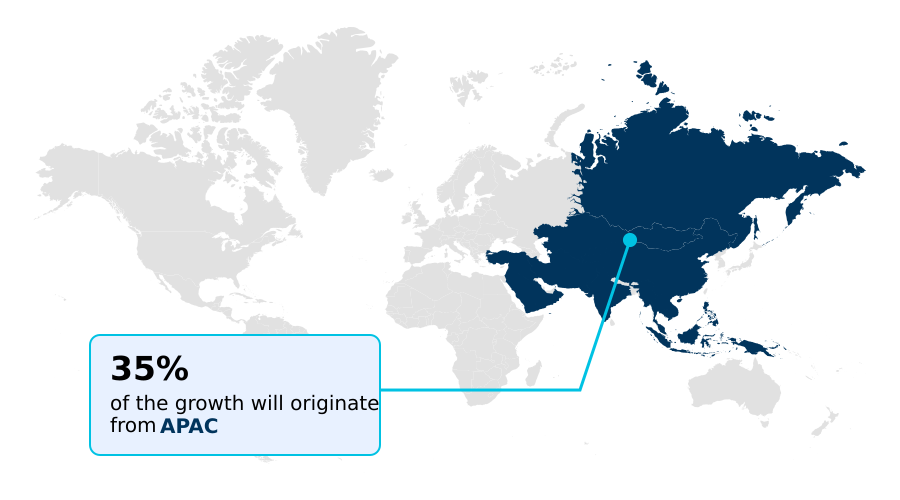
  • APAC dominated the market and accounted for a 35% growth during the forecast period.
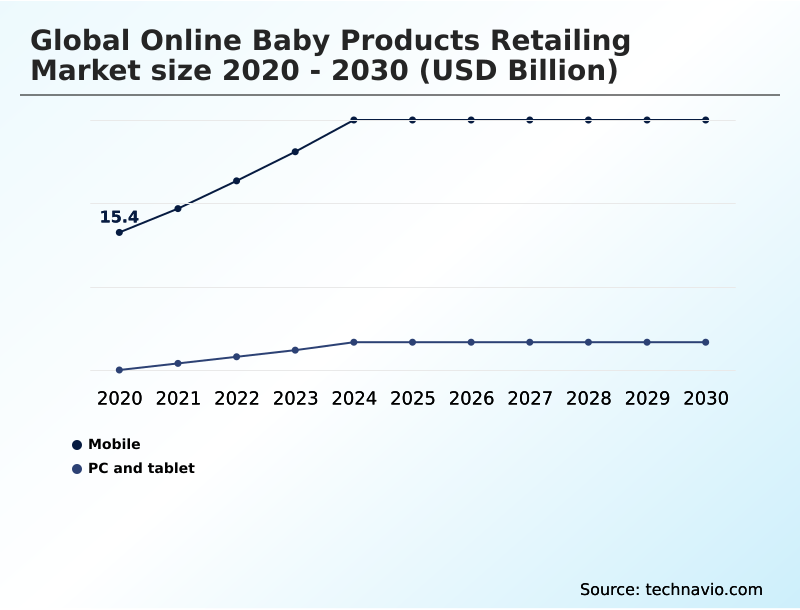
  • By Platform - Mobile segment was valued at USD 23.9 billion in 2024
  • By Product - Baby toys segment accounted for the largest market revenue share in 2024

Market Size & Forecast

  • Historic Market Opportunities 2020-2024: USD 44.7 billion
  • Market Future Opportunities 2025-2030: USD 30.6 billion
  • CAGR from 2025 to 2030 : 13.5%

Market Summary

  • The online baby products retailing market is defined by a consistent shift toward mobile-first purchasing, with app-centric transactions now accounting for over 55% of total sales. This digital transition is driven by the increasing need for convenience among dual-income households, who leverage subscription-based models for essentials like diapers, reducing recurring purchase friction by an average of 40%.
  • A typical operational scenario involves a retailer using predictive analytics to manage a subscription service, automatically adjusting delivery schedules based on a child's age and historical consumption data to minimize stock-outs. However, the market faces the significant challenge of the lack of a touch-and-feel experience.
  • This limitation is a primary cause for higher return rates in categories like baby apparel, which can be up to 25% greater than for non-sized items, forcing companies to invest in more detailed virtual sizing guides and flexible return logistics.

What will be the Size of the Online Baby Products Retailing Market during the forecast period?

Get Key Insights on Market Forecast (PDF) Request Free Sample

How is the Online Baby Products Retailing Market Segmented?

The online baby products retailing industry research report provides comprehensive data (region-wise segment analysis), with forecasts and analysis for the period 2026-2030, as well as historical data from 2020-2024 for the following segments.

  • Platform
    • Mobile
    • PC and tablet
  • Product
    • Baby toys
    • Baby gear
    • Baby apparel
    • Baby diaper products
    • Others
  • Distribution channel
    • E commerce platforms
    • Brand websites
    • Online retail chains
    • Others
  • Geography
    • APAC
      • China
      • Japan
      • India
    • North America
      • US
      • Canada
      • Mexico
    • Europe
      • Germany
      • UK
      • France
    • Middle East and Africa
      • Saudi Arabia
      • UAE
      • South Africa
    • South America
      • Brazil
      • Argentina
    • Rest of World (ROW)

How is the Online Baby Products Retailing Market Segmented by Platform?

The mobile segment is estimated to witness significant growth during the forecast period.

The mobile segment, accounting for over 70% of traffic to online baby product retail sites, is driven by the immediacy required by modern caregivers.

App-centric shopping experiences that integrate social commerce features have solidified the dominance of handheld devices, with mobile-driven transactions representing more than 55% of total sales.

This platform's growth is sustained by subscription-based models for consumables, which are easily managed through notifications.

Retailers are investing in augmented reality features, which improve conversion rates for nursery furniture by 20% compared to static images, transforming mobile platforms into comprehensive parenting resources that leverage peer-to-peer reviews and influencer marketing for growth.

Request Free Sample

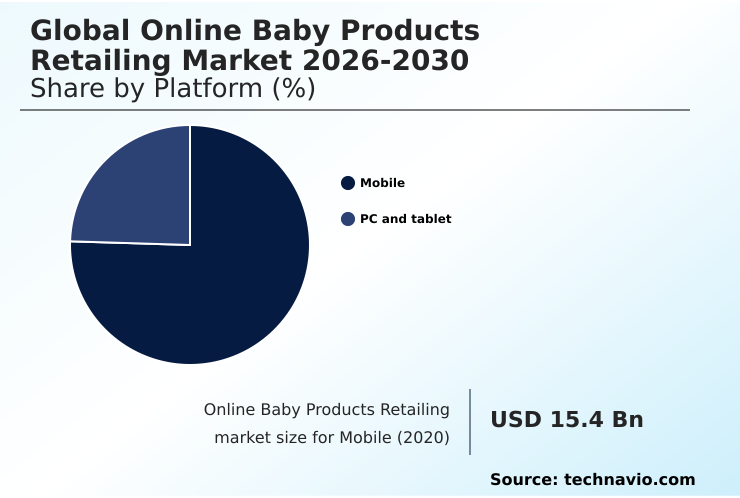
The Mobile segment was valued at USD 23.9 billion in 2024 and showed a gradual increase during the forecast period.

Request Free Sample

How demand for the Online Baby Products Retailing market is rising in the leading region?

APAC is estimated to contribute 35% to the growth of the global market during the forecast period.Technavio’s analysts have elaborately explained the regional trends and drivers that shape the market during the forecast period.

See How Online Baby Products Retailing Market demand is rising in APAC Request Free Sample

Geographic dynamics in the online baby products retailing market are defined by a notable disparity in regional maturity and consumer behavior, with APAC contributing nearly 35% of market growth, compared to North America's 26%.

This dominance is propelled by countries like China and Japan, which together represent a significant share of digital commerce innovation, including advanced smart nursery technology.

Consumer behavior in APAC is characterized by a mobile-first approach, with social commerce and influencer marketing driving over 40% of discovery for new baby brands.

In contrast, the North American market exhibits a higher adoption rate of subscription-based models for consumables, which account for approximately 30% of sales in the diaper category.

These regional differences necessitate tailored go-to-market strategies, from optimizing for quick commerce delivery in dense Asian metropolises to building trust through peer-to-peer reviews on North American platforms.

What are the key Drivers, Trends, and Challenges in the Online Baby Products Retailing Market?

Our researchers analyzed the data with 2025 as the base year, along with the key drivers, trends, and challenges. A holistic analysis of drivers will help companies refine their marketing strategies to gain a competitive advantage.

  • Parents navigating the online baby products retailing market are increasingly using highly specific search queries to find exactly what they need, with platforms that cater to this granularity seeing a 20% higher conversion rate.
  • Consumers looking for the best organic baby skin care products are not just searching for a brand but for validated, clean-label items with transparent ingredient lists and peer-to-peer reviews.
  • Similarly, searches for the safest convertible car seats for toddlers indicate a high-intent buyer focused on safety certifications and long-term value, a segment where detailed video demonstrations can increase purchase confidence by 30%. Understanding how to choose a baby stroller involves comparing features like weight, foldability, and travel system compatibility, information best presented through dynamic, comparable formats.
  • The demand for eco-friendly disposable diaper subscriptions reflects a growing market segment prioritizing sustainability, where retailers offering biodegradable options see higher customer loyalty. Finally, explaining online baby registry benefits requires highlighting features like completion discounts and universal wish lists, which can drive significant incremental revenue.
  • The ability of a retailer to effectively answer these long-tail questions is a critical differentiator, turning a transactional sale into a trusted advisory relationship.

What are the key market drivers leading to the rise in the adoption of Online Baby Products Retailing Industry?

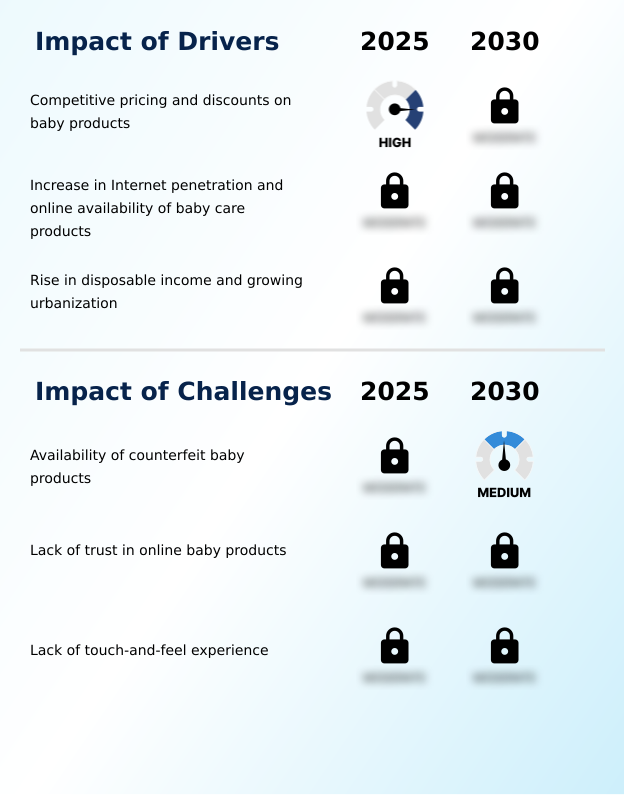
  • Competitive pricing strategies and consistent promotional discounts serve as a primary driver accelerating the expansion of the online baby products retailing market.

  • The primary driver fueling growth in the online baby products retailing market is the competitive pricing and promotional activity inherent to digital platforms, where prices are often 10-15% lower than in traditional stores.
  • This affordability is amplified by dynamic pricing algorithms that adjust to consumer demand, making premium brands more accessible.
  • A second major driver is the continuous expansion of internet penetration, particularly in developing regions, where a 20% increase in connectivity correlates with a 12% rise in online baby product sales.
  • This improved access, combined with the convenience of subscription-based models and quick commerce delivery for essentials, directly caters to the needs of time-constrained, dual-income households.
  • The rise in disposable income further enables parents to prioritize high-quality, specialized products available through these expanding digital channels.

What are the market trends shaping the Online Baby Products Retailing Industry?

  • The integration of digital and physical touchpoints is a defining trend, as omnichannel retailing reshapes fulfillment systems and customer engagement models across the industry.

  • The evolution of the online baby products retailing market is defined by the integration of omnichannel retailing strategies, which have been shown to increase customer retention by over 25% compared to single-channel approaches. This trend connects digital discovery with physical fulfillment options like click-and-collect services, addressing the parental need for both convenience and tactile product evaluation.
  • Another significant development is the advancement in eco-friendly packaging, with brands adopting biodegradable materials reporting a 15% improvement in consumer sentiment metrics.
  • The growing influence of social media has also transformed purchasing behavior; platforms that embed user-generated content and influencer marketing campaigns see higher engagement and conversion rates, as peer-to-peer reviews are now a critical component of the decision-making process for modern caregivers.

What challenges does the Online Baby Products Retailing Industry face during its growth?

  • The proliferation of counterfeit goods, which exploit the anonymity of online marketplaces, poses a severe challenge to market integrity and consumer trust in the online baby products retailing market.

  • A significant challenge restraining the online baby products retailing market is the pervasive lack of consumer trust, often stemming from the availability of counterfeit products, which can erode brand loyalty and reduce repeat purchase rates by up to 30%. This issue is compounded by the inability of consumers to physically inspect items before purchase.
  • This 'touch-and-feel' gap is a primary reason why categories like baby apparel experience return rates up to 25% higher than non-sized durable goods. The resulting purchase hesitation, especially for high-value baby gear and smart nursery technology, leads to prolonged decision-making cycles and higher cart abandonment rates.
  • Overcoming this requires significant investment in building trust through transparent peer-to-peer reviews, verified sourcing, and seamless return policies.

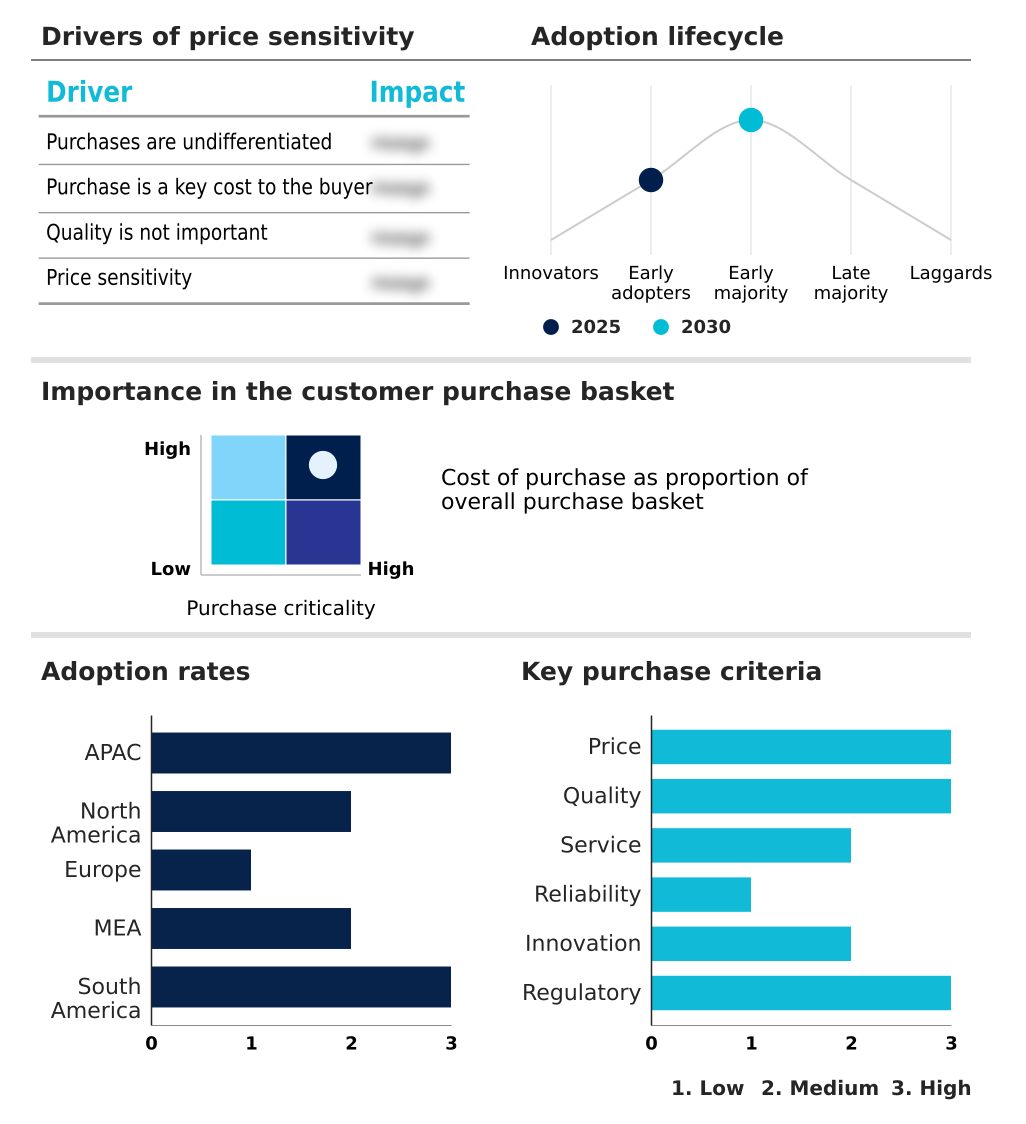
Exclusive Technavio Analysis on Customer Landscape

The online baby products retailing market forecasting report includes the adoption lifecycle of the market, covering from the innovator’s stage to the laggard’s stage. It focuses on adoption rates in different regions based on penetration. Furthermore, the online baby products retailing market report also includes key purchase criteria and drivers of price sensitivity to help companies evaluate and develop their market growth analysis strategies.

Customer Landscape of Online Baby Products Retailing Industry

Competitive Landscape

Companies are implementing various strategies, such as strategic alliances, online baby products retailing market forecast, partnerships, mergers and acquisitions, geographical expansion, and product/service launches, to enhance their presence in the industry.

Alibaba Group Holding Ltd. - Facilitates the online retailing of infant care essentials, diapers, and other baby products through its expansive e-commerce marketplace platforms.

The industry research and growth report includes detailed analyses of the competitive landscape of the market and information about key companies, including:

  • Alibaba Group Holding Ltd.
  • Amazon.com Inc.
  • Argos Ltd.
  • Baby Earth
  • Babydash Sdn Bhd
  • Babyshop Group
  • Best Buy Co. Inc.
  • Beyond Inc.
  • BrainBees Solutions Ltd.
  • Crate and Barrel
  • eBay Inc.
  • Grupo Bebecar SA
  • J Born
  • Mumzworld
  • Next GmbH
  • Rakuten Group Inc.
  • Saks Fifth Avenue
  • Takealot Online Pty Ltd.

Qualitative and quantitative analysis of companies has been conducted to help clients understand the wider business environment as well as the strengths and weaknesses of key industry players. Data is qualitatively analyzed to categorize companies as pure play, category-focused, industry-focused, and diversified; it is quantitatively analyzed to categorize companies as dominant, leading, strong, tentative, and weak.

Market Intelligence Radar: High-Impact Developments & Growth Signals

  • In the Broadline Retail industry, the widespread adoption of AI-driven dynamic pricing algorithms and personalized recommendation engines has enabled retailers to optimize inventory and pricing strategies, directly impacting the online baby products retailing market by creating more competitive price points for consumers and improving margin management for vendors of items like certified pre-owned gear.
  • The strategic expansion of quick commerce delivery and localized fulfillment hubs is reshaping logistics, enabling delivery times of under 30 minutes for essential goods. This directly benefits the online baby products retailing market by meeting urgent parental needs for items like diapers and formula, with platforms offering rapid delivery seeing a 25% higher customer retention rate for subscription-based models.
  • Increasingly stringent data privacy regulations, such as GDPR and CCPA, are forcing changes in how customer data is managed and utilized for targeted advertising. This shift directly affects the online baby products retailing market by requiring more transparent data handling and consent management, impacting the effectiveness of personalized marketing campaigns and influencer marketing efforts.
  • A significant push toward sustainability and circular economy models is evident, with major retailers implementing take-back programs and promoting second-hand marketplaces. This development influences the online baby products retailing market by elevating the demand for eco-friendly packaging and creating new revenue streams through the sale of certified pre-owned gear, a segment growing by over 15% annually.

Dive into Technavio’s robust research methodology, blending expert interviews, extensive data synthesis, and validated models for unparalleled Online Baby Products Retailing Market insights. See full methodology.

Market Scope
Page number 302
Base year 2025
Historic period 2020-2024
Forecast period 2026-2030
Growth momentum & CAGR Accelerate at a CAGR of 13.5%
Market growth 2026-2030 USD 30.6 billion
Market structure Fragmented
YoY growth 2025-2026(%) 11.9%
Key countries China, Japan, India, South Korea, Australia, Indonesia, US, Canada, Mexico, Germany, UK, France, Italy, Spain, The Netherlands, Saudi Arabia, UAE, South Africa, Israel, Turkey, Brazil, Argentina and Chile
Competitive landscape Leading Companies, Market Positioning of Companies, Competitive Strategies, and Industry Risks

Request Free Sample

Research Analyst Overview

  • The online baby products retailing market ecosystem is a complex network where manufacturers of sustainable materials, technology providers for e-commerce platforms, and regulatory bodies interact to meet end-user demands. The mobile platform segment accounts for over 70% of all traffic, underscoring the critical role of app-centric and social commerce integrations in the value chain.
  • Logistics providers enabling quick commerce delivery and last-mile fulfillment are crucial supporting entities, directly impacting customer satisfaction. The value chain is heavily influenced by digital stakeholders, including influencer marketing platforms and providers of augmented reality try-on tools, which help bridge the gap between digital browsing and physical product experience.
  • This ecosystem is increasingly shaped by consumer demand for transparency, with certified pre-owned gear platforms emerging as a key component of the circular economy, extending product lifecycles and offering a 30-40% cost savings to parents.

What are the Key Data Covered in this Online Baby Products Retailing Market Research and Growth Report?

  • What is the expected growth of the Online Baby Products Retailing Market between 2026 and 2030?

    • The Online Baby Products Retailing Market is expected to grow by USD 30.6 billion during 2026-2030, registering a CAGR of 13.5%. Year-over-year growth in 2026 is estimated at 11.9%%. This acceleration is shaped by competitive pricing and discounts on baby products, which is intensifying demand across multiple end-use verticals covered in the report.

  • What segmentation does the market report cover?

    • The report is segmented by Platform (Mobile, and PC and tablet), Product (Baby toys, Baby gear, Baby apparel, Baby diaper products, and Others), Distribution Channel (E commerce platforms, Brand websites, Online retail chains, and Others) and Geography (APAC, North America, Europe, Middle East and Africa, South America). Among these, the Mobile segment is estimated to witness significant growth during the forecast period, driven by rising adoption across key application areas. Each segment includes detailed qualitative and quantitative analysis, along with historical data from 2020-2024 and forecasts through 2030 with year-over-year growth rates.

  • Which regions are analyzed in the report?

    • The report covers APAC, North America, Europe, Middle East and Africa and South America. APAC is estimated to contribute 35% to market growth during the forecast period. Country-level analysis includes China, Japan, India, South Korea, Australia, Indonesia, US, Canada, Mexico, Germany, UK, France, Italy, Spain, The Netherlands, Saudi Arabia, UAE, South Africa, Israel, Turkey, Brazil, Argentina and Chile, with dedicated market size tables and year-over-year growth for each.

  • What are the key growth drivers and market challenges?

    • The primary driver is competitive pricing and discounts on baby products, which is accelerating investment and industry demand. The main challenge is availability of counterfeit baby products, creating operational barriers for key market participants. The report quantifies the impact of each driver and challenge across 2026 and 2030 with comparative analysis.

  • Who are the major players in the Online Baby Products Retailing Market?

    • Key vendors include Alibaba Group Holding Ltd., Amazon.com Inc., Argos Ltd., Baby Earth, Babydash Sdn Bhd, Babyshop Group, Best Buy Co. Inc., Beyond Inc., BrainBees Solutions Ltd., Crate and Barrel, eBay Inc., Grupo Bebecar SA, J Born, Mumzworld, Next GmbH, Rakuten Group Inc., Saks Fifth Avenue and Takealot Online Pty Ltd.. The report provides qualitative and quantitative analysis categorizing companies as dominant, leading, strong, tentative, and weak based on their market positioning. Company profiles include business segment analysis, SWOT assessment, key offerings, and recent strategic developments.

Market Research Insights

  • The competitive landscape of the online baby products retailing market is increasingly shaped by technological innovation, with the APAC region accounting for over 35% of the incremental growth. Key vendors like Amazon.com Inc. and Alibaba Group Holding Ltd. are leveraging their vast logistical frameworks to dominate the market.
  • For instance, Amazon's recent integration of generative AI tools to provide personalized nursery design recommendations aims to enhance the high-value consumer decision process. Simultaneously, Alibaba has expanded its dedicated logistics network to accelerate cross-border delivery of premium infant formula, reducing shipping times by up to 30% for certain routes.
  • These strategic moves reflect a broader industry trend toward using proprietary technology to address consumer demands for speed, personalization, and trust. Companies are adapting to challenges like supply chain resilience by diversifying their supplier base and investing in localized fulfillment centers.

We can help! Our analysts can customize this online baby products retailing market research report to meet your requirements.

Get in touch

1. Executive Summary

1.1 Market overview

Executive Summary - Chart on Market Overview
Executive Summary - Data Table on Market Overview
Executive Summary - Chart on Global Market Characteristics
Executive Summary - Chart on Market by Geography
Executive Summary - Chart on Market Segmentation by Platform
Executive Summary - Chart on Market Segmentation by Product
Executive Summary - Chart on Market Segmentation by Distribution Channel
Executive Summary - Chart on Incremental Growth
Executive Summary - Data Table on Incremental Growth
Executive Summary - Chart on Company Market Positioning

2. Technavio Analysis

2.1 Analysis of price sensitivity, lifecycle, customer purchase basket, adoption rates, and purchase criteria

2.2 Criticality of inputs and Factors of differentiation

Chart on Overview on criticality of inputs and factors of differentiation

2.3 Factors of disruption

Chart on Overview on factors of disruption

2.4 Impact of drivers and challenges

Chart on Impact of drivers and challenges in 2025 and 2030

3. Market Landscape

3.1 Market ecosystem

Chart on Parent Market
Data Table on - Parent Market

3.2 Market characteristics

Chart on Market characteristics analysis

3.3 Value chain analysis

Chart on Value chain analysis

4. Market Sizing

4.1 Market definition

Data Table on Offerings of companies included in the market definition

4.2 Market segment analysis

Market segments

4.3 Market size 2025

4.4 Market outlook: Forecast for 2025-2030

Chart on Global - Market size and forecast 2025-2030 ($ billion)
Data Table on Global - Market size and forecast 2025-2030 ($ billion)
Chart on Global Market: Year-over-year growth 2025-2030 (%)
Data Table on Global Market: Year-over-year growth 2025-2030 (%)

5. Historic Market Size

5.1 Global Online Baby Products Retailing Market 2020 - 2024

Historic Market Size - Data Table on Global Online Baby Products Retailing Market 2020 - 2024 ($ billion)

5.2 Platform segment analysis 2020 - 2024

Historic Market Size - Platform Segment 2020 - 2024 ($ billion)

5.3 Product segment analysis 2020 - 2024

Historic Market Size - Product Segment 2020 - 2024 ($ billion)

5.4 Distribution Channel segment analysis 2020 - 2024

Historic Market Size - Distribution Channel Segment 2020 - 2024 ($ billion)

5.5 Geography segment analysis 2020 - 2024

Historic Market Size - Geography Segment 2020 - 2024 ($ billion)

5.6 Country segment analysis 2020 - 2024

Historic Market Size - Country Segment 2020 - 2024 ($ billion)

6. Qualitative Analysis

6.1 The AI impact on Global Online Baby Products Retailing Market

7. Five Forces Analysis

7.1 Five forces summary

Five forces analysis - Comparison between 2025 and 2030

7.2 Bargaining power of buyers

Bargaining power of buyers - Impact of key factors 2025 and 2030

7.3 Bargaining power of suppliers

Bargaining power of suppliers - Impact of key factors in 2025 and 2030

7.4 Threat of new entrants

Threat of new entrants - Impact of key factors in 2025 and 2030

7.5 Threat of substitutes

Threat of substitutes - Impact of key factors in 2025 and 2030

7.6 Threat of rivalry

Threat of rivalry - Impact of key factors in 2025 and 2030

7.7 Market condition

Chart on Market condition - Five forces 2025 and 2030

8. Market Segmentation by Platform

8.1 Market segments

Chart on Platform - Market share 2025-2030 (%)
Data Table on Platform - Market share 2025-2030 (%)

8.2 Comparison by Platform

Chart on Comparison by Platform
Data Table on Comparison by Platform

8.3 Mobile - Market size and forecast 2025-2030

Chart on Mobile - Market size and forecast 2025-2030 ($ billion)
Data Table on Mobile - Market size and forecast 2025-2030 ($ billion)
Chart on Mobile - Year-over-year growth 2025-2030 (%)
Data Table on Mobile - Year-over-year growth 2025-2030 (%)

8.4 PC and tablet - Market size and forecast 2025-2030

Chart on PC and tablet - Market size and forecast 2025-2030 ($ billion)
Data Table on PC and tablet - Market size and forecast 2025-2030 ($ billion)
Chart on PC and tablet - Year-over-year growth 2025-2030 (%)
Data Table on PC and tablet - Year-over-year growth 2025-2030 (%)

8.5 Market opportunity by Platform

Market opportunity by Platform ($ billion)
Data Table on Market opportunity by Platform ($ billion)

9. Market Segmentation by Product

9.1 Market segments

Chart on Product - Market share 2025-2030 (%)
Data Table on Product - Market share 2025-2030 (%)

9.2 Comparison by Product

Chart on Comparison by Product
Data Table on Comparison by Product

9.3 Baby toys - Market size and forecast 2025-2030

Chart on Baby toys - Market size and forecast 2025-2030 ($ billion)
Data Table on Baby toys - Market size and forecast 2025-2030 ($ billion)
Chart on Baby toys - Year-over-year growth 2025-2030 (%)
Data Table on Baby toys - Year-over-year growth 2025-2030 (%)

9.4 Baby gear - Market size and forecast 2025-2030

Chart on Baby gear - Market size and forecast 2025-2030 ($ billion)
Data Table on Baby gear - Market size and forecast 2025-2030 ($ billion)
Chart on Baby gear - Year-over-year growth 2025-2030 (%)
Data Table on Baby gear - Year-over-year growth 2025-2030 (%)

9.5 Baby apparel - Market size and forecast 2025-2030

Chart on Baby apparel - Market size and forecast 2025-2030 ($ billion)
Data Table on Baby apparel - Market size and forecast 2025-2030 ($ billion)
Chart on Baby apparel - Year-over-year growth 2025-2030 (%)
Data Table on Baby apparel - Year-over-year growth 2025-2030 (%)

9.6 Baby diaper products - Market size and forecast 2025-2030

Chart on Baby diaper products - Market size and forecast 2025-2030 ($ billion)
Data Table on Baby diaper products - Market size and forecast 2025-2030 ($ billion)
Chart on Baby diaper products - Year-over-year growth 2025-2030 (%)
Data Table on Baby diaper products - Year-over-year growth 2025-2030 (%)

9.7 Others - Market size and forecast 2025-2030

Chart on Others - Market size and forecast 2025-2030 ($ billion)
Data Table on Others - Market size and forecast 2025-2030 ($ billion)
Chart on Others - Year-over-year growth 2025-2030 (%)
Data Table on Others - Year-over-year growth 2025-2030 (%)

9.8 Market opportunity by Product

Market opportunity by Product ($ billion)
Data Table on Market opportunity by Product ($ billion)

10. Market Segmentation by Distribution Channel

10.1 Market segments

Chart on Distribution Channel - Market share 2025-2030 (%)
Data Table on Distribution Channel - Market share 2025-2030 (%)

10.2 Comparison by Distribution Channel

Chart on Comparison by Distribution Channel
Data Table on Comparison by Distribution Channel

10.3 E commerce platforms - Market size and forecast 2025-2030

Chart on E commerce platforms - Market size and forecast 2025-2030 ($ billion)
Data Table on E commerce platforms - Market size and forecast 2025-2030 ($ billion)
Chart on E commerce platforms - Year-over-year growth 2025-2030 (%)
Data Table on E commerce platforms - Year-over-year growth 2025-2030 (%)

10.4 Brand websites - Market size and forecast 2025-2030

Chart on Brand websites - Market size and forecast 2025-2030 ($ billion)
Data Table on Brand websites - Market size and forecast 2025-2030 ($ billion)
Chart on Brand websites - Year-over-year growth 2025-2030 (%)
Data Table on Brand websites - Year-over-year growth 2025-2030 (%)

10.5 Online retail chains - Market size and forecast 2025-2030

Chart on Online retail chains - Market size and forecast 2025-2030 ($ billion)
Data Table on Online retail chains - Market size and forecast 2025-2030 ($ billion)
Chart on Online retail chains - Year-over-year growth 2025-2030 (%)
Data Table on Online retail chains - Year-over-year growth 2025-2030 (%)

10.6 Others - Market size and forecast 2025-2030

Chart on Others - Market size and forecast 2025-2030 ($ billion)
Data Table on Others - Market size and forecast 2025-2030 ($ billion)
Chart on Others - Year-over-year growth 2025-2030 (%)
Data Table on Others - Year-over-year growth 2025-2030 (%)

10.7 Market opportunity by Distribution Channel

Market opportunity by Distribution Channel ($ billion)
Data Table on Market opportunity by Distribution Channel ($ billion)

11. Customer Landscape

11.1 Customer landscape overview

Analysis of price sensitivity, lifecycle, customer purchase basket, adoption rates, and purchase criteria

12. Geographic Landscape

12.1 Geographic segmentation

Chart on Market share by geography 2025-2030 (%)
Data Table on Market share by geography 2025-2030 (%)

12.2 Geographic comparison

Chart on Geographic comparison
Data Table on Geographic comparison

12.3 APAC - Market size and forecast 2025-2030

Chart on APAC - Market size and forecast 2025-2030 ($ billion)
Data Table on APAC - Market size and forecast 2025-2030 ($ billion)
Chart on APAC - Year-over-year growth 2025-2030 (%)
Data Table on APAC - Year-over-year growth 2025-2030 (%)
Chart on Regional Comparison - APAC
Data Table on Regional Comparison - APAC

12.3.1 China - Market size and forecast 2025-2030

Chart on China - Market size and forecast 2025-2030 ($ billion)
Data Table on China - Market size and forecast 2025-2030 ($ billion)
Chart on China - Year-over-year growth 2025-2030 (%)
Data Table on China - Year-over-year growth 2025-2030 (%)

12.3.2 Japan - Market size and forecast 2025-2030

Chart on Japan - Market size and forecast 2025-2030 ($ billion)
Data Table on Japan - Market size and forecast 2025-2030 ($ billion)
Chart on Japan - Year-over-year growth 2025-2030 (%)
Data Table on Japan - Year-over-year growth 2025-2030 (%)

12.3.3 India - Market size and forecast 2025-2030

Chart on India - Market size and forecast 2025-2030 ($ billion)
Data Table on India - Market size and forecast 2025-2030 ($ billion)
Chart on India - Year-over-year growth 2025-2030 (%)
Data Table on India - Year-over-year growth 2025-2030 (%)

12.3.4 South Korea - Market size and forecast 2025-2030

Chart on South Korea - Market size and forecast 2025-2030 ($ billion)
Data Table on South Korea - Market size and forecast 2025-2030 ($ billion)
Chart on South Korea - Year-over-year growth 2025-2030 (%)
Data Table on South Korea - Year-over-year growth 2025-2030 (%)

12.3.5 Australia - Market size and forecast 2025-2030

Chart on Australia - Market size and forecast 2025-2030 ($ billion)
Data Table on Australia - Market size and forecast 2025-2030 ($ billion)
Chart on Australia - Year-over-year growth 2025-2030 (%)
Data Table on Australia - Year-over-year growth 2025-2030 (%)

12.3.6 Indonesia - Market size and forecast 2025-2030

Chart on Indonesia - Market size and forecast 2025-2030 ($ billion)
Data Table on Indonesia - Market size and forecast 2025-2030 ($ billion)
Chart on Indonesia - Year-over-year growth 2025-2030 (%)
Data Table on Indonesia - Year-over-year growth 2025-2030 (%)

12.4 North America - Market size and forecast 2025-2030

Chart on North America - Market size and forecast 2025-2030 ($ billion)
Data Table on North America - Market size and forecast 2025-2030 ($ billion)
Chart on North America - Year-over-year growth 2025-2030 (%)
Data Table on North America - Year-over-year growth 2025-2030 (%)
Chart on Regional Comparison - North America
Data Table on Regional Comparison - North America

12.4.1 US - Market size and forecast 2025-2030

Chart on US - Market size and forecast 2025-2030 ($ billion)
Data Table on US - Market size and forecast 2025-2030 ($ billion)
Chart on US - Year-over-year growth 2025-2030 (%)
Data Table on US - Year-over-year growth 2025-2030 (%)

12.4.2 Canada - Market size and forecast 2025-2030

Chart on Canada - Market size and forecast 2025-2030 ($ billion)
Data Table on Canada - Market size and forecast 2025-2030 ($ billion)
Chart on Canada - Year-over-year growth 2025-2030 (%)
Data Table on Canada - Year-over-year growth 2025-2030 (%)

12.4.3 Mexico - Market size and forecast 2025-2030

Chart on Mexico - Market size and forecast 2025-2030 ($ billion)
Data Table on Mexico - Market size and forecast 2025-2030 ($ billion)
Chart on Mexico - Year-over-year growth 2025-2030 (%)
Data Table on Mexico - Year-over-year growth 2025-2030 (%)

12.5 Europe - Market size and forecast 2025-2030

Chart on Europe - Market size and forecast 2025-2030 ($ billion)
Data Table on Europe - Market size and forecast 2025-2030 ($ billion)
Chart on Europe - Year-over-year growth 2025-2030 (%)
Data Table on Europe - Year-over-year growth 2025-2030 (%)
Chart on Regional Comparison - Europe
Data Table on Regional Comparison - Europe

12.5.1 Germany - Market size and forecast 2025-2030

Chart on Germany - Market size and forecast 2025-2030 ($ billion)
Data Table on Germany - Market size and forecast 2025-2030 ($ billion)
Chart on Germany - Year-over-year growth 2025-2030 (%)
Data Table on Germany - Year-over-year growth 2025-2030 (%)

12.5.2 UK - Market size and forecast 2025-2030

Chart on UK - Market size and forecast 2025-2030 ($ billion)
Data Table on UK - Market size and forecast 2025-2030 ($ billion)
Chart on UK - Year-over-year growth 2025-2030 (%)
Data Table on UK - Year-over-year growth 2025-2030 (%)

12.5.3 France - Market size and forecast 2025-2030

Chart on France - Market size and forecast 2025-2030 ($ billion)
Data Table on France - Market size and forecast 2025-2030 ($ billion)
Chart on France - Year-over-year growth 2025-2030 (%)
Data Table on France - Year-over-year growth 2025-2030 (%)

12.5.4 Italy - Market size and forecast 2025-2030

Chart on Italy - Market size and forecast 2025-2030 ($ billion)
Data Table on Italy - Market size and forecast 2025-2030 ($ billion)
Chart on Italy - Year-over-year growth 2025-2030 (%)
Data Table on Italy - Year-over-year growth 2025-2030 (%)

12.5.5 Spain - Market size and forecast 2025-2030

Chart on Spain - Market size and forecast 2025-2030 ($ billion)
Data Table on Spain - Market size and forecast 2025-2030 ($ billion)
Chart on Spain - Year-over-year growth 2025-2030 (%)
Data Table on Spain - Year-over-year growth 2025-2030 (%)

12.5.6 The Netherlands - Market size and forecast 2025-2030

Chart on The Netherlands - Market size and forecast 2025-2030 ($ billion)
Data Table on The Netherlands - Market size and forecast 2025-2030 ($ billion)
Chart on The Netherlands - Year-over-year growth 2025-2030 (%)
Data Table on The Netherlands - Year-over-year growth 2025-2030 (%)

12.6 Middle East and Africa - Market size and forecast 2025-2030

Chart on Middle East and Africa - Market size and forecast 2025-2030 ($ billion)
Data Table on Middle East and Africa - Market size and forecast 2025-2030 ($ billion)
Chart on Middle East and Africa - Year-over-year growth 2025-2030 (%)
Data Table on Middle East and Africa - Year-over-year growth 2025-2030 (%)
Chart on Regional Comparison - Middle East and Africa
Data Table on Regional Comparison - Middle East and Africa

12.6.1 Saudi Arabia - Market size and forecast 2025-2030

Chart on Saudi Arabia - Market size and forecast 2025-2030 ($ billion)
Data Table on Saudi Arabia - Market size and forecast 2025-2030 ($ billion)
Chart on Saudi Arabia - Year-over-year growth 2025-2030 (%)
Data Table on Saudi Arabia - Year-over-year growth 2025-2030 (%)

12.6.2 UAE - Market size and forecast 2025-2030

Chart on UAE - Market size and forecast 2025-2030 ($ billion)
Data Table on UAE - Market size and forecast 2025-2030 ($ billion)
Chart on UAE - Year-over-year growth 2025-2030 (%)
Data Table on UAE - Year-over-year growth 2025-2030 (%)

12.6.3 South Africa - Market size and forecast 2025-2030

Chart on South Africa - Market size and forecast 2025-2030 ($ billion)
Data Table on South Africa - Market size and forecast 2025-2030 ($ billion)
Chart on South Africa - Year-over-year growth 2025-2030 (%)
Data Table on South Africa - Year-over-year growth 2025-2030 (%)

12.6.4 Israel - Market size and forecast 2025-2030

Chart on Israel - Market size and forecast 2025-2030 ($ billion)
Data Table on Israel - Market size and forecast 2025-2030 ($ billion)
Chart on Israel - Year-over-year growth 2025-2030 (%)
Data Table on Israel - Year-over-year growth 2025-2030 (%)

12.6.5 Turkey - Market size and forecast 2025-2030

Chart on Turkey - Market size and forecast 2025-2030 ($ billion)
Data Table on Turkey - Market size and forecast 2025-2030 ($ billion)
Chart on Turkey - Year-over-year growth 2025-2030 (%)
Data Table on Turkey - Year-over-year growth 2025-2030 (%)

12.7 South America - Market size and forecast 2025-2030

Chart on South America - Market size and forecast 2025-2030 ($ billion)
Data Table on South America - Market size and forecast 2025-2030 ($ billion)
Chart on South America - Year-over-year growth 2025-2030 (%)
Data Table on South America - Year-over-year growth 2025-2030 (%)
Chart on Regional Comparison - South America
Data Table on Regional Comparison - South America

12.7.1 Brazil - Market size and forecast 2025-2030

Chart on Brazil - Market size and forecast 2025-2030 ($ billion)
Data Table on Brazil - Market size and forecast 2025-2030 ($ billion)
Chart on Brazil - Year-over-year growth 2025-2030 (%)
Data Table on Brazil - Year-over-year growth 2025-2030 (%)

12.7.2 Argentina - Market size and forecast 2025-2030

Chart on Argentina - Market size and forecast 2025-2030 ($ billion)
Data Table on Argentina - Market size and forecast 2025-2030 ($ billion)
Chart on Argentina - Year-over-year growth 2025-2030 (%)
Data Table on Argentina - Year-over-year growth 2025-2030 (%)

12.7.3 Chile - Market size and forecast 2025-2030

Chart on Chile - Market size and forecast 2025-2030 ($ billion)
Data Table on Chile - Market size and forecast 2025-2030 ($ billion)
Chart on Chile - Year-over-year growth 2025-2030 (%)
Data Table on Chile - Year-over-year growth 2025-2030 (%)

12.8 Market opportunity by geography

Market opportunity by geography ($ billion)
Data Tables on Market opportunity by geography ($ billion)

13. Drivers, Challenges, and Opportunity

13.1 Market drivers

Competitive pricing and discounts on baby products
Increase in Internet penetration and online availability of baby care products
Rise in disposable income and growing urbanization

13.2 Market challenges

Availability of counterfeit baby products
Lack of trust in online baby products
Lack of touch-and-feel experience

13.3 Impact of drivers and challenges

Impact of drivers and challenges in 2025 and 2030

13.4 Market opportunities

Growing omnichannel retailing
Advances in packaging of baby products
Increased role of social media platform in online sales of baby products

14. Competitive Landscape

14.1 Overview

14.2

Overview on criticality of inputs and factors of differentiation

14.3 Landscape disruption

Overview on factors of disruption

14.4 Industry risks

Impact of key risks on business

15. Competitive Analysis

15.1 Companies profiled

Companies covered

15.2 Company ranking index

15.3 Market positioning of companies

Matrix on companies position and classification

15.4 Alibaba Group Holding Ltd.

Alibaba Group Holding Ltd. - Overview
Alibaba Group Holding Ltd. - Business segments
Alibaba Group Holding Ltd. - Key news
Alibaba Group Holding Ltd. - Key offerings
Alibaba Group Holding Ltd. - Segment focus
SWOT

15.5 Amazon.com Inc.

Amazon.com Inc. - Overview
Amazon.com Inc. - Business segments
Amazon.com Inc. - Key news
Amazon.com Inc. - Key offerings
Amazon.com Inc. - Segment focus
SWOT

15.6 Argos Ltd.

Argos Ltd. - Overview
Argos Ltd. - Product / Service
Argos Ltd. - Key offerings
SWOT

15.7 Baby Earth

Baby Earth - Overview
Baby Earth - Product / Service
Baby Earth - Key offerings
SWOT

15.8 Babydash Sdn Bhd

Babydash Sdn Bhd - Overview
Babydash Sdn Bhd - Product / Service
Babydash Sdn Bhd - Key offerings
SWOT

15.9 Babyshop Group

Babyshop Group - Overview
Babyshop Group - Product / Service
Babyshop Group - Key offerings
SWOT

15.10 Best Buy Co. Inc.

Best Buy Co. Inc. - Overview
Best Buy Co. Inc. - Business segments
Best Buy Co. Inc. - Key news
Best Buy Co. Inc. - Key offerings
Best Buy Co. Inc. - Segment focus
SWOT

15.11 Beyond Inc.

Beyond Inc. - Overview
Beyond Inc. - Business segments
Beyond Inc. - Key offerings
Beyond Inc. - Segment focus
SWOT

15.12 BrainBees Solutions Ltd.

BrainBees Solutions Ltd. - Overview
BrainBees Solutions Ltd. - Business segments
BrainBees Solutions Ltd. - Key offerings
BrainBees Solutions Ltd. - Segment focus
SWOT

15.13 Crate and Barrel

Crate and Barrel - Overview
Crate and Barrel - Product / Service
Crate and Barrel - Key offerings
SWOT

15.14 eBay Inc.

eBay Inc. - Overview
eBay Inc. - Product / Service
eBay Inc. - Key offerings
SWOT

15.15 Grupo Bebecar SA

Grupo Bebecar SA - Overview
Grupo Bebecar SA - Product / Service
Grupo Bebecar SA - Key offerings
SWOT

15.16 Mumzworld

Mumzworld - Overview
Mumzworld - Product / Service
Mumzworld - Key offerings
SWOT

15.17 Rakuten Group Inc.

Rakuten Group Inc. - Overview
Rakuten Group Inc. - Business segments
Rakuten Group Inc. - Key news
Rakuten Group Inc. - Key offerings
Rakuten Group Inc. - Segment focus
SWOT

15.18 Saks Fifth Avenue

Saks Fifth Avenue - Overview
Saks Fifth Avenue - Product / Service
Saks Fifth Avenue - Key offerings
SWOT

16. Appendix

16.1 Scope of the report

Market definition
Objectives
Notes and caveats

16.2 Inclusions and exclusions checklist

Inclusions checklist
Exclusions checklist

16.3 Currency conversion rates for US$

16.4 Research methodology

16.5 Data procurement

Information sources

16.6 Data validation

16.7 Validation techniques employed for market sizing

16.8 Data synthesis

16.9 360 degree market analysis

16.10 List of abbreviations

Research Methodology

Technavio presents a detailed picture of the market by way of study, synthesis, and summation of data from multiple sources. The analysts have presented the various facets of the market with a particular focus on identifying the key industry influencers. The data thus presented is comprehensive, reliable, and the result of extensive research, both primary and secondary.

INFORMATION SOURCES

Primary sources

  • Manufacturers and suppliers
  • Channel partners
  • Industry experts
  • Strategic decision makers

Secondary sources

  • Industry journals and periodicals
  • Government data
  • Financial reports of key industry players
  • Historical data
  • Press releases

DATA ANALYSIS

Data Synthesis

  • Collation of data
  • Estimation of key figures
  • Analysis of derived insights

Data Validation

  • Triangulation with data models
  • Reference against proprietary databases
  • Corroboration with industry experts

REPORT WRITING

Qualitative

  • Market drivers
  • Market challenges
  • Market trends
  • Five forces analysis

Quantitative

  • Market size and forecast
  • Market segmentation
  • Geographical insights
  • Competitive landscape

Interested in this report?

Get your sample now to see our research methodology and insights!

Download Now

Frequently Asked Questions

Online Baby Products Retailing market growth will increase by USD 30.6 billion during 2026-2030.

The Online Baby Products Retailing market is expected to grow at a CAGR of 13.5% during 2026-2030.

Online Baby Products Retailing market is segmented by Platform (Mobile, PC and tablet) Product (Baby toys, Baby gear, Baby apparel, Baby diaper products, Others) Distribution channel (E commerce platforms, Brand websites, Online retail chains, Others)

Alibaba Group Holding Ltd., Amazon.com Inc., Argos Ltd., Baby Earth, Babydash Sdn Bhd, Babyshop Group, Best Buy Co. Inc., Beyond Inc., BrainBees Solutions Ltd., Crate and Barrel, eBay Inc., Grupo Bebecar SA, J Born, Mumzworld, Next GmbH, Rakuten Group Inc., Saks Fifth Avenue, Takealot Online Pty Ltd. are a few of the key vendors in the Online Baby Products Retailing market.

APAC will register the highest growth rate of 35% among the other regions. Therefore, the Online Baby Products Retailing market in APAC is expected to garner significant business opportunities for the vendors during the forecast period.

China, Japan, India, South Korea, Australia, Indonesia, US, Canada, Mexico, Germany, UK, France, Italy, Spain, The Netherlands, Saudi Arabia, UAE, South Africa, Israel, Turkey, Brazil, Argentina, Chile

  • Competitive pricing and discounts on baby products is the driving factor this market.

The Online Baby Products Retailing market vendors should focus on grabbing business opportunities from the Platform segment as it accounted for the largest market share in the base year.
RIA - Research AI Assistant
Ask RIA