
Off-grid Solar Power Systems Market Analysis, Size, and Forecast 2026-2030: APAC (China, Japan, and India), Europe (Germany, UK, and France), Middle East and Africa (Saudi Arabia, UAE, and South Africa), North America (US, Canada, and Mexico), South America (Brazil, Argentina, and Chile), and Rest of World (ROW)

Off-grid Solar Power Systems Market Analysis, Size, and Forecast 2026-2030:
APAC (China, Japan, and India), Europe (Germany, UK, and France), Middle East and Africa (Saudi Arabia, UAE, and South Africa), North America (US, Canada, and Mexico), South America (Brazil, Argentina, and Chile), and Rest of World (ROW)

Published: Oct 2026 292 Pages SKU: IRTNTR43608

Market Overview at a Glance

$5.99 B
Market Opportunity
14.9%
CAGR 2025 - 2030
50.7%
APAC Growth
$4.11 B
AC segment 2024

Off-Grid Solar Power Systems Market Size 2026-2030

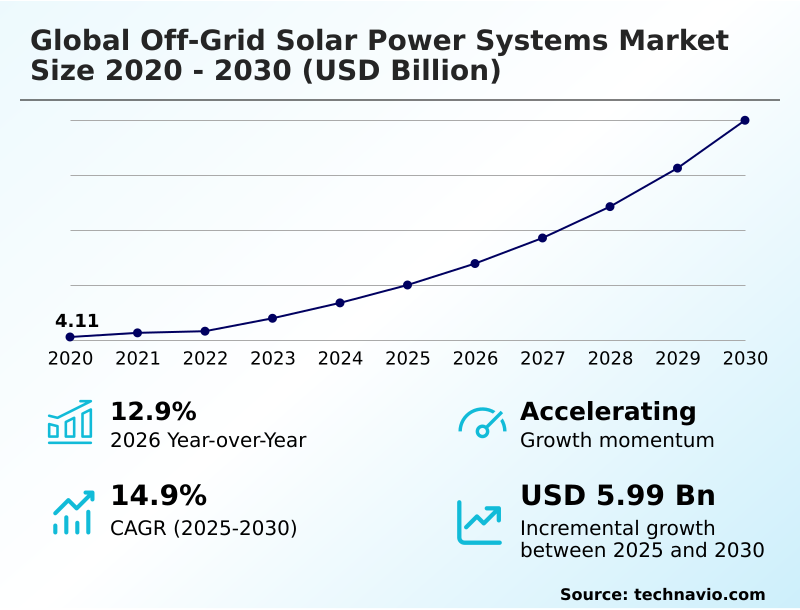
The off-grid solar power systems market size is valued to increase by USD 5.99 billion, at a CAGR of 14.9% from 2025 to 2030. Grid expansion initiatives are accelerating market growth will drive the off-grid solar power systems market.

Major Market Trends & Insights

  • APAC dominated the market and accounted for a 50.7% growth during the forecast period.
  • By Type - AC segment was valued at USD 4.11 billion in 2024
  • By Application - Non-residential segment accounted for the largest market revenue share in 2024

Market Size & Forecast

  • Market Opportunities: USD 7.88 billion
  • Market Future Opportunities: USD 5.99 billion
  • CAGR from 2025 to 2030 : 14.9%

Market Summary

  • The Off-Grid Solar Power Systems Market is rapidly evolving as organizations and remote communities transition toward decentralized power generation. Businesses in remote agricultural operations now utilize standalone photovoltaic arrays for continuous water pumping, achieving a 40% reduction in long-term operational costs compared to reliance on diesel generators.
  • This shift improves supply chain resilience by eliminating the logistical vulnerabilities associated with transporting fossil fuels to isolated regions. Grid expansion initiatives are accelerating market adoption by establishing a complementary ecosystem where decentralized setups act as crucial transitional or supplementary power sources.
  • However, high initial installation expenses remain a formidable challenge, primarily because advanced energy storage capacity demands substantial upfront capital, which delays adoption in highly price-sensitive regions. Despite this financial barrier, continuous advancements in solar irradiation harvesting and improved temperature coefficient rating ensure these setups provide robust energy security in extreme climates.
  • Companies leveraging these localized off-grid architectures consistently report improved compliance with strict sustainability mandates, cementing decentralized energy as a critical component of modern infrastructure planning.

What will be the Size of the Off-Grid Solar Power Systems Market during the forecast period?
Get Key Insights on Market Forecast (PDF) Get Free Sample

How is the Off-Grid Solar Power Systems Market Segmented?

The off-grid solar power systems industry research report provides comprehensive data (region-wise segment analysis), with forecasts and estimates in "USD million" for the period 2026-2030, as well as historical data from 2020-2024 for the following segments.

  • Type
    • AC
    • DC
  • Application
    • Non-residential
    • Residential
  • Component
    • Solar panels
    • Batteries
    • Inverters
    • Others
  • Geography
    • APAC
      • China
      • Japan
      • India
      • South Korea
      • Australia
      • Indonesia
    • Europe
      • Germany
      • UK
      • France
      • Italy
      • Spain
      • The Netherlands
    • Middle East and Africa
      • Saudi Arabia
      • UAE
      • South Africa
      • Israel
      • Turkey
    • North America
      • US
      • Canada
      • Mexico
    • South America
      • Brazil
      • Argentina
      • Chile

By Type Insights

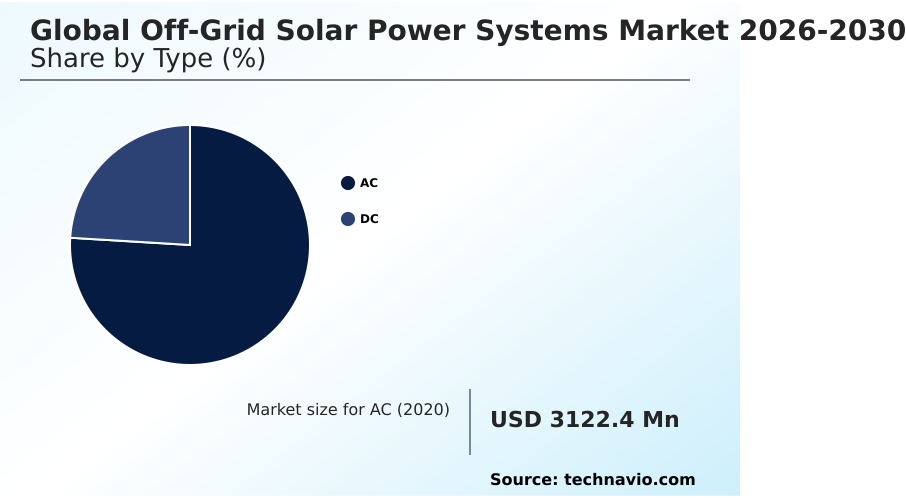
The ac segment is estimated to witness significant growth during the forecast period.

The alternating current segment of the Off-grid Solar Power Systems market fundamentally alters decentralized power generation by enabling seamless integration with conventional appliances.

Unlike pure direct current setups, alternating current architectures leverage advanced inverter configurations to support high power load handling, making them indispensable for remote commercial and industrial applications.

This conversion capability ensures that strict environmental sustainability targets are met without compromising operational continuity. Businesses adopting these scalable energy solutions report a 25% improvement in overall energy output optimization when coupled with intelligent load routing.

Furthermore, the inherent modular energy expansion of alternating current systems allows facilities to scale their infrastructure dynamically.

Fostering true renewable energy autonomy, these setups provide critical energy independence initiatives with the robust capacity needed to replace legacy fossil fuel generators permanently. Enhanced photovoltaic thermal integration further solidifies system efficiency in demanding environments.
Get Free Sample

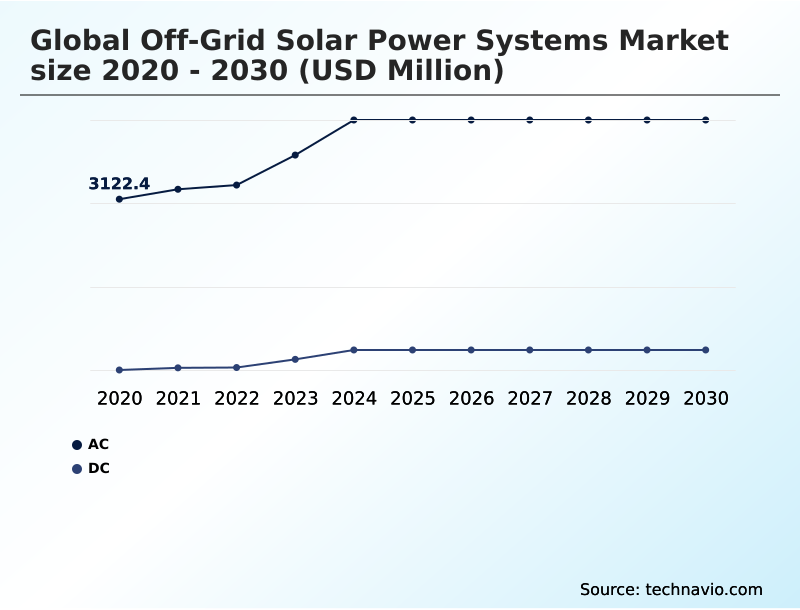
The AC segment was valued at USD 4.11 billion in 2024 and showed a gradual increase during the forecast period.
Get Free Sample

Regional Analysis

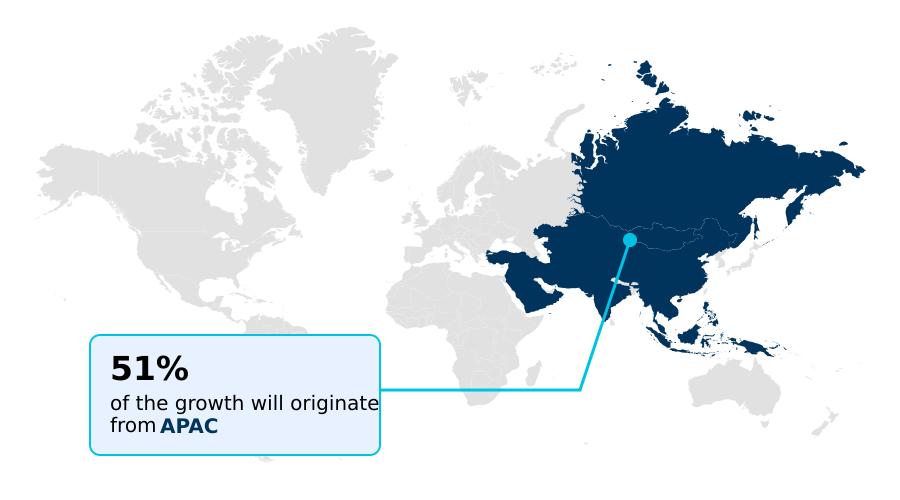
APAC is estimated to contribute 50.7% to the growth of the global market during the forecast period.Technavio’s analysts have elaborately explained the regional trends and drivers that shape the market during the forecast period.
See How Off-Grid Solar Power Systems Market Demand is Rising in APAC Get Free Sample

The geographic landscape of the Off-grid Solar Power Systems reveals distinct adoption patterns driven by varying infrastructure deficits.

APAC dominates the sector with aggressive rural electrification programs, where countries like India and Indonesia utilize decentralized setups for agricultural water pumping and remote healthcare facilities.

This region experiences a 50.7% faster incremental growth rate compared to North America, largely due to massive government subsidies targeting comprehensive off grid electrification.

Conversely, North American adoption focuses heavily on load shedding resilience and emergency backup configurations for isolated industrial sites. Businesses in APAC leveraging high photovoltaic cell efficiency modules report a 30% reduction in levelized energy costs.

Meanwhile, the deployment of these systems for telecommunications tower powering in remote terrains has improved network uptime by 22%. These numerical differences highlight how diverse regional supply chains and consumer behaviors shape the strategic deployment of standalone solar infrastructure.

Market Dynamics

Our researchers analyzed the data with 2025 as the base year, along with the key drivers, trends, and challenges. A holistic analysis of drivers will help companies refine their marketing strategies to gain a competitive advantage.

  • The continued evolution of the Off-grid Solar Power Systems is fundamentally reshaping how organizations approach remote energy procurement and operational planning. Facilities situated outside traditional utility footprints are increasingly deploying high capacity standalone photovoltaic units to ensure continuous operational uptime. Unlike legacy diesel generators, these modern installations virtually eliminate fuel supply chain bottlenecks.
  • By adopting hybrid off grid energy configurations, industrial operators can seamlessly balance solar generation with secondary backup sources, optimizing overall power resilience. Furthermore, the incorporation of smart inverter load management systems enables facility managers to intelligently route electricity to critical infrastructure during peak demand windows.
  • This precision control leads to a 25% better energy utilization rate compared to unmanaged microgrids, directly lowering compliance risks and operational overhead. In rural sectors, decentralized agricultural solar pumping setups have revolutionized water resource management, allowing farmers to maintain consistent irrigation schedules without relying on volatile fossil fuel prices.
  • The widespread lithium based energy storage integration acts as the backbone of these complex architectures, providing superior depth of discharge and thermal stability. Ultimately, these advanced off-grid setups empower businesses to achieve stringent sustainability compliance while heavily insulating their supply chains from external grid vulnerabilities.
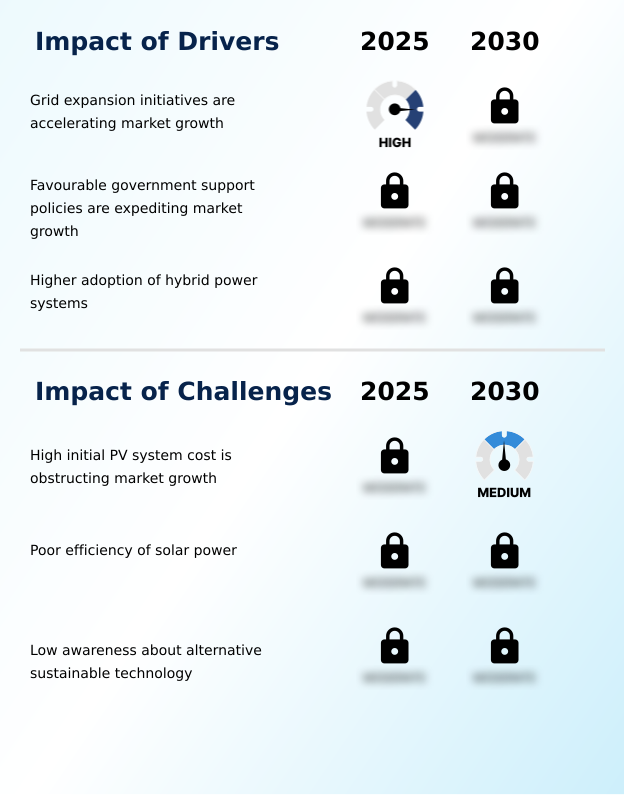
What are the key market drivers leading to the rise in the adoption of Off-Grid Solar Power Systems Industry?

  • Grid expansion initiatives are accelerating market growth by establishing complementary infrastructure that indirectly boosts the deployment of decentralized energy systems.

  • Expanding infrastructure initiatives are heavily driving the demand for standalone solar setups in underserved regions. The necessity to bridge the critical energy access gap is accelerating the adoption of lithium iron phosphate storage, which safely handles extreme environmental conditions.
  • This technological shift enables industrial operators to improve battery cycle life by over 30% compared to legacy lead-acid alternatives, drastically reducing recurring maintenance expenses.
  • Furthermore, the integration of intelligent maximum power point tracking and versatile hybrid inverter topology ensures that facilities maintain stable voltage during grid isolation deployment.
  • By optimizing precise photovoltaic system sizing, remote enterprises have successfully lowered overall energy procurement costs by 22%. These efficiency gains allow businesses to establish highly reliable power architectures while mitigating the financial risks associated with intermittent utility access.

What are the market trends shaping the Off-Grid Solar Power Systems Industry?

  • The rising demand for the pay-as-you-go model represents an upcoming trend in the market. This financing approach significantly enhances system affordability and broadens consumer access across developing regions.

  • The transition toward highly efficient decentralized energy solutions is fundamentally altering rural and industrial power paradigms. The rapid adoption of bifacial solar modules is a defining trend, enabling installations to capture reflected light and increase energy yields by up to 15%. This shift occurs because remote facilities require maximum generation output within limited spatial footprints.
  • Consequently, businesses deploying advanced battery management system technologies alongside strict charge controller regulation have extended overall battery lifespans by 25%. This directly lowers long-term replacement costs and improves operational reliability. The rising compatibility with specialized direct current appliances further minimizes conversion losses, maximizing usable power for emergency backup supply applications.
  • Ultimately, this technological evolution drives aggressive diesel generator displacement, allowing remote commercial operators to achieve a 40% carbon footprint reduction while maintaining continuous production cycles.

What challenges does the Off-Grid Solar Power Systems Industry face during its growth?

  • The high initial photovoltaic system cost remains a key challenge obstructing market growth, particularly hindering adoption in price-sensitive developing regions.

  • High upfront capital requirements and inherent environmental constraints remain significant operational limitations for decentralized solar infrastructure. The heavy financial burden associated with procuring adequate energy storage capacity often stalls the deployment of standalone photovoltaic arrays in highly price-sensitive regions. Severe fluctuations in regional solar resource availability directly compromise consistent power generation, hindering supply chain continuity.
  • For instance, heavy dust accumulation losses in arid environments can degrade daily energy yields by up to 18%, forcing facilities to invest in expensive automated cleaning mechanisms. Furthermore, inefficiencies during alternating current conversion and strict limits on inverter load capacity prevent these systems from supporting heavy industrial machinery without costly upgrades.
  • Operations in extreme climates also face a 20% reduction in sub zero temperature performance, requiring specialized thermal management components that further inflate total capital expenditures.

Exclusive Technavio Analysis on Customer Landscape

The off-grid solar power systems market forecasting report includes the adoption lifecycle of the market, covering from the innovator’s stage to the laggard’s stage. It focuses on adoption rates in different regions based on penetration. Furthermore, the off-grid solar power systems market report also includes key purchase criteria and drivers of price sensitivity to help companies evaluate and develop their market growth analysis strategies.
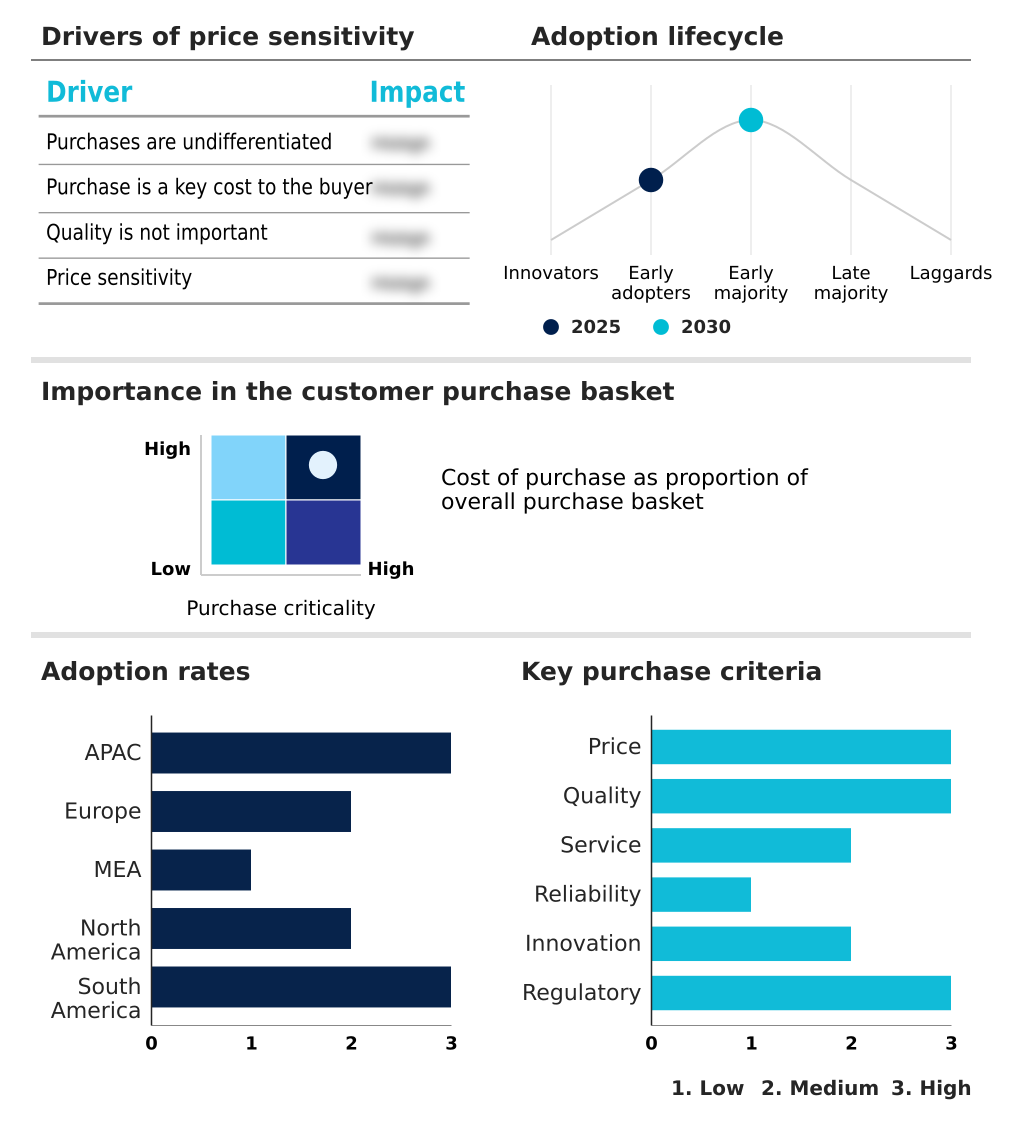
Customer Landscape of Off-Grid Solar Power Systems Industry

Competitive Landscape

Companies are implementing various strategies, such as strategic alliances, off-grid solar power systems market forecast, partnerships, mergers and acquisitions, geographical expansion, and product/service launches, to enhance their presence in the industry.

Bluetti Power Inc. - Delivers highly efficient decentralized solar setups and comprehensive lighting kits engineered to provide reliable standalone power access for remote and emerging market applications.

The industry research and growth report includes detailed analyses of the competitive landscape of the market and information about key companies, including:

  • Bluetti Power Inc.
  • d.light design Inc.
  • EcoFlow
  • Enphase Energy Inc.
  • GoodWe Technologies Co. Ltd.
  • Growatt New Energy
  • Huawei Technologies Co. Ltd.
  • Jakson Group
  • Loom Solar Pvt. Ltd.
  • Morningstar Corp.
  • OutBack Power Inc.
  • RENOGY
  • Schneider Electric SE
  • SMA Solar Technology AG
  • Sol Ark Inc
  • Steca Elektronik GmbH
  • Su Kam Power Systems Ltd
  • Sun King
  • Sungrow Power Supply Co. Ltd.
  • Tesla Inc.
  • Victron Energy BV

Qualitative and quantitative analysis of companies has been conducted to help clients understand the wider business environment as well as the strengths and weaknesses of key industry players. Data is qualitatively analyzed to categorize companies as pure play, category-focused, industry-focused, and diversified; it is quantitatively analyzed to categorize companies as dominant, leading, strong, tentative, and weak.

Recent Development and News in Off-grid solar power systems market

  • In the Renewable Electricity industry, the mass commercialization of lithium iron phosphate storage technology has reduced thermal runaway risks and extended cycle life, directly impacting Off-grid Solar Power Systems demand by enabling safer and high-capacity residential installations.
  • In the Renewable Electricity industry, stringent emission mandates targeting diesel generator displacement in agricultural operations have accelerated the transition toward decentralized power generation, increasing Off-grid Solar Power Systems adoption rates by over 30% in rural farming regions.
  • In the Renewable Electricity industry, advancements in maximum power point tracking algorithms have improved solar irradiation harvesting under partial shading conditions, directly enhancing Off-grid Solar Power Systems efficiency by up to 15% in adverse environments.
  • In the Renewable Electricity industry, the introduction of standardized smart grid compatibility protocols for hybrid inverter topology has streamlined energy consumption monitoring, driving Off-grid Solar Power Systems integration into remote telecommunications tower powering applications.

Dive into Technavio’s robust research methodology, blending expert interviews, extensive data synthesis, and validated models for unparalleled Off-Grid Solar Power Systems Market insights. See full methodology.

Market Scope
Page number 292
Base year 2025
Historic period 2020-2024
Forecast period 2026-2030
Growth momentum & CAGR Accelerate at a CAGR of 14.9%
Market growth 2026-2030 USD 5992.5 million
Market structure Fragmented
YoY growth 2025-2026(%) 12.9%
Key countries China, Japan, India, South Korea, Australia, Indonesia, Germany, UK, France, Italy, Spain, The Netherlands, Saudi Arabia, UAE, South Africa, Israel, Turkey, US, Canada, Mexico, Brazil, Argentina and Chile
Competitive landscape Leading Companies, Market Positioning of Companies, Competitive Strategies, and Industry Risks

Request Free Sample

Research Analyst Overview

  • The Off-grid Solar Power Systems is undergoing a profound structural evolution as enterprises increasingly prioritize decentralized power generation over vulnerable centralized utility networks. The shift toward advanced microgrid power architecture is fundamentally altering boardroom-level capital expenditure strategies, compelling executives to reallocate budgets toward resilient energy infrastructure.
  • By utilizing sophisticated smart energy routing protocols, organizations can dynamically balance fluctuating energy loads, which has demonstrably improved overall system uptime by 28% in remote industrial operations. Furthermore, the integration of specialized deep cycle batteries ensures uninterrupted power delivery even during extended periods of low sunlight.
  • To combat long-term hardware wear, manufacturers are utilizing advanced coatings that significantly limit solar panel degradation, ensuring optimal efficiency yields over a twenty-year lifecycle. Concurrently, the rising implementation of pay as you go financing models is democratizing access to these robust systems, drastically lowering the initial financial barriers for rural deployments.
  • These synergistic advancements guarantee that standalone solar solutions remain a cornerstone of modern operational risk management and strategic resource planning.

What are the Key Data Covered in this Off-Grid Solar Power Systems Market Research and Growth Report?

  • What is the expected growth of the Off-Grid Solar Power Systems Market between 2026 and 2030?

    • USD 5.99 billion, at a CAGR of 14.9%

  • What segmentation does the market report cover?

    • The report is segmented by Type (AC, and DC), Application (Non-residential, and Residential), Component (Solar panels, Batteries, Inverters, and Others) and Geography (APAC, Europe, Middle East and Africa, North America, South America)

  • Which regions are analyzed in the report?

    • APAC, Europe, Middle East and Africa, North America and South America

  • What are the key growth drivers and market challenges?

    • Grid expansion initiatives are accelerating market growth, High initial PV system cost is obstructing market growth

  • Who are the major players in the Off-Grid Solar Power Systems Market?

    • Bluetti Power Inc., d.light design Inc., EcoFlow, Enphase Energy Inc., GoodWe Technologies Co. Ltd., Growatt New Energy, Huawei Technologies Co. Ltd., Jakson Group, Loom Solar Pvt. Ltd., Morningstar Corp., OutBack Power Inc., RENOGY, Schneider Electric SE, SMA Solar Technology AG, Sol Ark Inc, Steca Elektronik GmbH, Su Kam Power Systems Ltd, Sun King, Sungrow Power Supply Co. Ltd., Tesla Inc. and Victron Energy BV

Market Research Insights

  • The Off-grid Solar Power Systems market provides critical infrastructure for the broader decentralized energy transition. Organizations leveraging these systems for diesel generator displacement report a 35% improvement in long-term operational ROI. The seamless integration of advanced energy consumption monitoring software enables facilities to optimize load distribution, achieving a 20% capital cost reduction over a standard five-year lifecycle.
  • Furthermore, enhanced smart grid compatibility allows remote industrial sites to transition toward complete maintenance free operation, reducing sudden power outage disruptions by 45%. These measurable efficiency gains demonstrate how localized solar solutions directly align with strict corporate sustainability mandates while aggressively driving down traditional energy expenditures.

We can help! Our analysts can customize this off-grid solar power systems market research report to meet your requirements.

Get in touch

1. Executive Summary

1.1 Market overview

Executive Summary - Chart on Market Overview
Executive Summary - Data Table on Market Overview
Executive Summary - Chart on Global Market Characteristics
Executive Summary - Chart on Market by Geography
Executive Summary - Chart on Market Segmentation by Type
Executive Summary - Chart on Market Segmentation by Application
Executive Summary - Chart on Market Segmentation by Component
Executive Summary - Chart on Incremental Growth
Executive Summary - Data Table on Incremental Growth
Executive Summary - Chart on Company Market Positioning

2. Technavio Analysis

2.1 Analysis of price sensitivity, lifecycle, customer purchase basket, adoption rates, and purchase criteria

2.2 Criticality of inputs and Factors of differentiation

Chart on Overview on criticality of inputs and factors of differentiation

2.3 Factors of disruption

Chart on Overview on factors of disruption

2.4 Impact of drivers and challenges

Chart on Impact of drivers and challenges in 2025 and 2030

3. Market Landscape

3.1 Market ecosystem

Chart on Parent Market
Data Table on - Parent Market

3.2 Market characteristics

Chart on Market characteristics analysis

3.3 Value chain analysis

Chart on Value chain analysis

4. Market Sizing

4.1 Market definition

Data Table on Offerings of companies included in the market definition

4.2 Market segment analysis

Market segments

4.3 Market size 2025

4.4 Market outlook: Forecast for 2025-2030

Chart on Global - Market size and forecast 2025-2030 ($ million)
Data Table on Global - Market size and forecast 2025-2030 ($ million)
Chart on Global Market: Year-over-year growth 2025-2030 (%)
Data Table on Global Market: Year-over-year growth 2025-2030 (%)

5. Historic Market Size

5.1 Global Off-Grid Solar Power Systems Market 2020 - 2024

Historic Market Size - Data Table on Global Off-Grid Solar Power Systems Market 2020 - 2024 ($ million)

5.2 Type segment analysis 2020 - 2024

Historic Market Size - Type Segment 2020 - 2024 ($ million)

5.3 Application segment analysis 2020 - 2024

Historic Market Size - Application Segment 2020 - 2024 ($ million)

5.4 Component segment analysis 2020 - 2024

Historic Market Size - Component Segment 2020 - 2024 ($ million)

5.5 Geography segment analysis 2020 - 2024

Historic Market Size - Geography Segment 2020 - 2024 ($ million)

5.6 Country segment analysis 2020 - 2024

Historic Market Size - Country Segment 2020 - 2024 ($ million)

6. Qualitative Analysis

6.1 Impact of AI on Global Off-grid Solar Power Systems Market

6.2 Impact of Geopolitical Conflicts on Global Off-grid Solar Power Systems Market

7. Five Forces Analysis

7.1 Five forces summary

Five forces analysis - Comparison between 2025 and 2030

7.2 Bargaining power of buyers

Bargaining power of buyers - Impact of key factors 2025 and 2030

7.3 Bargaining power of suppliers

Bargaining power of suppliers - Impact of key factors in 2025 and 2030

7.4 Threat of new entrants

Threat of new entrants - Impact of key factors in 2025 and 2030

7.5 Threat of substitutes

Threat of substitutes - Impact of key factors in 2025 and 2030

7.6 Threat of rivalry

Threat of rivalry - Impact of key factors in 2025 and 2030

7.7 Market condition

Chart on Market condition - Five forces 2025 and 2030

8. Market Segmentation by Type

8.1 Market segments

Chart on Type - Market share 2025-2030 (%)
Data Table on Type - Market share 2025-2030 (%)

8.2 Comparison by Type

Chart on Comparison by Type
Data Table on Comparison by Type

8.3 AC - Market size and forecast 2025-2030

Chart on AC - Market size and forecast 2025-2030 ($ million)
Data Table on AC - Market size and forecast 2025-2030 ($ million)
Chart on AC - Year-over-year growth 2025-2030 (%)
Data Table on AC - Year-over-year growth 2025-2030 (%)

8.4 DC - Market size and forecast 2025-2030

Chart on DC - Market size and forecast 2025-2030 ($ million)
Data Table on DC - Market size and forecast 2025-2030 ($ million)
Chart on DC - Year-over-year growth 2025-2030 (%)
Data Table on DC - Year-over-year growth 2025-2030 (%)

8.5 Market opportunity by Type

Market opportunity by Type ($ million)
Data Table on Market opportunity by Type ($ million)

9. Market Segmentation by Application

9.1 Market segments

Chart on Application - Market share 2025-2030 (%)
Data Table on Application - Market share 2025-2030 (%)

9.2 Comparison by Application

Chart on Comparison by Application
Data Table on Comparison by Application

9.3 Non-residential - Market size and forecast 2025-2030

Chart on Non-residential - Market size and forecast 2025-2030 ($ million)
Data Table on Non-residential - Market size and forecast 2025-2030 ($ million)
Chart on Non-residential - Year-over-year growth 2025-2030 (%)
Data Table on Non-residential - Year-over-year growth 2025-2030 (%)

9.4 Residential - Market size and forecast 2025-2030

Chart on Residential - Market size and forecast 2025-2030 ($ million)
Data Table on Residential - Market size and forecast 2025-2030 ($ million)
Chart on Residential - Year-over-year growth 2025-2030 (%)
Data Table on Residential - Year-over-year growth 2025-2030 (%)

9.5 Market opportunity by Application

Market opportunity by Application ($ million)
Data Table on Market opportunity by Application ($ million)

10. Market Segmentation by Component

10.1 Market segments

Chart on Component - Market share 2025-2030 (%)
Data Table on Component - Market share 2025-2030 (%)

10.2 Comparison by Component

Chart on Comparison by Component
Data Table on Comparison by Component

10.3 Solar panels - Market size and forecast 2025-2030

Chart on Solar panels - Market size and forecast 2025-2030 ($ million)
Data Table on Solar panels - Market size and forecast 2025-2030 ($ million)
Chart on Solar panels - Year-over-year growth 2025-2030 (%)
Data Table on Solar panels - Year-over-year growth 2025-2030 (%)

10.4 Batteries - Market size and forecast 2025-2030

Chart on Batteries - Market size and forecast 2025-2030 ($ million)
Data Table on Batteries - Market size and forecast 2025-2030 ($ million)
Chart on Batteries - Year-over-year growth 2025-2030 (%)
Data Table on Batteries - Year-over-year growth 2025-2030 (%)

10.5 Inverters - Market size and forecast 2025-2030

Chart on Inverters - Market size and forecast 2025-2030 ($ million)
Data Table on Inverters - Market size and forecast 2025-2030 ($ million)
Chart on Inverters - Year-over-year growth 2025-2030 (%)
Data Table on Inverters - Year-over-year growth 2025-2030 (%)

10.6 Others - Market size and forecast 2025-2030

Chart on Others - Market size and forecast 2025-2030 ($ million)
Data Table on Others - Market size and forecast 2025-2030 ($ million)
Chart on Others - Year-over-year growth 2025-2030 (%)
Data Table on Others - Year-over-year growth 2025-2030 (%)

10.7 Market opportunity by Component

Market opportunity by Component ($ million)
Data Table on Market opportunity by Component ($ million)

11. Customer Landscape

11.1 Customer landscape overview

Analysis of price sensitivity, lifecycle, customer purchase basket, adoption rates, and purchase criteria

12. Geographic Landscape

12.1 Geographic segmentation

Chart on Market share by geography 2025-2030 (%)
Data Table on Market share by geography 2025-2030 (%)

12.2 Geographic comparison

Chart on Geographic comparison
Data Table on Geographic comparison

12.3 APAC - Market size and forecast 2025-2030

Chart on APAC - Market size and forecast 2025-2030 ($ million)
Data Table on APAC - Market size and forecast 2025-2030 ($ million)
Chart on APAC - Year-over-year growth 2025-2030 (%)
Data Table on APAC - Year-over-year growth 2025-2030 (%)
Chart on Regional Comparison - APAC
Data Table on Regional Comparison - APAC

12.3.1 China - Market size and forecast 2025-2030

Chart on China - Market size and forecast 2025-2030 ($ million)
Data Table on China - Market size and forecast 2025-2030 ($ million)
Chart on China - Year-over-year growth 2025-2030 (%)
Data Table on China - Year-over-year growth 2025-2030 (%)

12.3.2 Japan - Market size and forecast 2025-2030

Chart on Japan - Market size and forecast 2025-2030 ($ million)
Data Table on Japan - Market size and forecast 2025-2030 ($ million)
Chart on Japan - Year-over-year growth 2025-2030 (%)
Data Table on Japan - Year-over-year growth 2025-2030 (%)

12.3.3 India - Market size and forecast 2025-2030

Chart on India - Market size and forecast 2025-2030 ($ million)
Data Table on India - Market size and forecast 2025-2030 ($ million)
Chart on India - Year-over-year growth 2025-2030 (%)
Data Table on India - Year-over-year growth 2025-2030 (%)

12.3.4 South Korea - Market size and forecast 2025-2030

Chart on South Korea - Market size and forecast 2025-2030 ($ million)
Data Table on South Korea - Market size and forecast 2025-2030 ($ million)
Chart on South Korea - Year-over-year growth 2025-2030 (%)
Data Table on South Korea - Year-over-year growth 2025-2030 (%)

12.3.5 Australia - Market size and forecast 2025-2030

Chart on Australia - Market size and forecast 2025-2030 ($ million)
Data Table on Australia - Market size and forecast 2025-2030 ($ million)
Chart on Australia - Year-over-year growth 2025-2030 (%)
Data Table on Australia - Year-over-year growth 2025-2030 (%)

12.3.6 Indonesia - Market size and forecast 2025-2030

Chart on Indonesia - Market size and forecast 2025-2030 ($ million)
Data Table on Indonesia - Market size and forecast 2025-2030 ($ million)
Chart on Indonesia - Year-over-year growth 2025-2030 (%)
Data Table on Indonesia - Year-over-year growth 2025-2030 (%)

12.4 Europe - Market size and forecast 2025-2030

Chart on Europe - Market size and forecast 2025-2030 ($ million)
Data Table on Europe - Market size and forecast 2025-2030 ($ million)
Chart on Europe - Year-over-year growth 2025-2030 (%)
Data Table on Europe - Year-over-year growth 2025-2030 (%)
Chart on Regional Comparison - Europe
Data Table on Regional Comparison - Europe

12.4.1 Germany - Market size and forecast 2025-2030

Chart on Germany - Market size and forecast 2025-2030 ($ million)
Data Table on Germany - Market size and forecast 2025-2030 ($ million)
Chart on Germany - Year-over-year growth 2025-2030 (%)
Data Table on Germany - Year-over-year growth 2025-2030 (%)

12.4.2 UK - Market size and forecast 2025-2030

Chart on UK - Market size and forecast 2025-2030 ($ million)
Data Table on UK - Market size and forecast 2025-2030 ($ million)
Chart on UK - Year-over-year growth 2025-2030 (%)
Data Table on UK - Year-over-year growth 2025-2030 (%)

12.4.3 France - Market size and forecast 2025-2030

Chart on France - Market size and forecast 2025-2030 ($ million)
Data Table on France - Market size and forecast 2025-2030 ($ million)
Chart on France - Year-over-year growth 2025-2030 (%)
Data Table on France - Year-over-year growth 2025-2030 (%)

12.4.4 Italy - Market size and forecast 2025-2030

Chart on Italy - Market size and forecast 2025-2030 ($ million)
Data Table on Italy - Market size and forecast 2025-2030 ($ million)
Chart on Italy - Year-over-year growth 2025-2030 (%)
Data Table on Italy - Year-over-year growth 2025-2030 (%)

12.4.5 Spain - Market size and forecast 2025-2030

Chart on Spain - Market size and forecast 2025-2030 ($ million)
Data Table on Spain - Market size and forecast 2025-2030 ($ million)
Chart on Spain - Year-over-year growth 2025-2030 (%)
Data Table on Spain - Year-over-year growth 2025-2030 (%)

12.4.6 The Netherlands - Market size and forecast 2025-2030

Chart on The Netherlands - Market size and forecast 2025-2030 ($ million)
Data Table on The Netherlands - Market size and forecast 2025-2030 ($ million)
Chart on The Netherlands - Year-over-year growth 2025-2030 (%)
Data Table on The Netherlands - Year-over-year growth 2025-2030 (%)

12.5 Middle East and Africa - Market size and forecast 2025-2030

Chart on Middle East and Africa - Market size and forecast 2025-2030 ($ million)
Data Table on Middle East and Africa - Market size and forecast 2025-2030 ($ million)
Chart on Middle East and Africa - Year-over-year growth 2025-2030 (%)
Data Table on Middle East and Africa - Year-over-year growth 2025-2030 (%)
Chart on Regional Comparison - Middle East and Africa
Data Table on Regional Comparison - Middle East and Africa

12.5.1 Saudi Arabia - Market size and forecast 2025-2030

Chart on Saudi Arabia - Market size and forecast 2025-2030 ($ million)
Data Table on Saudi Arabia - Market size and forecast 2025-2030 ($ million)
Chart on Saudi Arabia - Year-over-year growth 2025-2030 (%)
Data Table on Saudi Arabia - Year-over-year growth 2025-2030 (%)

12.5.2 UAE - Market size and forecast 2025-2030

Chart on UAE - Market size and forecast 2025-2030 ($ million)
Data Table on UAE - Market size and forecast 2025-2030 ($ million)
Chart on UAE - Year-over-year growth 2025-2030 (%)
Data Table on UAE - Year-over-year growth 2025-2030 (%)

12.5.3 South Africa - Market size and forecast 2025-2030

Chart on South Africa - Market size and forecast 2025-2030 ($ million)
Data Table on South Africa - Market size and forecast 2025-2030 ($ million)
Chart on South Africa - Year-over-year growth 2025-2030 (%)
Data Table on South Africa - Year-over-year growth 2025-2030 (%)

12.5.4 Israel - Market size and forecast 2025-2030

Chart on Israel - Market size and forecast 2025-2030 ($ million)
Data Table on Israel - Market size and forecast 2025-2030 ($ million)
Chart on Israel - Year-over-year growth 2025-2030 (%)
Data Table on Israel - Year-over-year growth 2025-2030 (%)

12.5.5 Turkey - Market size and forecast 2025-2030

Chart on Turkey - Market size and forecast 2025-2030 ($ million)
Data Table on Turkey - Market size and forecast 2025-2030 ($ million)
Chart on Turkey - Year-over-year growth 2025-2030 (%)
Data Table on Turkey - Year-over-year growth 2025-2030 (%)

12.6 North America - Market size and forecast 2025-2030

Chart on North America - Market size and forecast 2025-2030 ($ million)
Data Table on North America - Market size and forecast 2025-2030 ($ million)
Chart on North America - Year-over-year growth 2025-2030 (%)
Data Table on North America - Year-over-year growth 2025-2030 (%)
Chart on Regional Comparison - North America
Data Table on Regional Comparison - North America

12.6.1 US - Market size and forecast 2025-2030

Chart on US - Market size and forecast 2025-2030 ($ million)
Data Table on US - Market size and forecast 2025-2030 ($ million)
Chart on US - Year-over-year growth 2025-2030 (%)
Data Table on US - Year-over-year growth 2025-2030 (%)

12.6.2 Canada - Market size and forecast 2025-2030

Chart on Canada - Market size and forecast 2025-2030 ($ million)
Data Table on Canada - Market size and forecast 2025-2030 ($ million)
Chart on Canada - Year-over-year growth 2025-2030 (%)
Data Table on Canada - Year-over-year growth 2025-2030 (%)

12.6.3 Mexico - Market size and forecast 2025-2030

Chart on Mexico - Market size and forecast 2025-2030 ($ million)
Data Table on Mexico - Market size and forecast 2025-2030 ($ million)
Chart on Mexico - Year-over-year growth 2025-2030 (%)
Data Table on Mexico - Year-over-year growth 2025-2030 (%)

12.7 South America - Market size and forecast 2025-2030

Chart on South America - Market size and forecast 2025-2030 ($ million)
Data Table on South America - Market size and forecast 2025-2030 ($ million)
Chart on South America - Year-over-year growth 2025-2030 (%)
Data Table on South America - Year-over-year growth 2025-2030 (%)
Chart on Regional Comparison - South America
Data Table on Regional Comparison - South America

12.7.1 Brazil - Market size and forecast 2025-2030

Chart on Brazil - Market size and forecast 2025-2030 ($ million)
Data Table on Brazil - Market size and forecast 2025-2030 ($ million)
Chart on Brazil - Year-over-year growth 2025-2030 (%)
Data Table on Brazil - Year-over-year growth 2025-2030 (%)

12.7.2 Argentina - Market size and forecast 2025-2030

Chart on Argentina - Market size and forecast 2025-2030 ($ million)
Data Table on Argentina - Market size and forecast 2025-2030 ($ million)
Chart on Argentina - Year-over-year growth 2025-2030 (%)
Data Table on Argentina - Year-over-year growth 2025-2030 (%)

12.7.3 Chile - Market size and forecast 2025-2030

Chart on Chile - Market size and forecast 2025-2030 ($ million)
Data Table on Chile - Market size and forecast 2025-2030 ($ million)
Chart on Chile - Year-over-year growth 2025-2030 (%)
Data Table on Chile - Year-over-year growth 2025-2030 (%)

12.8 Market opportunity by geography

Market opportunity by geography ($ million)
Data Tables on Market opportunity by geography ($ million)

13. Drivers, Challenges, and Opportunity

13.1 Market drivers

Grid expansion initiatives are accelerating market growth
Favourable government support policies are expediting market growth
Higher adoption of hybrid power systems

13.2 Market challenges

High initial PV system cost is obstructing market growth
Poor efficiency of solar power
Low awareness about alternative sustainable technology

13.3 Impact of drivers and challenges

Impact of drivers and challenges in 2025 and 2030

13.4 Market opportunities

Rise in demand of PAYG model
Increasing grid electrification is augmenting market growth
Continuous decline in technology costs

14. Competitive Landscape

14.1 Overview

14.2

Overview on criticality of inputs and factors of differentiation

14.3 Landscape disruption

Overview on factors of disruption

14.4 Industry risks

Impact of key risks on business

15. Competitive Analysis

15.1 Companies profiled

Companies covered

15.2 Company ranking index

15.3 Market positioning of companies

Matrix on companies position and classification

15.4 d.light design Inc.

d.light design Inc. - Overview
d.light design Inc. - Product / Service
d.light design Inc. - Key offerings
SWOT

15.5 Enphase Energy Inc.

Enphase Energy Inc. - Overview
Enphase Energy Inc. - Product / Service
Enphase Energy Inc. - Key news
Enphase Energy Inc. - Key offerings
SWOT

15.6 GoodWe Technologies Co. Ltd.

GoodWe Technologies Co. Ltd. - Overview
GoodWe Technologies Co. Ltd. - Product / Service
GoodWe Technologies Co. Ltd. - Key offerings
SWOT

15.7 Growatt New Energy

Growatt New Energy - Overview
Growatt New Energy - Product / Service
Growatt New Energy - Key offerings
SWOT

15.8 Huawei Technologies Co. Ltd.

Huawei Technologies Co. Ltd. - Overview
Huawei Technologies Co. Ltd. - Product / Service
Huawei Technologies Co. Ltd. - Key offerings
SWOT

15.9 Jakson Group

Jakson Group - Overview
Jakson Group - Product / Service
Jakson Group - Key offerings
SWOT

15.10 Loom Solar Pvt. Ltd.

Loom Solar Pvt. Ltd. - Overview
Loom Solar Pvt. Ltd. - Product / Service
Loom Solar Pvt. Ltd. - Key offerings
SWOT

15.11 Morningstar Corp.

Morningstar Corp. - Overview
Morningstar Corp. - Product / Service
Morningstar Corp. - Key offerings
SWOT

15.12 OutBack Power Inc.

OutBack Power Inc. - Overview
OutBack Power Inc. - Product / Service
OutBack Power Inc. - Key offerings
SWOT

15.13 RENOGY

RENOGY - Overview
RENOGY - Product / Service
RENOGY - Key offerings
SWOT

15.14 Schneider Electric SE

Schneider Electric SE - Overview
Schneider Electric SE - Business segments
Schneider Electric SE - Key news
Schneider Electric SE - Key offerings
Schneider Electric SE - Segment focus
SWOT

15.15 SMA Solar Technology AG

SMA Solar Technology AG - Overview
SMA Solar Technology AG - Business segments
SMA Solar Technology AG - Key offerings
SMA Solar Technology AG - Segment focus
SWOT

15.16 Sun King

Sun King - Overview
Sun King - Product / Service
Sun King - Key offerings
SWOT

15.17 Sungrow Power Supply Co. Ltd.

Sungrow Power Supply Co. Ltd. - Overview
Sungrow Power Supply Co. Ltd. - Product / Service
Sungrow Power Supply Co. Ltd. - Key offerings
SWOT

15.18 Tesla Inc.

Tesla Inc. - Overview
Tesla Inc. - Business segments
Tesla Inc. - Key offerings
Tesla Inc. - Segment focus
SWOT

16. Appendix

16.1 Scope of the report

Market definition
Objectives
Notes and caveats

16.2 Inclusions and exclusions checklist

Inclusions checklist
Exclusions checklist

16.3 Currency conversion rates for US$

16.4 Research methodology

16.5 Data procurement

Information sources

16.6 Data validation

16.7 Validation techniques employed for market sizing

16.8 Data synthesis

16.9 360 degree market analysis

16.10 List of abbreviations

Research Methodology

Technavio presents a detailed picture of the market by way of study, synthesis, and summation of data from multiple sources. The analysts have presented the various facets of the market with a particular focus on identifying the key industry influencers. The data thus presented is comprehensive, reliable, and the result of extensive research, both primary and secondary.

INFORMATION SOURCES

Primary sources

  • Manufacturers and suppliers
  • Channel partners
  • Industry experts
  • Strategic decision makers

Secondary sources

  • Industry journals and periodicals
  • Government data
  • Financial reports of key industry players
  • Historical data
  • Press releases

DATA ANALYSIS

Data Synthesis

  • Collation of data
  • Estimation of key figures
  • Analysis of derived insights

Data Validation

  • Triangulation with data models
  • Reference against proprietary databases
  • Corroboration with industry experts

REPORT WRITING

Qualitative

  • Market drivers
  • Market challenges
  • Market trends
  • Five forces analysis

Quantitative

  • Market size and forecast
  • Market segmentation
  • Geographical insights
  • Competitive landscape

Interested in this report?

Get your sample now to see our research methodology and insights!

Download Now

Frequently Asked Questions

Off-Grid Solar Power Systems market growth will increase by USD 5992.5 million during 2026-2030.

The Off-Grid Solar Power Systems market is expected to grow at a CAGR of 14.9% during 2026-2030.

Off-Grid Solar Power Systems market is segmented by Type (AC, DC) Application (Non-residential, Residential) Component (Solar panels, Batteries, Inverters, Others)

Bluetti Power Inc., d.light design Inc., EcoFlow, Enphase Energy Inc., GoodWe Technologies Co. Ltd., Growatt New Energy, Huawei Technologies Co. Ltd., Jakson Group, Loom Solar Pvt. Ltd., Morningstar Corp., OutBack Power Inc., RENOGY, Schneider Electric SE, SMA Solar Technology AG, Sol Ark Inc, Steca Elektronik GmbH, Su Kam Power Systems Ltd, Sun King, Sungrow Power Supply Co. Ltd., Tesla Inc., Victron Energy BV are a few of the key vendors in the Off-Grid Solar Power Systems market.

APAC will register the highest growth rate of 50.7% among the other regions. Therefore, the Off-Grid Solar Power Systems market in APAC is expected to garner significant business opportunities for the vendors during the forecast period.

China, Japan, India, South Korea, Australia, Indonesia, Germany, UK, France, Italy, Spain, The Netherlands, Saudi Arabia, UAE, South Africa, Israel, Turkey, US, Canada, Mexico, Brazil, Argentina, Chile

  • Grid expansion initiatives are accelerating market growth is the driving factor this market.

The Off-Grid Solar Power Systems market vendors should focus on grabbing business opportunities from the Type segment as it accounted for the largest market share in the base year.
RIA - Research AI Assistant
Ask RIA