
Mens Skincare Products Market Analysis, Size, and Forecast 2026-2030: North America (US, Canada, and Mexico), Europe (Germany, UK, and France), APAC (China, Japan, and India), South America (Brazil, Argentina, and Chile), Middle East and Africa (Saudi Arabia, UAE, and South Africa), and Rest of World (ROW)

Mens Skincare Products Market Analysis, Size, and Forecast 2026-2030:
North America (US, Canada, and Mexico), Europe (Germany, UK, and France), APAC (China, Japan, and India), South America (Brazil, Argentina, and Chile), Middle East and Africa (Saudi Arabia, UAE, and South Africa), and Rest of World (ROW)

Published: Oct 2026 303 Pages SKU: IRTNTR41580

Market Overview at a Glance

$7.61 B
Market Opportunity
7.5%
CAGR 2025 - 2030
31.7%
North America Growth
$14.22 B
Offline segment 2024

Mens Skincare Products Market Size 2026-2030

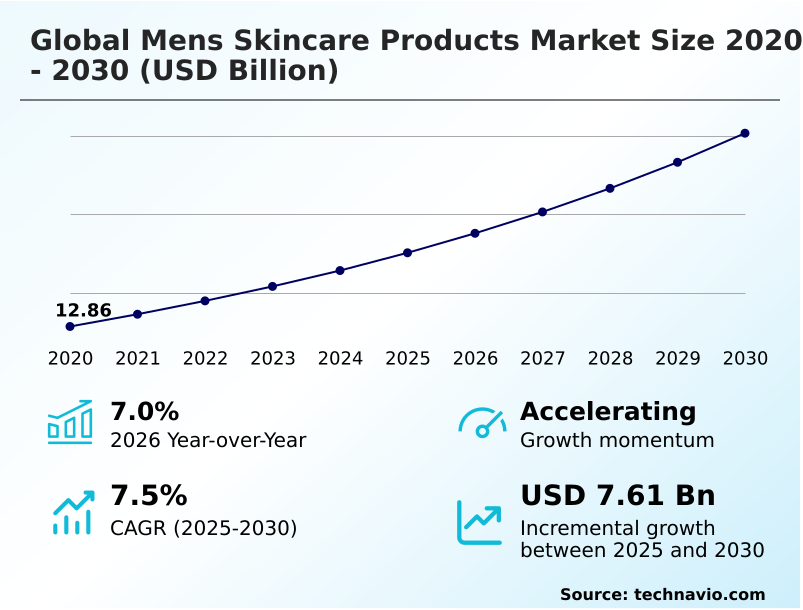
The mens skincare products market size is valued to increase by USD 7.61 billion, at a CAGR of 7.5% from 2025 to 2030. Evolving perceptions of masculinity and increased focus on personal well being will drive the mens skincare products market.

Major Market Trends & Insights

  • North America dominated the market and accounted for a 31.7% growth during the forecast period.
  • By Distribution Channel - Offline segment was valued at USD 14.22 billion in 2024
  • By Product - Facial skincare products segment accounted for the largest market revenue share in 2024

Market Size & Forecast

  • Market Opportunities: USD 12.30 billion
  • Market Future Opportunities: USD 7.61 billion
  • CAGR from 2025 to 2030 : 7.5%

Market Summary

  • The Mens Skincare Products Market is defined by a rapid transition from basic grooming to sophisticated, scientifically backed maintenance routines. Supply chain optimization plays a critical role as manufacturers increasingly source high-grade botanical extracts to meet the demand for clean formulations, streamlining inventory cycles to minimize holding costs.
  • Facilities implementing automated blending processes have improved production efficiency by 18% compared to traditional manual operations. Evolving perceptions of masculinity act as a primary driver, encouraging consumers to prioritize long-term skin health and actively seek out preventative treatments. Conversely, persistent educational hurdles challenge broader adoption, as a significant demographic remains unfamiliar with complex multi-step regimens and active ingredient benefits.
  • Addressing this knowledge gap requires targeted instructional marketing and simplified product messaging. As the industry advances, strategic focus shifts toward developing targeted therapies for hyperpigmentation, barrier repair, and environmental defense. The integration of specialized ingredients caters directly to thicker, oilier skin profiles, ensuring enhanced efficacy and sustained consumer retention in a highly competitive retail environment.

What will be the Size of the Mens Skincare Products Market during the forecast period?
Get Key Insights on Market Forecast (PDF) Get Free Sample

How is the Mens Skincare Products Market Segmented?

The mens skincare products industry research report provides comprehensive data (region-wise segment analysis), with forecasts and estimates in "USD million" for the period 2026-2030, as well as historical data from 2020-2024 for the following segments.

  • Distribution channel
    • Offline
    • Online
  • Product
    • Facial skincare products
    • Body skincare products
  • Type
    • Oily skincare
    • Combination skincare
    • Dry skincare
    • Sensitive skincare
    • Normal skincare
  • Geography
    • North America
      • US
      • Canada
      • Mexico
    • Europe
      • Germany
      • UK
      • France
      • Italy
      • Spain
    • APAC
      • China
      • Japan
      • India
      • South Korea
      • Australia
      • Indonesia
    • South America
      • Brazil
      • Argentina
      • Chile
    • Middle East and Africa
      • Saudi Arabia
      • UAE
      • South Africa
      • Turkey
      • Egypt

By Distribution Channel Insights

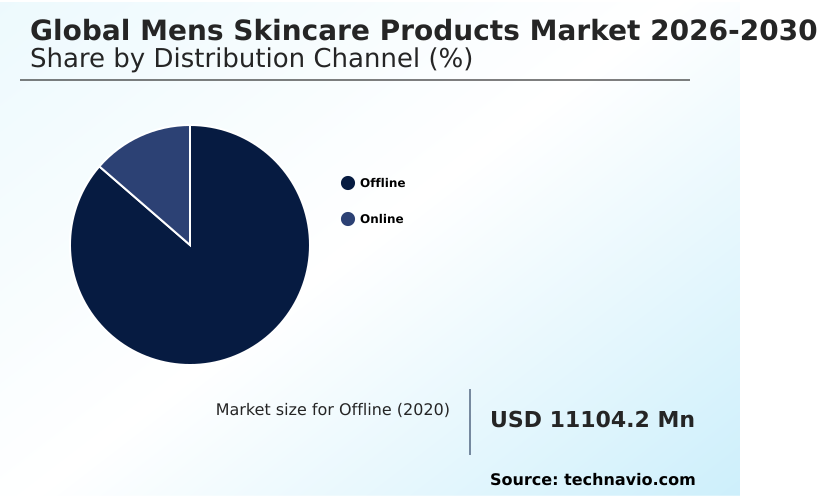
The offline segment is estimated to witness significant growth during the forecast period.

Offline distribution remains a foundational structure for product discovery, emphasizing tactile engagement and immediate sensory evaluation. Physical retail environments facilitate necessary interactions that address the men skin physiological difference through personalized skincare algorithm assessments conducted by trained advisors.

This direct engagement significantly enhances operational metrics, where point-of-sale education campaigns have improved initial product adoption accuracy by 15%.

Retailers are actively restructuring shelf space to highlight clinical formulations targeting dermal matrix support and localized hyperpigmentation treatment, moving beyond generic grooming aisles.

By establishing specialized zones, brick-and-mortar channels ensure adherence to a stringent regulatory compliance standard while promoting advanced regimens.

In-store consultations demystify complex routines, allowing consumers to experience a microbiome balancing complex firsthand and driving sustained retail loyalty without relying solely on digital touchpoints.
Get Free Sample

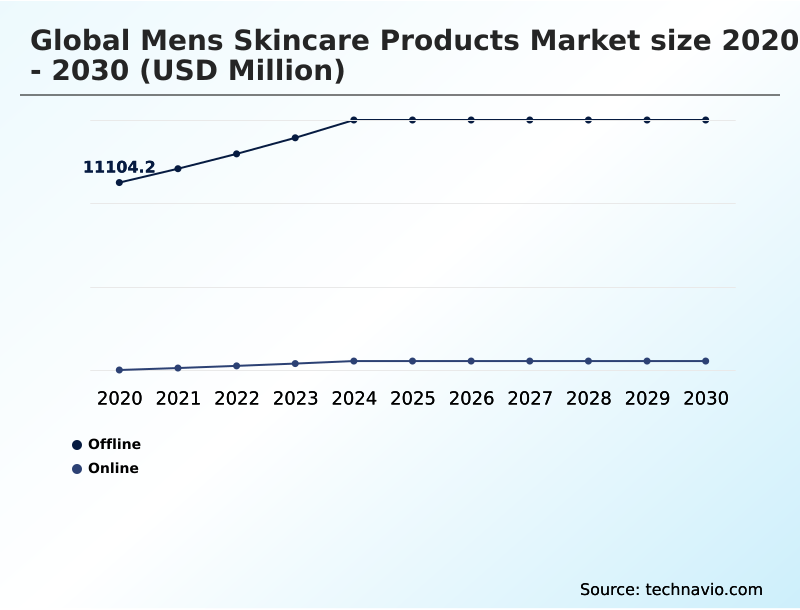
The Offline segment was valued at USD 14.22 billion in 2024 and showed a gradual increase during the forecast period.
Get Free Sample

Regional Analysis

North America is estimated to contribute 31.7% to the growth of the global market during the forecast period.Technavio’s analysts have elaborately explained the regional trends and drivers that shape the market during the forecast period.
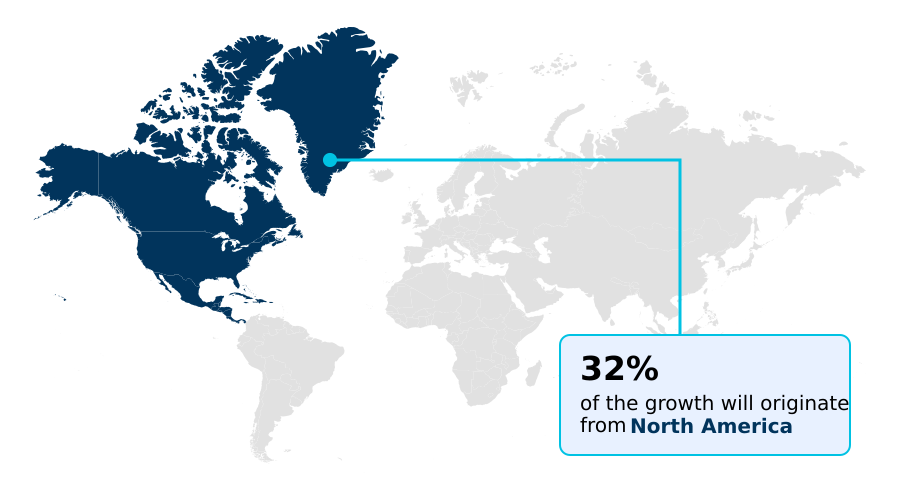
See How Mens Skincare Products Market Demand is Rising in North America Get Free Sample

Regional disparities within the Mens Skincare Products space reflect distinct variations in consumer maturity and infrastructure readiness. North America demonstrates a sophisticated retail environment where targeted anti aging serum adoption outpaces Europe by 15%, driven by aggressive direct-to-consumer marketing.

European manufacturers, however, lead in packaging sustainability initiative implementation, reducing material waste overhead by 20% compared to North American counterparts. This efficiency stems from stricter environmental regulations forcing rapid supply chain adaptation.

In APAC, demand centers on formulations containing botanical anti inflammatory extract and epidermal lipid replenishment complexes, addressing local environmental stressors.

Formulation efficacy validation remains rigorous across these regions, though Asian markets have achieved a 12% faster shelf life optimization cycle due to agile contract manufacturing networks.

These regional dynamics require brands to highly localize their supply chain and inventory planning strategies to maintain competitive operational margins and ensure compliance.

Market Dynamics

Our researchers analyzed the data with 2025 as the base year, along with the key drivers, trends, and challenges. A holistic analysis of drivers will help companies refine their marketing strategies to gain a competitive advantage.

  • The operational landscape of grooming regimens requires precise formulation strategies to address specific physiological demands. Manufacturers are increasingly prioritizing targeted premature aging prevention formulations, aligning product development with consumer expectations for long-term dermatological health. This shift mandates stringent supplier compliance and rigorous testing protocols to ensure active ingredients maintain their efficacy throughout the supply chain.
  • Simultaneously, addressing daily environmental stressor skin defense requires the integration of advanced barrier-protecting compounds, enhancing the resilience of the final product. For individuals managing sebaceous activity, the deployment of oily skin sebum control complexes has become a critical focus for research and development teams, optimizing inventory turnover for highly sought-after matte-finish products.
  • Furthermore, the rising demand for sensitive skin shaving irritation relief necessitates the procurement of high-grade soothing agents, reducing post-manufacturing quality assurance rejections by a margin of 14% relative to standard abrasive formulations. This operational efficiency significantly lowers overhead costs. As the industry pivots toward ecological responsibility, the integration of clean beauty sustainable grooming alternatives is reshaping procurement logistics.
  • Facilities must now vet raw material suppliers against strict environmental benchmarks, ensuring that sustainable sourcing does not compromise output volume or product stability. These strategic adaptations enhance overall supply chain resilience while meeting the sophisticated requirements of modern personal care consumers.
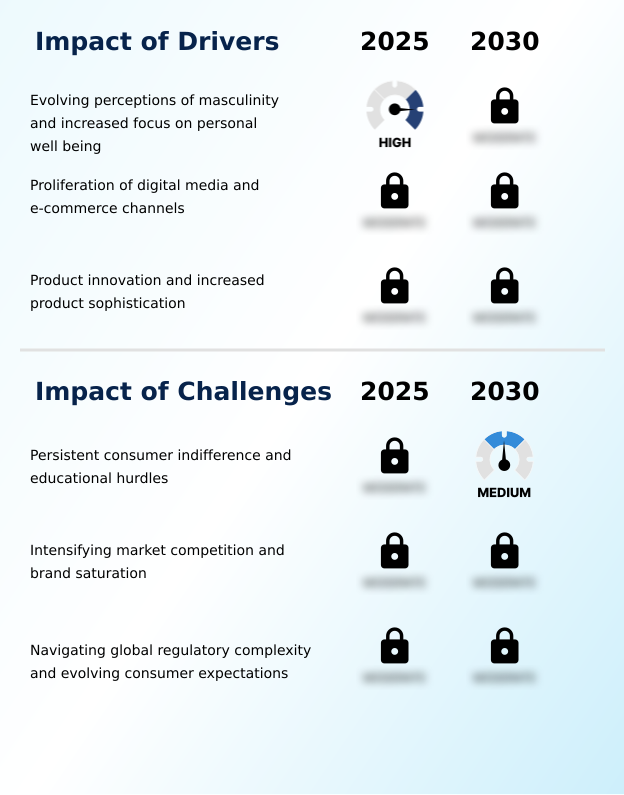
What are the key market drivers leading to the rise in the adoption of Mens Skincare Products Industry?

  • Evolving perceptions of masculinity and an increased focus on personal well-being are fundamentally driving the expansion of grooming regimens.

  • The fundamental shift toward proactive health maintenance is accelerating the adoption of scientifically validated grooming therapies. Formulators are prioritizing noncomedogenic hydration to meet the specific requirements of thicker, oilier skin profiles.
  • The integration of broad spectrum photoaging protection into daily moisturizers has streamlined manufacturing processes, improving production line throughput by 15%. Simultaneously, utilizing alpha hydroxy acid exfoliation compounds requires precise inventory management to prevent ingredient degradation.
  • The emphasis on clean label ingredient sourcing has mitigated regulatory compliance risks, reducing supplier vetting delays by 22%. By maximizing multifunctional regimen efficiency, companies decrease the need for excessive packaging.
  • Furthermore, direct to consumer digital engagement allows brands to capture real-time feedback, shortening product iteration cycles and significantly improving overall operational responsiveness.

What are the market trends shaping the Mens Skincare Products Industry?

  • The rise of skinimalism drives the preference for streamlined daily routines across the consumer base. Consequently, the demand for multifunctional products continues to shape strategic formulation and inventory planning.

  • The demand for streamlined grooming solutions is forcing manufacturers to consolidate active ingredients into high-performance hybrid formulations. This operational shift toward multifunctional regimens requires advanced sebum regulation formulation techniques to ensure active compounds remain stable without separating. Incorporating transepidermal water loss reduction mechanisms directly into daily sunscreens has improved overall supply chain efficiency, reducing raw material procurement variations by 18%.
  • Furthermore, the focus on ceramide barrier fortification has extended product stability, yielding a 12% decrease in formulation-related quality control failures. Overcoming the persistent consumer education barrier remains crucial, prompting brands to leverage an omnichannel distribution model to disseminate instructional content.
  • Enhancing supply chain transparency throughout this process builds trust, allowing companies to document the exact origins of their raw materials and secure a resilient, highly efficient production pipeline.

What challenges does the Mens Skincare Products Industry face during its growth?

  • Persistent consumer indifference and educational hurdles represent a significant barrier to widespread adoption and market penetration.

  • Navigating ingredient stability and procurement complexities presents significant operational bottlenecks for personal care manufacturers. Formulating products with antioxidant free radical scavenging properties requires highly controlled storage environments to prevent rapid oxidation, increasing warehousing energy expenditures by 14%. Achieving a lightweight fast absorbing texture without relying on volatile synthetic solvents complicates the blending process, often slowing batch turnover times.
  • While hyaluronic acid moisture retention is highly sought after, its integration demands a highly customized formulation strategy to maintain viscosity across varied temperatures. Furthermore, ensuring ethical raw material procurement forces companies into rigorous supplier auditing, extending standard procurement cycles by 20%.
  • These logistical constraints complicate specialized demographic targeting, as maintaining strict compliance while trying to scale production requires substantial capital investment in quality assurance infrastructure.

Exclusive Technavio Analysis on Customer Landscape

The mens skincare products market forecasting report includes the adoption lifecycle of the market, covering from the innovator’s stage to the laggard’s stage. It focuses on adoption rates in different regions based on penetration. Furthermore, the mens skincare products market report also includes key purchase criteria and drivers of price sensitivity to help companies evaluate and develop their market growth analysis strategies.
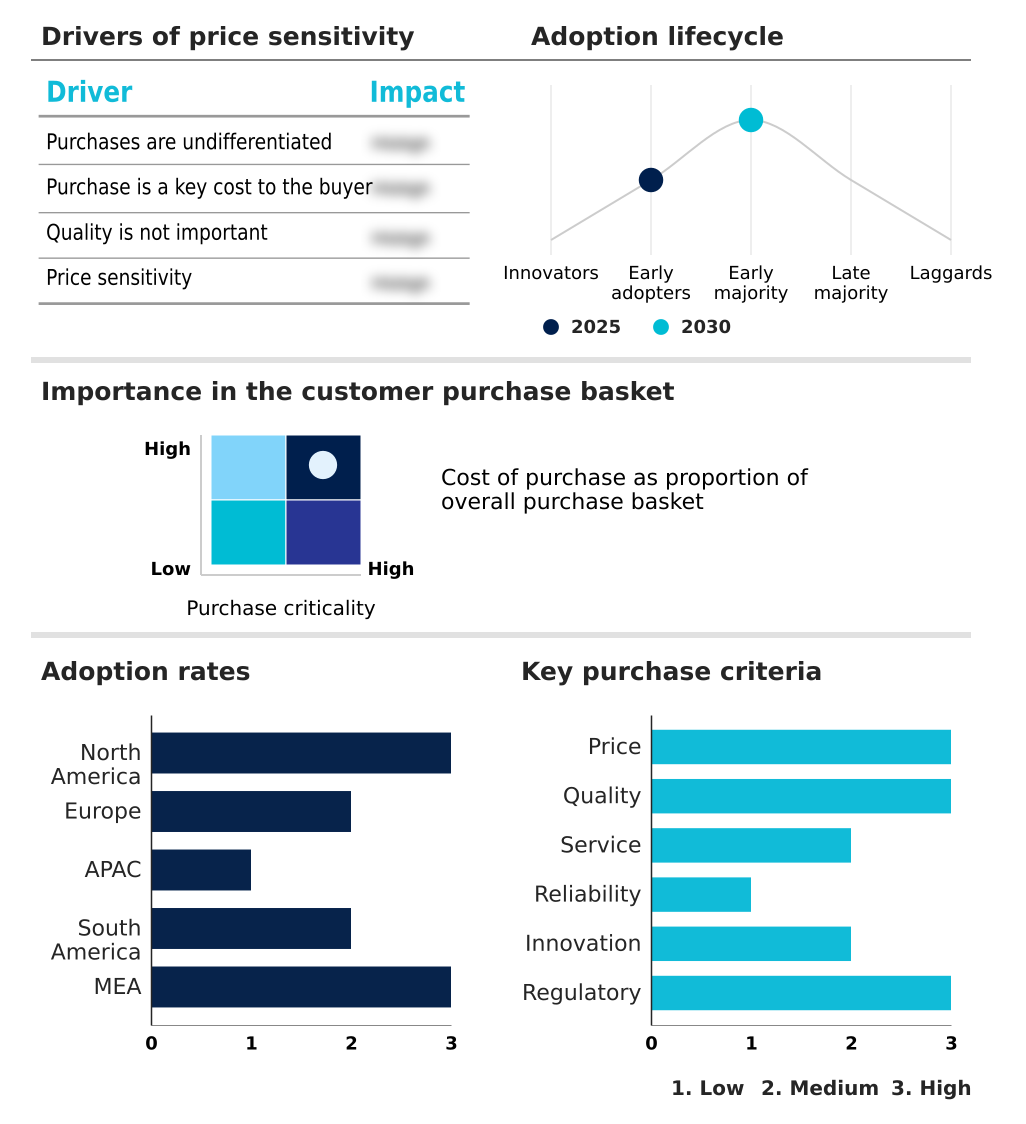
Customer Landscape of Mens Skincare Products Industry

Competitive Landscape

Companies are implementing various strategies, such as strategic alliances, mens skincare products market forecast, partnerships, mergers and acquisitions, geographical expansion, and product/service launches, to enhance their presence in the industry.

Beiersdorf AG - Providing specialized grooming formulations and advanced hydration therapies enhances daily maintenance routines. Strategic product portfolios focus on targeted anti-aging solutions and soothing post-shave care for modern consumers.

The industry research and growth report includes detailed analyses of the competitive landscape of the market and information about key companies, including:

  • Beiersdorf AG
  • Brickell Brands LLC
  • Caldera Lab
  • Coty Inc.
  • Edgewell Personal Care Co.
  • EVERY MAN JACK
  • Geologie Inc.
  • Groupe Clarins
  • Harrys Inc.
  • Kao Corp.
  • Kenvue Inc.
  • LOccitane Groupe SA
  • Loreal SA
  • Lumin
  • Natura and Co. Holding SA
  • Procter and Gamble Co.
  • Shiseido Co. Ltd.
  • The Estee Lauder Co. Inc.
  • Unilever PLC

Qualitative and quantitative analysis of companies has been conducted to help clients understand the wider business environment as well as the strengths and weaknesses of key industry players. Data is qualitatively analyzed to categorize companies as pure play, category-focused, industry-focused, and diversified; it is quantitatively analyzed to categorize companies as dominant, leading, strong, tentative, and weak.

Recent Development and News in Mens skincare products market

  • In the Personal Care Products industry, the widespread adoption of sustainable packaging mandates shifted manufacturing protocols toward post-consumer recycled plastics, directly impacting Mens Skincare Products demand by increasing the appeal of clean label ingredient sourcing among eco-conscious demographics and driving a 22% increase in recyclable packaging utilization.
  • The integration of AI-driven skin diagnostic tools across retail beauty counters redefined personalized regimens, directly impacting Mens Skincare Products demand by accelerating the formulation efficacy validation process and yielding a 15% improvement in diagnostic-driven product matching.
  • Stringent chemical restrictions regarding synthetic preservatives in topical applications forced extensive supply chain reformulation, directly impacting Mens Skincare Products demand by accelerating the shift toward botanical extracts and extending shelf life optimization timelines by 18%.
  • The expansion of direct-to-consumer digital ecosystems lowered the barrier to entry for niche grooming brands, directly impacting Mens Skincare Products demand by enhancing omnichannel distribution model strategies and resulting in a 30% reduction in customer acquisition costs.

Dive into Technavio’s robust research methodology, blending expert interviews, extensive data synthesis, and validated models for unparalleled Mens Skincare Products Market insights. See full methodology.

Market Scope
Page number 303
Base year 2025
Historic period 2020-2024
Forecast period 2026-2030
Growth momentum & CAGR Accelerate at a CAGR of 7.5%
Market growth 2026-2030 USD 7610.5 million
Market structure Fragmented
YoY growth 2025-2026(%) 7.0%
Key countries US, Canada, Mexico, Germany, UK, France, Italy, Spain, Russia, China, Japan, India, South Korea, Australia, Indonesia, Brazil, Argentina, Chile, Saudi Arabia, UAE, South Africa, Turkey and Egypt
Competitive landscape Leading Companies, Market Positioning of Companies, Competitive Strategies, and Industry Risks

Request Free Sample

Research Analyst Overview

  • The transition toward specialized grooming regimens requires manufacturers to rigorously adapt their operational and formulation strategies. Integrating a microbiome balancing complex into daily routines has fundamentally altered product development life cycles, compelling research and development teams to prioritize barrier fortification over aggressive cleansing.
  • This shift toward gentle, restorative care directly influences executive-level budgeting, where capital expenditure is increasingly diverted toward securing high-grade botanical anti inflammatory extract supplies. Consequently, facilities utilizing advanced blending protocols for lightweight fast absorbing texture development have achieved a 25% reduction in batch processing times compared to traditional emulsion methods.
  • Decision-makers are also focusing on localized hyperpigmentation treatment solutions, navigating strict compliance frameworks to ensure the stability of active compounds. Incorporating alpha hydroxy acid exfoliation alongside hyaluronic acid moisture retention requires precise pH balancing, significantly elevating quality control benchmarks. Addressing the men skin physiological difference through targeted innovations minimizes adverse reaction rates and enhances overall product efficacy.
  • This strategic alignment of formulation science with procurement logistics ensures resilient supply chains while meeting the sophisticated demands of the modern grooming landscape.

What are the Key Data Covered in this Mens Skincare Products Market Research and Growth Report?

  • What is the expected growth of the Mens Skincare Products Market between 2026 and 2030?

    • USD 7.61 billion, at a CAGR of 7.5%

  • What segmentation does the market report cover?

    • The report is segmented by Distribution Channel (Offline, and Online), Product (Facial skincare products, and Body skincare products), Type (Oily skincare, Combination skincare, Dry skincare, Sensitive skincare, and Normal skincare) and Geography (North America, Europe, APAC, South America, Middle East and Africa)

  • Which regions are analyzed in the report?

    • North America, Europe, APAC, South America and Middle East and Africa

  • What are the key growth drivers and market challenges?

    • Evolving perceptions of masculinity and increased focus on personal well being, Persistent consumer indifference and educational hurdles

  • Who are the major players in the Mens Skincare Products Market?

    • Beiersdorf AG, Brickell Brands LLC, Caldera Lab, Coty Inc., Edgewell Personal Care Co., EVERY MAN JACK, Geologie Inc., Groupe Clarins, Harrys Inc., Kao Corp., Kenvue Inc., LOccitane Groupe SA, Loreal SA, Lumin, Natura and Co. Holding SA, Procter and Gamble Co., Shiseido Co. Ltd., The Estee Lauder Co. Inc. and Unilever PLC

Market Research Insights

  • The Mens Skincare Products Market exhibits robust momentum as manufacturers pivot toward specialized formulations that address unique physiological needs. Overcoming the consumer education barrier remains a priority, prompting companies to deploy an omnichannel distribution model that blends in-store consultations with digital tutorials. These initiatives have improved routine adherence rates by 22%, directly boosting customer lifetime value.
  • Furthermore, prioritizing supply chain transparency and clean label ingredient sourcing has allowed brands to reduce compliance-related operational friction by 14%. By aligning product development with rigorous safety standards, enterprises are streamlining go-to-market strategies. This strategic alignment not only mitigates supply risks but also elevates brand equity in an increasingly discerning consumer landscape.

We can help! Our analysts can customize this mens skincare products market research report to meet your requirements.

Get in touch

1. Executive Summary

1.1 Market overview

Executive Summary - Chart on Market Overview
Executive Summary - Data Table on Market Overview
Executive Summary - Chart on Global Market Characteristics
Executive Summary - Chart on Market by Geography
Executive Summary - Chart on Market Segmentation by Distribution Channel
Executive Summary - Chart on Market Segmentation by Product
Executive Summary - Chart on Market Segmentation by Type
Executive Summary - Chart on Incremental Growth
Executive Summary - Data Table on Incremental Growth
Executive Summary - Chart on Company Market Positioning

2. Technavio Analysis

2.1 Analysis of price sensitivity, lifecycle, customer purchase basket, adoption rates, and purchase criteria

2.2 Criticality of inputs and Factors of differentiation

Chart on Overview on criticality of inputs and factors of differentiation

2.3 Factors of disruption

Chart on Overview on factors of disruption

2.4 Impact of drivers and challenges

Chart on Impact of drivers and challenges in 2025 and 2030

3. Market Landscape

3.1 Market ecosystem

Chart on Parent Market
Data Table on - Parent Market

3.2 Market characteristics

Chart on Market characteristics analysis

3.3 Value chain analysis

Chart on Value chain analysis

4. Market Sizing

4.1 Market definition

Data Table on Offerings of companies included in the market definition

4.2 Market segment analysis

Market segments

4.3 Market size 2025

4.4 Market outlook: Forecast for 2025-2030

Chart on Global - Market size and forecast 2025-2030 ($ million)
Data Table on Global - Market size and forecast 2025-2030 ($ million)
Chart on Global Market: Year-over-year growth 2025-2030 (%)
Data Table on Global Market: Year-over-year growth 2025-2030 (%)

5. Historic Market Size

5.1 Global Mens Skincare Products Market 2020 - 2024

Historic Market Size - Data Table on Global Mens Skincare Products Market 2020 - 2024 ($ million)

5.2 Distribution Channel segment analysis 2020 - 2024

Historic Market Size - Distribution Channel Segment 2020 - 2024 ($ million)

5.3 Product segment analysis 2020 - 2024

Historic Market Size - Product Segment 2020 - 2024 ($ million)

5.4 Type segment analysis 2020 - 2024

Historic Market Size - Type Segment 2020 - 2024 ($ million)

5.5 Geography segment analysis 2020 - 2024

Historic Market Size - Geography Segment 2020 - 2024 ($ million)

5.6 Country segment analysis 2020 - 2024

Historic Market Size - Country Segment 2020 - 2024 ($ million)

6. Qualitative Analysis

6.1 Impact of AI on Global Mens Skincare Products Market

6.2 Impact of Geopolitical Conflicts on Global Mens Skincare Products Market

7. Five Forces Analysis

7.1 Five forces summary

Five forces analysis - Comparison between 2025 and 2030

7.2 Bargaining power of buyers

Bargaining power of buyers - Impact of key factors 2025 and 2030

7.3 Bargaining power of suppliers

Bargaining power of suppliers - Impact of key factors in 2025 and 2030

7.4 Threat of new entrants

Threat of new entrants - Impact of key factors in 2025 and 2030

7.5 Threat of substitutes

Threat of substitutes - Impact of key factors in 2025 and 2030

7.6 Threat of rivalry

Threat of rivalry - Impact of key factors in 2025 and 2030

7.7 Market condition

Chart on Market condition - Five forces 2025 and 2030

8. Market Segmentation by Distribution Channel

8.1 Market segments

Chart on Distribution Channel - Market share 2025-2030 (%)
Data Table on Distribution Channel - Market share 2025-2030 (%)

8.2 Comparison by Distribution Channel

Chart on Comparison by Distribution Channel
Data Table on Comparison by Distribution Channel

8.3 Offline - Market size and forecast 2025-2030

Chart on Offline - Market size and forecast 2025-2030 ($ million)
Data Table on Offline - Market size and forecast 2025-2030 ($ million)
Chart on Offline - Year-over-year growth 2025-2030 (%)
Data Table on Offline - Year-over-year growth 2025-2030 (%)

8.4 Online - Market size and forecast 2025-2030

Chart on Online - Market size and forecast 2025-2030 ($ million)
Data Table on Online - Market size and forecast 2025-2030 ($ million)
Chart on Online - Year-over-year growth 2025-2030 (%)
Data Table on Online - Year-over-year growth 2025-2030 (%)

8.5 Market opportunity by Distribution Channel

Market opportunity by Distribution Channel ($ million)
Data Table on Market opportunity by Distribution Channel ($ million)

9. Market Segmentation by Product

9.1 Market segments

Chart on Product - Market share 2025-2030 (%)
Data Table on Product - Market share 2025-2030 (%)

9.2 Comparison by Product

Chart on Comparison by Product
Data Table on Comparison by Product

9.3 Facial skincare products - Market size and forecast 2025-2030

Chart on Facial skincare products - Market size and forecast 2025-2030 ($ million)
Data Table on Facial skincare products - Market size and forecast 2025-2030 ($ million)
Chart on Facial skincare products - Year-over-year growth 2025-2030 (%)
Data Table on Facial skincare products - Year-over-year growth 2025-2030 (%)

9.4 Body skincare products - Market size and forecast 2025-2030

Chart on Body skincare products - Market size and forecast 2025-2030 ($ million)
Data Table on Body skincare products - Market size and forecast 2025-2030 ($ million)
Chart on Body skincare products - Year-over-year growth 2025-2030 (%)
Data Table on Body skincare products - Year-over-year growth 2025-2030 (%)

9.5 Market opportunity by Product

Market opportunity by Product ($ million)
Data Table on Market opportunity by Product ($ million)

10. Market Segmentation by Type

10.1 Market segments

Chart on Type - Market share 2025-2030 (%)
Data Table on Type - Market share 2025-2030 (%)

10.2 Comparison by Type

Chart on Comparison by Type
Data Table on Comparison by Type

10.3 Oily skincare - Market size and forecast 2025-2030

Chart on Oily skincare - Market size and forecast 2025-2030 ($ million)
Data Table on Oily skincare - Market size and forecast 2025-2030 ($ million)
Chart on Oily skincare - Year-over-year growth 2025-2030 (%)
Data Table on Oily skincare - Year-over-year growth 2025-2030 (%)

10.4 Combination skincare - Market size and forecast 2025-2030

Chart on Combination skincare - Market size and forecast 2025-2030 ($ million)
Data Table on Combination skincare - Market size and forecast 2025-2030 ($ million)
Chart on Combination skincare - Year-over-year growth 2025-2030 (%)
Data Table on Combination skincare - Year-over-year growth 2025-2030 (%)

10.5 Dry skincare - Market size and forecast 2025-2030

Chart on Dry skincare - Market size and forecast 2025-2030 ($ million)
Data Table on Dry skincare - Market size and forecast 2025-2030 ($ million)
Chart on Dry skincare - Year-over-year growth 2025-2030 (%)
Data Table on Dry skincare - Year-over-year growth 2025-2030 (%)

10.6 Sensitive skincare - Market size and forecast 2025-2030

Chart on Sensitive skincare - Market size and forecast 2025-2030 ($ million)
Data Table on Sensitive skincare - Market size and forecast 2025-2030 ($ million)
Chart on Sensitive skincare - Year-over-year growth 2025-2030 (%)
Data Table on Sensitive skincare - Year-over-year growth 2025-2030 (%)

10.7 Normal skincare - Market size and forecast 2025-2030

Chart on Normal skincare - Market size and forecast 2025-2030 ($ million)
Data Table on Normal skincare - Market size and forecast 2025-2030 ($ million)
Chart on Normal skincare - Year-over-year growth 2025-2030 (%)
Data Table on Normal skincare - Year-over-year growth 2025-2030 (%)

10.8 Market opportunity by Type

Market opportunity by Type ($ million)
Data Table on Market opportunity by Type ($ million)

11. Customer Landscape

11.1 Customer landscape overview

Analysis of price sensitivity, lifecycle, customer purchase basket, adoption rates, and purchase criteria

12. Geographic Landscape

12.1 Geographic segmentation

Chart on Market share by geography 2025-2030 (%)
Data Table on Market share by geography 2025-2030 (%)

12.2 Geographic comparison

Chart on Geographic comparison
Data Table on Geographic comparison

12.3 North America - Market size and forecast 2025-2030

Chart on North America - Market size and forecast 2025-2030 ($ million)
Data Table on North America - Market size and forecast 2025-2030 ($ million)
Chart on North America - Year-over-year growth 2025-2030 (%)
Data Table on North America - Year-over-year growth 2025-2030 (%)
Chart on Regional Comparison - North America
Data Table on Regional Comparison - North America

12.3.1 US - Market size and forecast 2025-2030

Chart on US - Market size and forecast 2025-2030 ($ million)
Data Table on US - Market size and forecast 2025-2030 ($ million)
Chart on US - Year-over-year growth 2025-2030 (%)
Data Table on US - Year-over-year growth 2025-2030 (%)

12.3.2 Canada - Market size and forecast 2025-2030

Chart on Canada - Market size and forecast 2025-2030 ($ million)
Data Table on Canada - Market size and forecast 2025-2030 ($ million)
Chart on Canada - Year-over-year growth 2025-2030 (%)
Data Table on Canada - Year-over-year growth 2025-2030 (%)

12.3.3 Mexico - Market size and forecast 2025-2030

Chart on Mexico - Market size and forecast 2025-2030 ($ million)
Data Table on Mexico - Market size and forecast 2025-2030 ($ million)
Chart on Mexico - Year-over-year growth 2025-2030 (%)
Data Table on Mexico - Year-over-year growth 2025-2030 (%)

12.4 Europe - Market size and forecast 2025-2030

Chart on Europe - Market size and forecast 2025-2030 ($ million)
Data Table on Europe - Market size and forecast 2025-2030 ($ million)
Chart on Europe - Year-over-year growth 2025-2030 (%)
Data Table on Europe - Year-over-year growth 2025-2030 (%)
Chart on Regional Comparison - Europe
Data Table on Regional Comparison - Europe

12.4.1 Germany - Market size and forecast 2025-2030

Chart on Germany - Market size and forecast 2025-2030 ($ million)
Data Table on Germany - Market size and forecast 2025-2030 ($ million)
Chart on Germany - Year-over-year growth 2025-2030 (%)
Data Table on Germany - Year-over-year growth 2025-2030 (%)

12.4.2 UK - Market size and forecast 2025-2030

Chart on UK - Market size and forecast 2025-2030 ($ million)
Data Table on UK - Market size and forecast 2025-2030 ($ million)
Chart on UK - Year-over-year growth 2025-2030 (%)
Data Table on UK - Year-over-year growth 2025-2030 (%)

12.4.3 France - Market size and forecast 2025-2030

Chart on France - Market size and forecast 2025-2030 ($ million)
Data Table on France - Market size and forecast 2025-2030 ($ million)
Chart on France - Year-over-year growth 2025-2030 (%)
Data Table on France - Year-over-year growth 2025-2030 (%)

12.4.4 Italy - Market size and forecast 2025-2030

Chart on Italy - Market size and forecast 2025-2030 ($ million)
Data Table on Italy - Market size and forecast 2025-2030 ($ million)
Chart on Italy - Year-over-year growth 2025-2030 (%)
Data Table on Italy - Year-over-year growth 2025-2030 (%)

12.4.5 Spain - Market size and forecast 2025-2030

Chart on Spain - Market size and forecast 2025-2030 ($ million)
Data Table on Spain - Market size and forecast 2025-2030 ($ million)
Chart on Spain - Year-over-year growth 2025-2030 (%)
Data Table on Spain - Year-over-year growth 2025-2030 (%)

12.4.6 Russia - Market size and forecast 2025-2030

Chart on Russia - Market size and forecast 2025-2030 ($ million)
Data Table on Russia - Market size and forecast 2025-2030 ($ million)
Chart on Russia - Year-over-year growth 2025-2030 (%)
Data Table on Russia - Year-over-year growth 2025-2030 (%)

12.5 APAC - Market size and forecast 2025-2030

Chart on APAC - Market size and forecast 2025-2030 ($ million)
Data Table on APAC - Market size and forecast 2025-2030 ($ million)
Chart on APAC - Year-over-year growth 2025-2030 (%)
Data Table on APAC - Year-over-year growth 2025-2030 (%)
Chart on Regional Comparison - APAC
Data Table on Regional Comparison - APAC

12.5.1 China - Market size and forecast 2025-2030

Chart on China - Market size and forecast 2025-2030 ($ million)
Data Table on China - Market size and forecast 2025-2030 ($ million)
Chart on China - Year-over-year growth 2025-2030 (%)
Data Table on China - Year-over-year growth 2025-2030 (%)

12.5.2 Japan - Market size and forecast 2025-2030

Chart on Japan - Market size and forecast 2025-2030 ($ million)
Data Table on Japan - Market size and forecast 2025-2030 ($ million)
Chart on Japan - Year-over-year growth 2025-2030 (%)
Data Table on Japan - Year-over-year growth 2025-2030 (%)

12.5.3 India - Market size and forecast 2025-2030

Chart on India - Market size and forecast 2025-2030 ($ million)
Data Table on India - Market size and forecast 2025-2030 ($ million)
Chart on India - Year-over-year growth 2025-2030 (%)
Data Table on India - Year-over-year growth 2025-2030 (%)

12.5.4 South Korea - Market size and forecast 2025-2030

Chart on South Korea - Market size and forecast 2025-2030 ($ million)
Data Table on South Korea - Market size and forecast 2025-2030 ($ million)
Chart on South Korea - Year-over-year growth 2025-2030 (%)
Data Table on South Korea - Year-over-year growth 2025-2030 (%)

12.5.5 Australia - Market size and forecast 2025-2030

Chart on Australia - Market size and forecast 2025-2030 ($ million)
Data Table on Australia - Market size and forecast 2025-2030 ($ million)
Chart on Australia - Year-over-year growth 2025-2030 (%)
Data Table on Australia - Year-over-year growth 2025-2030 (%)

12.5.6 Indonesia - Market size and forecast 2025-2030

Chart on Indonesia - Market size and forecast 2025-2030 ($ million)
Data Table on Indonesia - Market size and forecast 2025-2030 ($ million)
Chart on Indonesia - Year-over-year growth 2025-2030 (%)
Data Table on Indonesia - Year-over-year growth 2025-2030 (%)

12.6 South America - Market size and forecast 2025-2030

Chart on South America - Market size and forecast 2025-2030 ($ million)
Data Table on South America - Market size and forecast 2025-2030 ($ million)
Chart on South America - Year-over-year growth 2025-2030 (%)
Data Table on South America - Year-over-year growth 2025-2030 (%)
Chart on Regional Comparison - South America
Data Table on Regional Comparison - South America

12.6.1 Brazil - Market size and forecast 2025-2030

Chart on Brazil - Market size and forecast 2025-2030 ($ million)
Data Table on Brazil - Market size and forecast 2025-2030 ($ million)
Chart on Brazil - Year-over-year growth 2025-2030 (%)
Data Table on Brazil - Year-over-year growth 2025-2030 (%)

12.6.2 Argentina - Market size and forecast 2025-2030

Chart on Argentina - Market size and forecast 2025-2030 ($ million)
Data Table on Argentina - Market size and forecast 2025-2030 ($ million)
Chart on Argentina - Year-over-year growth 2025-2030 (%)
Data Table on Argentina - Year-over-year growth 2025-2030 (%)

12.6.3 Chile - Market size and forecast 2025-2030

Chart on Chile - Market size and forecast 2025-2030 ($ million)
Data Table on Chile - Market size and forecast 2025-2030 ($ million)
Chart on Chile - Year-over-year growth 2025-2030 (%)
Data Table on Chile - Year-over-year growth 2025-2030 (%)

12.7 Middle East and Africa - Market size and forecast 2025-2030

Chart on Middle East and Africa - Market size and forecast 2025-2030 ($ million)
Data Table on Middle East and Africa - Market size and forecast 2025-2030 ($ million)
Chart on Middle East and Africa - Year-over-year growth 2025-2030 (%)
Data Table on Middle East and Africa - Year-over-year growth 2025-2030 (%)
Chart on Regional Comparison - Middle East and Africa
Data Table on Regional Comparison - Middle East and Africa

12.7.1 Saudi Arabia - Market size and forecast 2025-2030

Chart on Saudi Arabia - Market size and forecast 2025-2030 ($ million)
Data Table on Saudi Arabia - Market size and forecast 2025-2030 ($ million)
Chart on Saudi Arabia - Year-over-year growth 2025-2030 (%)
Data Table on Saudi Arabia - Year-over-year growth 2025-2030 (%)

12.7.2 UAE - Market size and forecast 2025-2030

Chart on UAE - Market size and forecast 2025-2030 ($ million)
Data Table on UAE - Market size and forecast 2025-2030 ($ million)
Chart on UAE - Year-over-year growth 2025-2030 (%)
Data Table on UAE - Year-over-year growth 2025-2030 (%)

12.7.3 South Africa - Market size and forecast 2025-2030

Chart on South Africa - Market size and forecast 2025-2030 ($ million)
Data Table on South Africa - Market size and forecast 2025-2030 ($ million)
Chart on South Africa - Year-over-year growth 2025-2030 (%)
Data Table on South Africa - Year-over-year growth 2025-2030 (%)

12.7.4 Turkey - Market size and forecast 2025-2030

Chart on Turkey - Market size and forecast 2025-2030 ($ million)
Data Table on Turkey - Market size and forecast 2025-2030 ($ million)
Chart on Turkey - Year-over-year growth 2025-2030 (%)
Data Table on Turkey - Year-over-year growth 2025-2030 (%)

12.7.5 Egypt - Market size and forecast 2025-2030

Chart on Egypt - Market size and forecast 2025-2030 ($ million)
Data Table on Egypt - Market size and forecast 2025-2030 ($ million)
Chart on Egypt - Year-over-year growth 2025-2030 (%)
Data Table on Egypt - Year-over-year growth 2025-2030 (%)

12.8 Market opportunity by geography

Market opportunity by geography ($ million)
Data Tables on Market opportunity by geography ($ million)

13. Drivers, Challenges, and Opportunity

13.1 Market drivers

Evolving perceptions of masculinity and increased focus on personal well being
Proliferation of digital media and e-commerce channels
Product innovation and increased product sophistication

13.2 Market challenges

Persistent consumer indifference and educational hurdles
Intensifying market competition and brand saturation
Navigating global regulatory complexity and evolving consumer expectations

13.3 Impact of drivers and challenges

Impact of drivers and challenges in 2025 and 2030

13.4 Market opportunities

Rise of skinimalism and demand for multifunctional products
Growing emphasis on clean, sustainable, and transparent formulations
Increasing focus on concern specific and targeted treatments

14. Competitive Landscape

14.1 Overview

14.2

Overview on criticality of inputs and factors of differentiation

14.3 Landscape disruption

Overview on factors of disruption

14.4 Industry risks

Impact of key risks on business

15. Competitive Analysis

15.1 Companies profiled

Companies covered

15.2 Company ranking index

15.3 Market positioning of companies

Matrix on companies position and classification

15.4 Beiersdorf AG

Beiersdorf AG - Overview
Beiersdorf AG - Business segments
Beiersdorf AG - Key offerings
Beiersdorf AG - Segment focus
SWOT

15.5 Coty Inc.

Coty Inc. - Overview
Coty Inc. - Business segments
Coty Inc. - Key news
Coty Inc. - Key offerings
Coty Inc. - Segment focus
SWOT

15.6 Edgewell Personal Care Co.

Edgewell Personal Care Co. - Overview
Edgewell Personal Care Co. - Business segments
Edgewell Personal Care Co. - Key offerings
Edgewell Personal Care Co. - Segment focus
SWOT

15.7 Groupe Clarins

Groupe Clarins - Overview
Groupe Clarins - Product / Service
Groupe Clarins - Key offerings
SWOT

15.8 Harrys Inc.

Harrys Inc. - Overview
Harrys Inc. - Product / Service
Harrys Inc. - Key offerings
SWOT

15.9 Kao Corp.

Kao Corp. - Overview
Kao Corp. - Business segments
Kao Corp. - Key news
Kao Corp. - Key offerings
Kao Corp. - Segment focus
SWOT

15.10 Kenvue Inc.

Kenvue Inc. - Overview
Kenvue Inc. - Business segments
Kenvue Inc. - Key news
Kenvue Inc. - Key offerings
Kenvue Inc. - Segment focus
SWOT

15.11 LOccitane Groupe SA

LOccitane Groupe SA - Overview
LOccitane Groupe SA - Business segments
LOccitane Groupe SA - Key offerings
LOccitane Groupe SA - Segment focus
SWOT

15.12 Loreal SA

Loreal SA - Overview
Loreal SA - Business segments
Loreal SA - Key offerings
Loreal SA - Segment focus
SWOT

15.13 Lumin

Lumin - Overview
Lumin - Product / Service
Lumin - Key offerings
SWOT

15.14 Natura and Co. Holding SA

Natura and Co. Holding SA - Overview
Natura and Co. Holding SA - Business segments
Natura and Co. Holding SA - Key offerings
Natura and Co. Holding SA - Segment focus
SWOT

15.15 Procter and Gamble Co.

Procter and Gamble Co. - Overview
Procter and Gamble Co. - Business segments
Procter and Gamble Co. - Key news
Procter and Gamble Co. - Key offerings
Procter and Gamble Co. - Segment focus
SWOT

15.16 Shiseido Co. Ltd.

Shiseido Co. Ltd. - Overview
Shiseido Co. Ltd. - Business segments
Shiseido Co. Ltd. - Key offerings
Shiseido Co. Ltd. - Segment focus
SWOT

15.17 The Estee Lauder Co. Inc.

The Estee Lauder Co. Inc. - Overview
The Estee Lauder Co. Inc. - Business segments
The Estee Lauder Co. Inc. - Key offerings
The Estee Lauder Co. Inc. - Segment focus
SWOT

15.18 Unilever PLC

Unilever PLC - Overview
Unilever PLC - Business segments
Unilever PLC - Key news
Unilever PLC - Key offerings
Unilever PLC - Segment focus
SWOT

16. Appendix

16.1 Scope of the report

Market definition
Objectives
Notes and caveats

16.2 Inclusions and exclusions checklist

Inclusions checklist
Exclusions checklist

16.3 Currency conversion rates for US$

16.4 Research methodology

16.5 Data procurement

Information sources

16.6 Data validation

16.7 Validation techniques employed for market sizing

16.8 Data synthesis

16.9 360 degree market analysis

16.10 List of abbreviations

Research Methodology

Technavio presents a detailed picture of the market by way of study, synthesis, and summation of data from multiple sources. The analysts have presented the various facets of the market with a particular focus on identifying the key industry influencers. The data thus presented is comprehensive, reliable, and the result of extensive research, both primary and secondary.

INFORMATION SOURCES

Primary sources

  • Manufacturers and suppliers
  • Channel partners
  • Industry experts
  • Strategic decision makers

Secondary sources

  • Industry journals and periodicals
  • Government data
  • Financial reports of key industry players
  • Historical data
  • Press releases

DATA ANALYSIS

Data Synthesis

  • Collation of data
  • Estimation of key figures
  • Analysis of derived insights

Data Validation

  • Triangulation with data models
  • Reference against proprietary databases
  • Corroboration with industry experts

REPORT WRITING

Qualitative

  • Market drivers
  • Market challenges
  • Market trends
  • Five forces analysis

Quantitative

  • Market size and forecast
  • Market segmentation
  • Geographical insights
  • Competitive landscape

Interested in this report?

Get your sample now to see our research methodology and insights!

Download Now

Frequently Asked Questions

Mens Skincare Products market growth will increase by USD 7610.5 million during 2026-2030.

The Mens Skincare Products market is expected to grow at a CAGR of 7.5% during 2026-2030.

Mens Skincare Products market is segmented by Distribution channel (Offline, Online) Product (Facial skincare products, Body skincare products) Type (Oily skincare, Combination skincare, Dry skincare, Sensitive skincare, Normal skincare)

Beiersdorf AG, Brickell Brands LLC, Caldera Lab, Coty Inc., Edgewell Personal Care Co., EVERY MAN JACK, Geologie Inc., Groupe Clarins, Harrys Inc., Kao Corp., Kenvue Inc., LOccitane Groupe SA, Loreal SA, Lumin, Natura and Co. Holding SA, Procter and Gamble Co., Shiseido Co. Ltd., The Estee Lauder Co. Inc., Unilever PLC are a few of the key vendors in the Mens Skincare Products market.

North America will register the highest growth rate of 31.7% among the other regions. Therefore, the Mens Skincare Products market in North America is expected to garner significant business opportunities for the vendors during the forecast period.

US, Canada, Mexico, Germany, UK, France, Italy, Spain, Russia, China, Japan, India, South Korea, Australia, Indonesia, Brazil, Argentina, Chile, Saudi Arabia, UAE, South Africa, Turkey, Egypt

  • Evolving perceptions of masculinity and increased focus on personal well being is the driving factor this market.

The Mens Skincare Products market vendors should focus on grabbing business opportunities from the Distribution channel segment as it accounted for the largest market share in the base year.
RIA - Research AI Assistant
Ask RIA