Meal Coupons Market Analysis, Size, and Forecast 2026-2030: North America (US, Canada, and Mexico), Europe (UK, Germany, and France), APAC (China, India, and Japan), South America (Brazil, Argentina, and Chile), Middle East and Africa (Saudi Arabia, UAE, and South Africa), and Rest of World (ROW)

Meal Coupons Market Analysis, Size, and Forecast 2026-2030:
North America (US, Canada, and Mexico), Europe (UK, Germany, and France), APAC (China, India, and Japan), South America (Brazil, Argentina, and Chile), Middle East and Africa (Saudi Arabia, UAE, and South Africa), and Rest of World (ROW)

Published: May 2026 301 Pages SKU: IRTNTR81342

Market Overview at a Glance

$6.20 B
Market Opportunity
14.1%
CAGR 2025 - 2030
34.6%
North America Growth
$1.98 B
Food delivery promo codes segment 2024

Meal Coupons Market Size and Growth Forecast 2026-2030

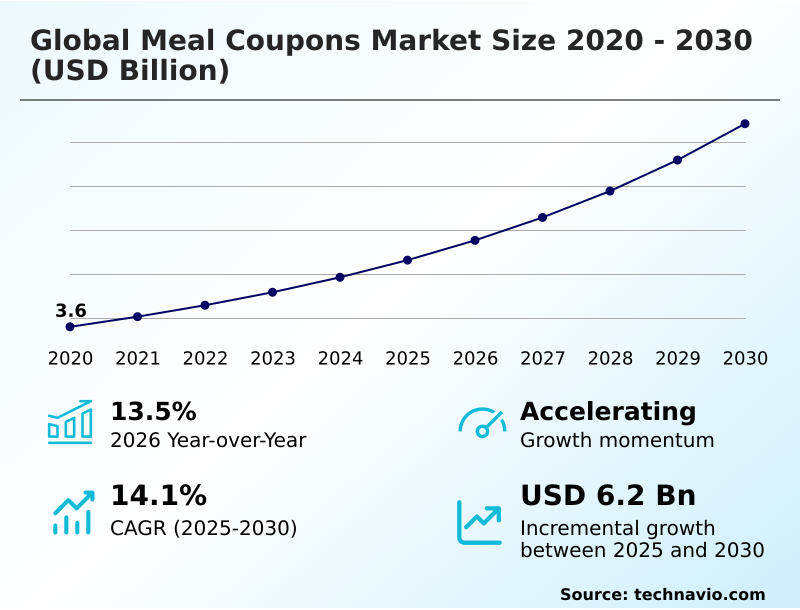
The Meal Coupons Market size was valued at USD 6.63 billion in 2025 growing at a CAGR of 14.1% during the forecast period 2026-2030.

North America accounts for 34.6% of incremental growth during the forecast period. The Food delivery promo codes segment by Product was valued at USD 1.98 billion in 2024, while the Digital meal coupons segment holds the largest revenue share by Type.

The market is projected to grow by USD 9.22 billion from 2020 to 2030, with USD 6.20 billion of the growth expected during the forecast period of 2025 to 2030.

Get Key Insights on Market Forecast (PDF) Request Free Sample

Meal Coupons Market Overview

The meal coupons market is undergoing a fundamental transformation from a transactional perk to a strategic tool for corporate wellness programs and employee retention strategies. With year-over-year growth accelerating past 13%, this evolution is propelled by the widespread adoption of digital meal vouchers and integrated mobile payment applications. This shift enables robust employee benefit administration and provides critical support for a remote workforce. A typical deployment in the professional services sector involves integrating a unified benefits platform with existing payroll, allowing for the automated distribution of tax-advantaged subsidies that employees can redeem via near field communication (NFC) enabled prepaid debit cards. This not only enhances corporate culture but also addresses talent attraction and retention challenges, particularly in North America, which accounts for over 34% of the market's incremental growth. The focus remains on improving employee purchasing power while navigating complex fintech security standards and social welfare policies.

Drivers, Trends, and Challenges in the Meal Coupons Market

The evolution of meal benefits into sophisticated digital ecosystems introduces significant operational complexity for global employers. Successfully integrating meal benefits with HCM platforms is no longer a value-add but a baseline expectation, essential for automating workflows and ensuring data consistency. However, this integration magnifies cybersecurity risks in digital benefit platforms, demanding stringent security protocols and continuous threat monitoring.

Boardroom conversations now center on measuring ROI of employee wellness benefits, a metric that is increasingly tied to ESG reporting for employee benefit programs. For instance, a firm structuring tax-efficient remote work benefits must also consider the impact of inflation on fixed-value benefits and its effect on employee morale.

In Italy, the national budget law directly alters the financial model for these benefits. Deploying biometric authentication for payments helps mitigate fraud but raises questions about balancing security with user convenience. This complexity extends to building a diverse merchant acquirer network, where navigating food service commission disputes is a constant operational reality.

Ultimately, the challenge lies in managing multi-jurisdictional tax compliance and personalizing benefits using machine learning, all while containing administrative costs, which digital platforms can reduce by over 40% compared to manual paper-based systems.

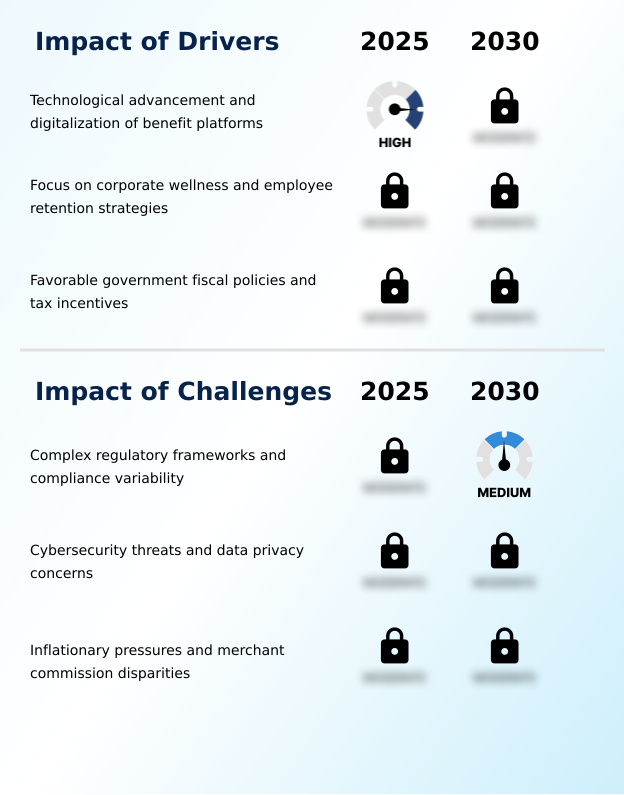
Primary Growth Driver: Technological advancements and the comprehensive digitalization of benefit platforms are the primary forces driving market growth, replacing legacy systems with efficient, secure, and user-friendly digital solutions.

The primary market driver is the comprehensive digital transformation in HR, where meal benefits are a key tool for enhancing corporate culture enhancement and supporting a hybrid work model.

The adoption of technologies like biometric payment verification and seamless digital wallet integration into mobile payment applications offers a superior employee experience, which is crucial for talent attraction and retention.

These systems provide a more efficient alternative to traditional methods, addressing the needs of a modern workforce.

In North America, which accounts for the largest share of market growth, companies are rapidly implementing these employee retention strategies as part of a broader move toward digitized, flexible benefit packages that cater to both on-site and remote staff.

Emerging Market Trend: The market is increasingly defined by the strategic integration of sustainable practices and social responsibility within benefit programs, aligning corporate values with employee wellness and environmental objectives.

The market is moving beyond simple meal subsidies toward integrated nutritional wellness platforms. This trend is driven by corporate social responsibility initiatives and the demand for personalized nutritional guidance to support employee well-being. Providers are leveraging technology to enhance the user experience (UX) design of their applications, incorporating features that track employee engagement metrics and offer sustainable benefit solutions.

For instance, platforms are now facilitating ESG reporting for employee benefit programs by quantifying the carbon footprint reduction from using digital versus paper vouchers. This alignment of benefits with corporate values is becoming a key differentiator, particularly in the European market, which accounts for over 26% of demand, where regulatory and consumer pressures for sustainability are highest.

Key Industry Challenge: The necessity of navigating complex, fragmented regulatory frameworks and ensuring compliance with variable fiscal laws across different jurisdictions presents a significant and persistent challenge for market participants.

Navigating disparate regulatory frameworks is the most significant market challenge. Providers face the high cost of regulatory compliance management, including adherence to strict tax code compliance and data protection laws like GDPR. Managing multi-jurisdictional tax compliance for multinational clients adds another layer of complexity.

On the operational front, balancing merchant commission fees with the need to maintain a broad, accessible network creates constant friction, impacting small business merchant relations. Furthermore, the increasing sophistication of cyber threats requires continuous investment in fintech security standards to mitigate cybersecurity risks in digital benefit platforms, protecting both corporate and employee data from breaches and fraudulent activities.

Explore Full Market Dynamics Analysis Request Free Sample

Meal Coupons Market Segmentation

The meal coupons industry research report provides comprehensive data including region-wise segment analysis, with forecasts and analysis for the period 2026-2030, as well as historical data from 2020-2024 for the following segments.

Market Segment by Product
  • Food delivery promo codes
  • QSR promotional coupons
  • Restaurant discount coupons
  • Printed dine-in coupons
Market Segment by Type
  • Digital meal coupons
  • Paper meal coupons
Market Segment by Product type
  • Dinner coupons
  • Lunch coupons
  • Multi use coupons
  • Breakfast coupons
Market Segment by Geography
North America
US, Canada, Mexico
Europe
UK, Germany, France, Italy, Spain, The Netherlands
APAC
China, India, Japan, South Korea, Australia, Indonesia
South America
Brazil, Argentina, Chile
Middle East and Africa
Saudi Arabia, UAE, South Africa, Israel, Turkey

Product Segment Analysis

The food delivery promo codes segment is estimated to witness significant growth during the forecast period.

The food delivery promo codes segment is driven by the corporate shift to supporting hybrid and remote work models, where traditional on-premise benefits are obsolete.

These digital meal vouchers function within closed-loop payment systems, allowing for precise budgetary control through integrated expense management software. This digital fulfillment drastically reduces administrative overhead reduction compared to physical voucher logistics.

For human resources, the primary value is in streamlined employee benefit administration and access to real-time transaction data, enabling agile adjustments to workforce wellness programs.

The segment's expansion, accounting for over 37% of the total market, underscores the strategic pivot toward flexible, location-agnostic compensation tools that cater to the modern professional's demand for convenience and choice.

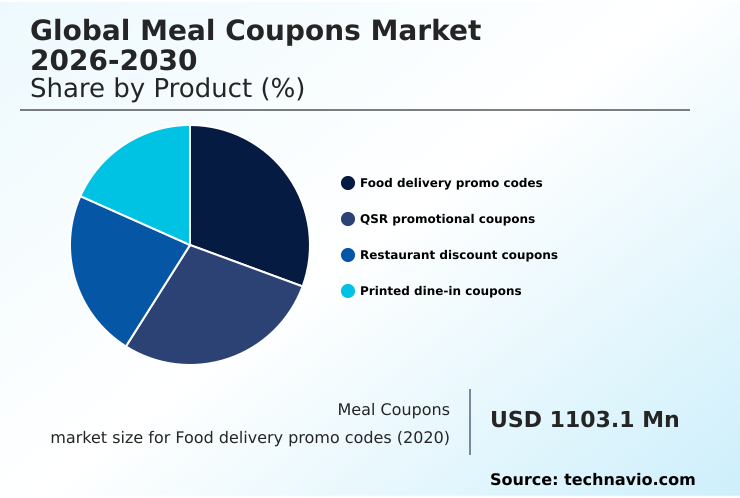
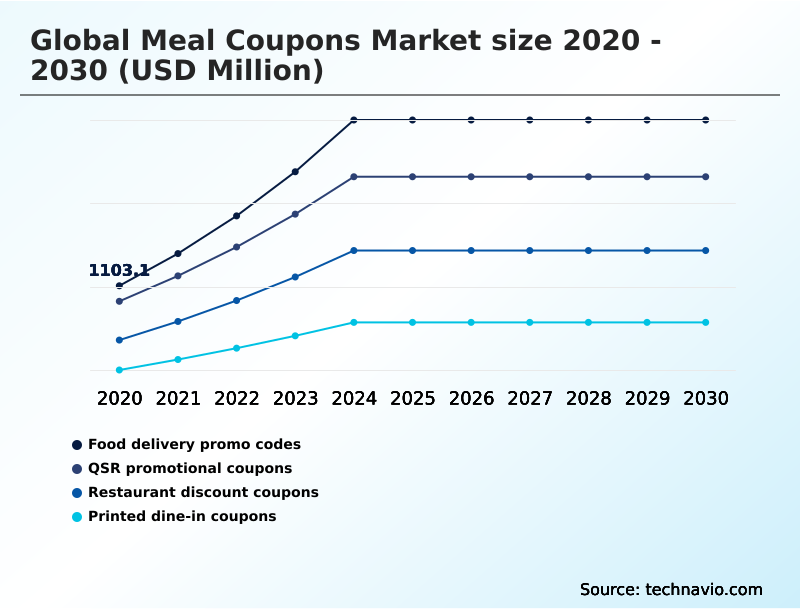
The Food delivery promo codes segment was valued at USD 1.98 billion in 2024 and showed a gradual increase during the forecast period.

Meal Coupons Market by Region: North America Leads with 34.6% Growth Share

North America is estimated to contribute 34.6% to the growth of the global market during the forecast period.

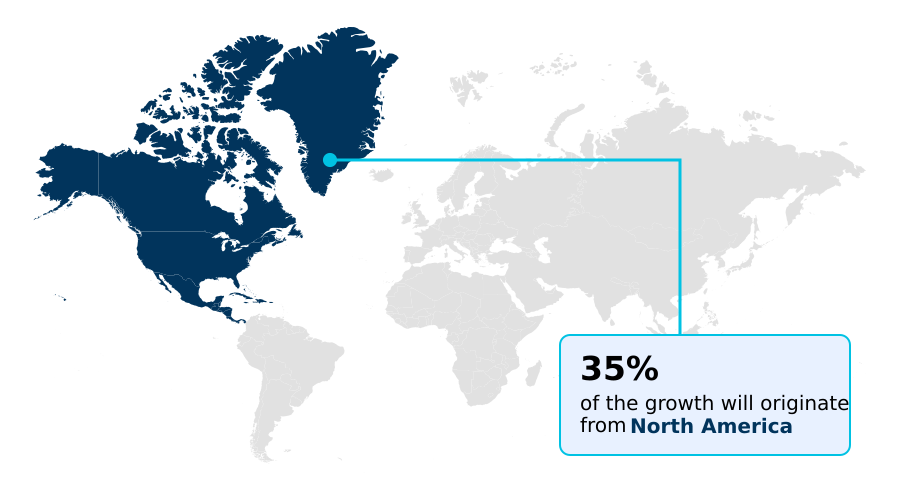
The geographic landscape is characterized by diverse adoption models, with North America contributing over 34% of market growth, driven by a focus on flexible benefits for a hybrid work model.

In Europe, long-standing social welfare policies create a stable, regulated environment, while APAC is the fastest-growing region, leveraging widespread food delivery integration.

A key operational challenge in emerging markets is expanding the merchant acceptance network to ensure remote workforce benefits are viable. This requires sophisticated point-of-sale (POS) integration and partnerships with local food service aggregators.

Successfully executing a multi-country benefit rollout hinges on a provider's ability to adapt its platform to local payment infrastructures and consumer habits, directly impacting employee purchasing power and the overall effectiveness of the program.

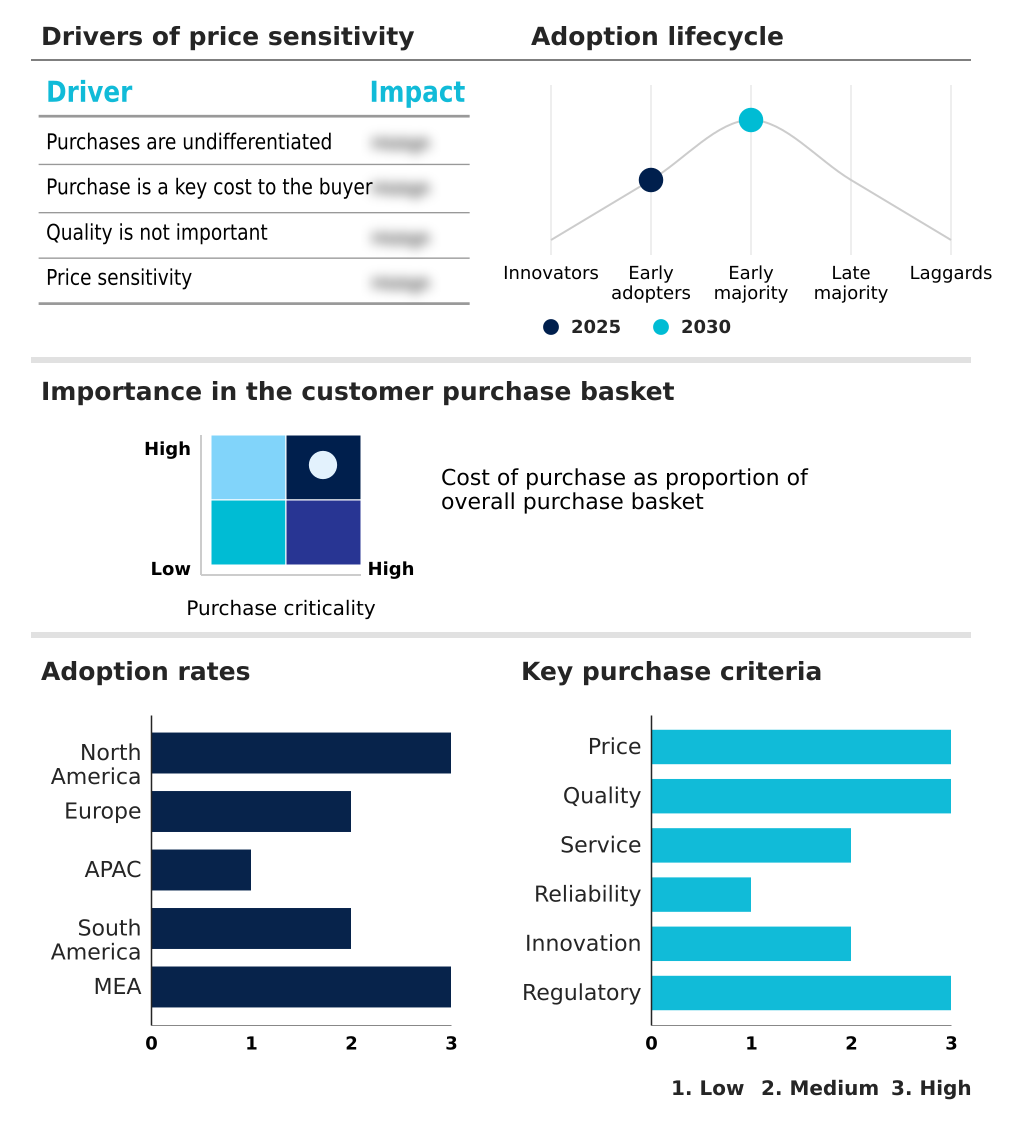
Customer Landscape Analysis for the Meal Coupons Market

The meal coupons market forecasting report includes the adoption lifecycle of the market, covering from the innovator’s stage to the laggard’s stage. It focuses on adoption rates in different regions based on penetration. Furthermore, the meal coupons market report also includes key purchase criteria and drivers of price sensitivity to help companies evaluate and develop their market growth analysis strategies.

Competitive Landscape of the Meal Coupons Market

Companies are implementing various strategies, such as strategic alliances, partnerships, mergers and acquisitions, geographical expansion, and product/service launches, to enhance their presence in the meal coupons market industry.

Benify AB - Providers deliver tax-advantaged digital meal benefits and corporate wellness solutions, enabling employers to enhance compensation packages and support employee purchasing power through secure, unified platforms.

The industry research and growth report includes detailed analyses of the competitive landscape of the market and information about key companies, including:

  • Benify AB
  • Blackhawk Network Holdings Inc.
  • Circula GmbH
  • DOORDASH INC.
  • Edenred SE
  • ezCater Inc.
  • Giftbit Inc.
  • Givex Corp.
  • InComm Payments
  • Just Eat Takeaway.com B.V.
  • Pluxee Group
  • Reward Gateway UK Ltd.
  • SAP SE
  • Sharebite Inc.
  • Uber Technologies Inc.
  • UP COOP
  • Vantage Circle.
  • Workday Inc.
  • Worklife.
  • Zeta Services Inc.

Qualitative and quantitative analysis of companies has been conducted to help clients understand the wider business environment as well as the strengths and weaknesses of key industry players. Data is qualitatively analyzed to categorize companies as pure play, category-focused, industry-focused, and diversified; it is quantitatively analyzed to categorize companies as dominant, leading, strong, tentative, and weak.

Recent Developments in the Meal Coupons Market

  • In May, 2025, Pluxee Group announced the implementation of a global carbon-offsetting initiative, enabling corporate clients to track and report the reduced environmental impact of digital transactions compared to paper vouchers.
  • In April, 2025, Edenred SE introduced a biometric payment verification feature for its digital meal cards in several European markets, allowing users to authorize transactions with mobile device fingerprint sensors for enhanced security.
  • In March, 2025, a major global fast-food franchise partnered with a European digital benefits provider to enable instant redemption of corporate meal credits directly through the restaurant's existing loyalty application, streamlining the user experience.
  • In January, 2025, a prominent London-based technology firm launched a 'Sunrise Nutrition' program, providing its hybrid workforce with digital credits specifically for breakfast items, redeemable during morning hours at a curated network of local cafes.

Research Analyst Overview: Meal Coupons Market

The meal coupons market has fundamentally shifted from a simple employee perk to a critical component of strategic human capital management, embedded within unified benefits platforms. This transition is driven by the need for effective employee retention strategies in a competitive global labor market. Digital meal vouchers, integrated with expense management software and payroll integration services, are now standard.

Boardroom decisions increasingly focus on leveraging these flexible benefit packages to bolster corporate social responsibility credentials and support a distributed remote workforce. A key factor is regulatory compliance management, particularly with mandates like France's decree requiring a near-total shift to digital formats, which pressures companies to abandon legacy paper systems.

For procurement decision-makers, vendor selection now prioritizes platforms offering robust data privacy and security, a vast merchant acceptance network, and features like biometric payment verification. The challenge of managing merchant commission fees while delivering a seamless experience via mobile payment applications and digital wallet integration remains a central operational focus for providers.

Dive into Technavio’s robust research methodology, blending expert interviews, extensive data synthesis, and validated models for unparalleled Meal Coupons Market insights. See full methodology.

Request Free Sample

Market Scope
Page number 301
Base year 2025
Historic period 2020-2024
Forecast period 2026-2030
Growth momentum & CAGR Accelerate at a CAGR of 14.1%
Market growth 2026-2030 USD 6198.5 million
Market structure Fragmented
YoY growth 2025-2026(%) 13.5%
Key countries US, Canada, Mexico, UK, Germany, France, Italy, Spain, The Netherlands, China, India, Japan, South Korea, Australia, Indonesia, Brazil, Argentina, Chile, Saudi Arabia, UAE, South Africa, Israel and Turkey
Competitive landscape Leading Companies, Market Positioning of Companies, Competitive Strategies, and Industry Risks

Meal Coupons Market: Key Questions Answered in This Report

  • What is the expected growth of the Meal Coupons Market between 2026 and 2030?

    • The Meal Coupons Market is expected to grow by USD 6.20 billion during 2026-2030, registering a CAGR of 14.1%. Year-over-year growth in 2026 is estimated at 13.5%%. This acceleration is shaped by technological advancement and digitalization of benefit platforms, which is intensifying demand across multiple end-use verticals covered in the report.

  • What segmentation does the market report cover?

    • The report is segmented by Product (Food delivery promo codes, QSR promotional coupons, Restaurant discount coupons, and Printed dine-in coupons), Type (Digital meal coupons, and Paper meal coupons), Product Type (Dinner coupons, Lunch coupons, Multi use coupons, and Breakfast coupons) and Geography (North America, Europe, APAC, South America, Middle East and Africa). Among these, the Food delivery promo codes segment is estimated to witness significant growth during the forecast period, driven by rising adoption across key application areas. Each segment includes detailed qualitative and quantitative analysis, along with historical data from 2020-2024 and forecasts through 2030 with year-over-year growth rates.

  • Which regions are analyzed in the report?

    • The report covers North America, Europe, APAC, South America and Middle East and Africa. North America is estimated to contribute 34.6% to market growth during the forecast period. Country-level analysis includes US, Canada, Mexico, UK, Germany, France, Italy, Spain, The Netherlands, China, India, Japan, South Korea, Australia, Indonesia, Brazil, Argentina, Chile, Saudi Arabia, UAE, South Africa, Israel and Turkey, with dedicated market size tables and year-over-year growth for each.

  • What are the key growth drivers and market challenges?

    • The primary driver is technological advancement and digitalization of benefit platforms, which is accelerating investment and industry demand. The main challenge is complex regulatory frameworks and compliance variability, creating operational barriers for key market participants. The report quantifies the impact of each driver and challenge across 2026 and 2030 with comparative analysis.

  • Who are the major players in the Meal Coupons Market?

    • Key vendors include Benify AB, Blackhawk Network Holdings Inc., Circula GmbH, DOORDASH INC., Edenred SE, ezCater Inc., Giftbit Inc., Givex Corp., InComm Payments, Just Eat Takeaway.com B.V., Pluxee Group, Reward Gateway UK Ltd., SAP SE, Sharebite Inc., Uber Technologies Inc., UP COOP, Vantage Circle., Workday Inc., Worklife. and Zeta Services Inc.. The report provides qualitative and quantitative analysis categorizing companies as dominant, leading, strong, tentative, and weak based on their market positioning. Company profiles include business segment analysis, SWOT assessment, key offerings, and recent strategic developments.

Meal Coupons Market Research Insights

Market dynamics are increasingly influenced by the need to balance security and convenience in digital benefit ecosystems. The imperative for compliance with data privacy and security mandates, such as the General Data Protection Regulation (GDPR) in Europe, dictates the architecture of these platforms, requiring robust data encryption protocols and secure fintech security standards.

In practice, a multinational corporation implementing a multi-country benefit rollout must ensure its platform can handle variable tax code compliance while offering a consistent user experience (UX) design.

This digital transformation in HR is not merely about replacing paper; it is about creating sustainable benefit solutions that enhance corporate culture enhancement, a key factor in talent attraction and retention for hybrid work models.

We can help! Our analysts can customize this meal coupons market research report to meet your requirements.

Get in touch

1. Executive Summary

1.1 Market overview

Executive Summary - Chart on Market Overview
Executive Summary - Data Table on Market Overview
Executive Summary - Chart on Global Market Characteristics
Executive Summary - Chart on Market by Geography
Executive Summary - Chart on Market Segmentation by Product
Executive Summary - Chart on Market Segmentation by Type
Executive Summary - Chart on Market Segmentation by Product Type
Executive Summary - Chart on Incremental Growth
Executive Summary - Data Table on Incremental Growth
Executive Summary - Chart on Company Market Positioning

2. Technavio Analysis

2.1 Analysis of price sensitivity, lifecycle, customer purchase basket, adoption rates, and purchase criteria

2.2 Criticality of inputs and Factors of differentiation

Chart on Overview on criticality of inputs and factors of differentiation

2.3 Factors of disruption

Chart on Overview on factors of disruption

2.4 Impact of drivers and challenges

Chart on Impact of drivers and challenges in 2025 and 2030

3. Market Landscape

3.1 Market ecosystem

Chart on Parent Market
Data Table on - Parent Market

3.2 Market characteristics

Chart on Market characteristics analysis

3.3 Value chain analysis

Chart on Value chain analysis

4. Market Sizing

4.1 Market definition

Data Table on Offerings of companies included in the market definition

4.2 Market segment analysis

Market segments

4.3 Market size 2025

4.4 Market outlook: Forecast for 2025-2030

Chart on Global - Market size and forecast 2025-2030 ($ million)
Data Table on Global - Market size and forecast 2025-2030 ($ million)
Chart on Global Market: Year-over-year growth 2025-2030 (%)
Data Table on Global Market: Year-over-year growth 2025-2030 (%)

5. Historic Market Size

5.1 Global Meal Coupons Market 2020 - 2024

Historic Market Size - Data Table on Global Meal Coupons Market 2020 - 2024 ($ million)

5.2 Product segment analysis 2020 - 2024

Historic Market Size - Product Segment 2020 - 2024 ($ million)

5.3 Type segment analysis 2020 - 2024

Historic Market Size - Type Segment 2020 - 2024 ($ million)

5.4 Product Type segment analysis 2020 - 2024

Historic Market Size - Product Type Segment 2020 - 2024 ($ million)

5.5 Geography segment analysis 2020 - 2024

Historic Market Size - Geography Segment 2020 - 2024 ($ million)

5.6 Country segment analysis 2020 - 2024

Historic Market Size - Country Segment 2020 - 2024 ($ million)

6. Qualitative Analysis

6.1 The AI impact on Global Meal Coupons Market

7. Five Forces Analysis

7.1 Five forces summary

Five forces analysis - Comparison between 2025 and 2030

7.2 Bargaining power of buyers

Bargaining power of buyers - Impact of key factors 2025 and 2030

7.3 Bargaining power of suppliers

Bargaining power of suppliers - Impact of key factors in 2025 and 2030

7.4 Threat of new entrants

Threat of new entrants - Impact of key factors in 2025 and 2030

7.5 Threat of substitutes

Threat of substitutes - Impact of key factors in 2025 and 2030

7.6 Threat of rivalry

Threat of rivalry - Impact of key factors in 2025 and 2030

7.7 Market condition

Chart on Market condition - Five forces 2025 and 2030

8. Market Segmentation by Product

8.1 Market segments

Chart on Product - Market share 2025-2030 (%)
Data Table on Product - Market share 2025-2030 (%)

8.2 Comparison by Product

Chart on Comparison by Product
Data Table on Comparison by Product

8.3 Food delivery promo codes - Market size and forecast 2025-2030

Chart on Food delivery promo codes - Market size and forecast 2025-2030 ($ million)
Data Table on Food delivery promo codes - Market size and forecast 2025-2030 ($ million)
Chart on Food delivery promo codes - Year-over-year growth 2025-2030 (%)
Data Table on Food delivery promo codes - Year-over-year growth 2025-2030 (%)

8.4 QSR promotional coupons - Market size and forecast 2025-2030

Chart on QSR promotional coupons - Market size and forecast 2025-2030 ($ million)
Data Table on QSR promotional coupons - Market size and forecast 2025-2030 ($ million)
Chart on QSR promotional coupons - Year-over-year growth 2025-2030 (%)
Data Table on QSR promotional coupons - Year-over-year growth 2025-2030 (%)

8.5 Restaurant discount coupons - Market size and forecast 2025-2030

Chart on Restaurant discount coupons - Market size and forecast 2025-2030 ($ million)
Data Table on Restaurant discount coupons - Market size and forecast 2025-2030 ($ million)
Chart on Restaurant discount coupons - Year-over-year growth 2025-2030 (%)
Data Table on Restaurant discount coupons - Year-over-year growth 2025-2030 (%)

8.6 Printed dine-in coupons - Market size and forecast 2025-2030

Chart on Printed dine-in coupons - Market size and forecast 2025-2030 ($ million)
Data Table on Printed dine-in coupons - Market size and forecast 2025-2030 ($ million)
Chart on Printed dine-in coupons - Year-over-year growth 2025-2030 (%)
Data Table on Printed dine-in coupons - Year-over-year growth 2025-2030 (%)

8.7 Market opportunity by Product

Market opportunity by Product ($ million)
Data Table on Market opportunity by Product ($ million)

9. Market Segmentation by Type

9.1 Market segments

Chart on Type - Market share 2025-2030 (%)
Data Table on Type - Market share 2025-2030 (%)

9.2 Comparison by Type

Chart on Comparison by Type
Data Table on Comparison by Type

9.3 Digital meal coupons - Market size and forecast 2025-2030

Chart on Digital meal coupons - Market size and forecast 2025-2030 ($ million)
Data Table on Digital meal coupons - Market size and forecast 2025-2030 ($ million)
Chart on Digital meal coupons - Year-over-year growth 2025-2030 (%)
Data Table on Digital meal coupons - Year-over-year growth 2025-2030 (%)

9.4 Paper meal coupons - Market size and forecast 2025-2030

Chart on Paper meal coupons - Market size and forecast 2025-2030 ($ million)
Data Table on Paper meal coupons - Market size and forecast 2025-2030 ($ million)
Chart on Paper meal coupons - Year-over-year growth 2025-2030 (%)
Data Table on Paper meal coupons - Year-over-year growth 2025-2030 (%)

9.5 Market opportunity by Type

Market opportunity by Type ($ million)
Data Table on Market opportunity by Type ($ million)

10. Market Segmentation by Product Type

10.1 Market segments

Chart on Product Type - Market share 2025-2030 (%)
Data Table on Product Type - Market share 2025-2030 (%)

10.2 Comparison by Product Type

Chart on Comparison by Product Type
Data Table on Comparison by Product Type

10.3 Dinner coupons - Market size and forecast 2025-2030

Chart on Dinner coupons - Market size and forecast 2025-2030 ($ million)
Data Table on Dinner coupons - Market size and forecast 2025-2030 ($ million)
Chart on Dinner coupons - Year-over-year growth 2025-2030 (%)
Data Table on Dinner coupons - Year-over-year growth 2025-2030 (%)

10.4 Lunch coupons - Market size and forecast 2025-2030

Chart on Lunch coupons - Market size and forecast 2025-2030 ($ million)
Data Table on Lunch coupons - Market size and forecast 2025-2030 ($ million)
Chart on Lunch coupons - Year-over-year growth 2025-2030 (%)
Data Table on Lunch coupons - Year-over-year growth 2025-2030 (%)

10.5 Multi use coupons - Market size and forecast 2025-2030

Chart on Multi use coupons - Market size and forecast 2025-2030 ($ million)
Data Table on Multi use coupons - Market size and forecast 2025-2030 ($ million)
Chart on Multi use coupons - Year-over-year growth 2025-2030 (%)
Data Table on Multi use coupons - Year-over-year growth 2025-2030 (%)

10.6 Breakfast coupons - Market size and forecast 2025-2030

Chart on Breakfast coupons - Market size and forecast 2025-2030 ($ million)
Data Table on Breakfast coupons - Market size and forecast 2025-2030 ($ million)
Chart on Breakfast coupons - Year-over-year growth 2025-2030 (%)
Data Table on Breakfast coupons - Year-over-year growth 2025-2030 (%)

10.7 Market opportunity by Product Type

Market opportunity by Product Type ($ million)
Data Table on Market opportunity by Product Type ($ million)

11. Customer Landscape

11.1 Customer landscape overview

Analysis of price sensitivity, lifecycle, customer purchase basket, adoption rates, and purchase criteria

12. Geographic Landscape

12.1 Geographic segmentation

Chart on Market share by geography 2025-2030 (%)
Data Table on Market share by geography 2025-2030 (%)

12.2 Geographic comparison

Chart on Geographic comparison
Data Table on Geographic comparison

12.3 North America - Market size and forecast 2025-2030

Chart on North America - Market size and forecast 2025-2030 ($ million)
Data Table on North America - Market size and forecast 2025-2030 ($ million)
Chart on North America - Year-over-year growth 2025-2030 (%)
Data Table on North America - Year-over-year growth 2025-2030 (%)
Chart on Regional Comparison - North America
Data Table on Regional Comparison - North America

12.3.1 US - Market size and forecast 2025-2030

Chart on US - Market size and forecast 2025-2030 ($ million)
Data Table on US - Market size and forecast 2025-2030 ($ million)
Chart on US - Year-over-year growth 2025-2030 (%)
Data Table on US - Year-over-year growth 2025-2030 (%)

12.3.2 Canada - Market size and forecast 2025-2030

Chart on Canada - Market size and forecast 2025-2030 ($ million)
Data Table on Canada - Market size and forecast 2025-2030 ($ million)
Chart on Canada - Year-over-year growth 2025-2030 (%)
Data Table on Canada - Year-over-year growth 2025-2030 (%)

12.3.3 Mexico - Market size and forecast 2025-2030

Chart on Mexico - Market size and forecast 2025-2030 ($ million)
Data Table on Mexico - Market size and forecast 2025-2030 ($ million)
Chart on Mexico - Year-over-year growth 2025-2030 (%)
Data Table on Mexico - Year-over-year growth 2025-2030 (%)

12.4 Europe - Market size and forecast 2025-2030

Chart on Europe - Market size and forecast 2025-2030 ($ million)
Data Table on Europe - Market size and forecast 2025-2030 ($ million)
Chart on Europe - Year-over-year growth 2025-2030 (%)
Data Table on Europe - Year-over-year growth 2025-2030 (%)
Chart on Regional Comparison - Europe
Data Table on Regional Comparison - Europe

12.4.1 UK - Market size and forecast 2025-2030

Chart on UK - Market size and forecast 2025-2030 ($ million)
Data Table on UK - Market size and forecast 2025-2030 ($ million)
Chart on UK - Year-over-year growth 2025-2030 (%)
Data Table on UK - Year-over-year growth 2025-2030 (%)

12.4.2 Germany - Market size and forecast 2025-2030

Chart on Germany - Market size and forecast 2025-2030 ($ million)
Data Table on Germany - Market size and forecast 2025-2030 ($ million)
Chart on Germany - Year-over-year growth 2025-2030 (%)
Data Table on Germany - Year-over-year growth 2025-2030 (%)

12.4.3 France - Market size and forecast 2025-2030

Chart on France - Market size and forecast 2025-2030 ($ million)
Data Table on France - Market size and forecast 2025-2030 ($ million)
Chart on France - Year-over-year growth 2025-2030 (%)
Data Table on France - Year-over-year growth 2025-2030 (%)

12.4.4 Italy - Market size and forecast 2025-2030

Chart on Italy - Market size and forecast 2025-2030 ($ million)
Data Table on Italy - Market size and forecast 2025-2030 ($ million)
Chart on Italy - Year-over-year growth 2025-2030 (%)
Data Table on Italy - Year-over-year growth 2025-2030 (%)

12.4.5 Spain - Market size and forecast 2025-2030

Chart on Spain - Market size and forecast 2025-2030 ($ million)
Data Table on Spain - Market size and forecast 2025-2030 ($ million)
Chart on Spain - Year-over-year growth 2025-2030 (%)
Data Table on Spain - Year-over-year growth 2025-2030 (%)

12.4.6 The Netherlands - Market size and forecast 2025-2030

Chart on The Netherlands - Market size and forecast 2025-2030 ($ million)
Data Table on The Netherlands - Market size and forecast 2025-2030 ($ million)
Chart on The Netherlands - Year-over-year growth 2025-2030 (%)
Data Table on The Netherlands - Year-over-year growth 2025-2030 (%)

12.5 APAC - Market size and forecast 2025-2030

Chart on APAC - Market size and forecast 2025-2030 ($ million)
Data Table on APAC - Market size and forecast 2025-2030 ($ million)
Chart on APAC - Year-over-year growth 2025-2030 (%)
Data Table on APAC - Year-over-year growth 2025-2030 (%)
Chart on Regional Comparison - APAC
Data Table on Regional Comparison - APAC

12.5.1 China - Market size and forecast 2025-2030

Chart on China - Market size and forecast 2025-2030 ($ million)
Data Table on China - Market size and forecast 2025-2030 ($ million)
Chart on China - Year-over-year growth 2025-2030 (%)
Data Table on China - Year-over-year growth 2025-2030 (%)

12.5.2 India - Market size and forecast 2025-2030

Chart on India - Market size and forecast 2025-2030 ($ million)
Data Table on India - Market size and forecast 2025-2030 ($ million)
Chart on India - Year-over-year growth 2025-2030 (%)
Data Table on India - Year-over-year growth 2025-2030 (%)

12.5.3 Japan - Market size and forecast 2025-2030

Chart on Japan - Market size and forecast 2025-2030 ($ million)
Data Table on Japan - Market size and forecast 2025-2030 ($ million)
Chart on Japan - Year-over-year growth 2025-2030 (%)
Data Table on Japan - Year-over-year growth 2025-2030 (%)

12.5.4 South Korea - Market size and forecast 2025-2030

Chart on South Korea - Market size and forecast 2025-2030 ($ million)
Data Table on South Korea - Market size and forecast 2025-2030 ($ million)
Chart on South Korea - Year-over-year growth 2025-2030 (%)
Data Table on South Korea - Year-over-year growth 2025-2030 (%)

12.5.5 Australia - Market size and forecast 2025-2030

Chart on Australia - Market size and forecast 2025-2030 ($ million)
Data Table on Australia - Market size and forecast 2025-2030 ($ million)
Chart on Australia - Year-over-year growth 2025-2030 (%)
Data Table on Australia - Year-over-year growth 2025-2030 (%)

12.5.6 Indonesia - Market size and forecast 2025-2030

Chart on Indonesia - Market size and forecast 2025-2030 ($ million)
Data Table on Indonesia - Market size and forecast 2025-2030 ($ million)
Chart on Indonesia - Year-over-year growth 2025-2030 (%)
Data Table on Indonesia - Year-over-year growth 2025-2030 (%)

12.6 South America - Market size and forecast 2025-2030

Chart on South America - Market size and forecast 2025-2030 ($ million)
Data Table on South America - Market size and forecast 2025-2030 ($ million)
Chart on South America - Year-over-year growth 2025-2030 (%)
Data Table on South America - Year-over-year growth 2025-2030 (%)
Chart on Regional Comparison - South America
Data Table on Regional Comparison - South America

12.6.1 Brazil - Market size and forecast 2025-2030

Chart on Brazil - Market size and forecast 2025-2030 ($ million)
Data Table on Brazil - Market size and forecast 2025-2030 ($ million)
Chart on Brazil - Year-over-year growth 2025-2030 (%)
Data Table on Brazil - Year-over-year growth 2025-2030 (%)

12.6.2 Argentina - Market size and forecast 2025-2030

Chart on Argentina - Market size and forecast 2025-2030 ($ million)
Data Table on Argentina - Market size and forecast 2025-2030 ($ million)
Chart on Argentina - Year-over-year growth 2025-2030 (%)
Data Table on Argentina - Year-over-year growth 2025-2030 (%)

12.6.3 Chile - Market size and forecast 2025-2030

Chart on Chile - Market size and forecast 2025-2030 ($ million)
Data Table on Chile - Market size and forecast 2025-2030 ($ million)
Chart on Chile - Year-over-year growth 2025-2030 (%)
Data Table on Chile - Year-over-year growth 2025-2030 (%)

12.7 Middle East and Africa - Market size and forecast 2025-2030

Chart on Middle East and Africa - Market size and forecast 2025-2030 ($ million)
Data Table on Middle East and Africa - Market size and forecast 2025-2030 ($ million)
Chart on Middle East and Africa - Year-over-year growth 2025-2030 (%)
Data Table on Middle East and Africa - Year-over-year growth 2025-2030 (%)
Chart on Regional Comparison - Middle East and Africa
Data Table on Regional Comparison - Middle East and Africa

12.7.1 Saudi Arabia - Market size and forecast 2025-2030

Chart on Saudi Arabia - Market size and forecast 2025-2030 ($ million)
Data Table on Saudi Arabia - Market size and forecast 2025-2030 ($ million)
Chart on Saudi Arabia - Year-over-year growth 2025-2030 (%)
Data Table on Saudi Arabia - Year-over-year growth 2025-2030 (%)

12.7.2 UAE - Market size and forecast 2025-2030

Chart on UAE - Market size and forecast 2025-2030 ($ million)
Data Table on UAE - Market size and forecast 2025-2030 ($ million)
Chart on UAE - Year-over-year growth 2025-2030 (%)
Data Table on UAE - Year-over-year growth 2025-2030 (%)

12.7.3 South Africa - Market size and forecast 2025-2030

Chart on South Africa - Market size and forecast 2025-2030 ($ million)
Data Table on South Africa - Market size and forecast 2025-2030 ($ million)
Chart on South Africa - Year-over-year growth 2025-2030 (%)
Data Table on South Africa - Year-over-year growth 2025-2030 (%)

12.7.4 Israel - Market size and forecast 2025-2030

Chart on Israel - Market size and forecast 2025-2030 ($ million)
Data Table on Israel - Market size and forecast 2025-2030 ($ million)
Chart on Israel - Year-over-year growth 2025-2030 (%)
Data Table on Israel - Year-over-year growth 2025-2030 (%)

12.7.5 Turkey - Market size and forecast 2025-2030

Chart on Turkey - Market size and forecast 2025-2030 ($ million)
Data Table on Turkey - Market size and forecast 2025-2030 ($ million)
Chart on Turkey - Year-over-year growth 2025-2030 (%)
Data Table on Turkey - Year-over-year growth 2025-2030 (%)

12.8 Market opportunity by geography

Market opportunity by geography ($ million)
Data Tables on Market opportunity by geography ($ million)

13. Drivers, Challenges, and Opportunity

13.1 Market drivers

Technological advancement and digitalization of benefit platforms
Focus on corporate wellness and employee retention strategies
Favorable government fiscal policies and tax incentives

13.2 Market challenges

Complex regulatory frameworks and compliance variability
Cybersecurity threats and data privacy concerns
Inflationary pressures and merchant commission disparities

13.3 Impact of drivers and challenges

Impact of drivers and challenges in 2025 and 2030

13.4 Market opportunities

Integration of sustainable practices and social responsibility
Hyper-personalization and AI in nutritional wellness
Convergence of meal benefits into unified lifestyle ecosystems

14. Competitive Landscape

14.1 Overview

14.2

Overview on criticality of inputs and factors of differentiation

14.3 Landscape disruption

Overview on factors of disruption

14.4 Industry risks

Impact of key risks on business

15. Competitive Analysis

15.1 Companies profiled

Companies covered

15.2 Company ranking index

15.3 Market positioning of companies

Matrix on companies position and classification

15.4 Benify AB

Benify AB - Overview
Benify AB - Product / Service
Benify AB - Key offerings
SWOT

15.5 Blackhawk Network Holdings Inc.

Blackhawk Network Holdings Inc. - Overview
Blackhawk Network Holdings Inc. - Product / Service
Blackhawk Network Holdings Inc. - Key offerings
SWOT

15.6 Circula GmbH

Circula GmbH - Overview
Circula GmbH - Product / Service
Circula GmbH - Key offerings
SWOT

15.7 DOORDASH INC.

DOORDASH INC. - Overview
DOORDASH INC. - Product / Service
DOORDASH INC. - Key offerings
SWOT

15.8 Edenred SE

Edenred SE - Overview
Edenred SE - Business segments
Edenred SE - Key news
Edenred SE - Key offerings
Edenred SE - Segment focus
SWOT

15.9 ezCater Inc.

ezCater Inc. - Overview
ezCater Inc. - Product / Service
ezCater Inc. - Key offerings
SWOT

15.10 Giftbit Inc.

Giftbit Inc. - Overview
Giftbit Inc. - Product / Service
Giftbit Inc. - Key offerings
SWOT

15.11 Givex Corp.

Givex Corp. - Overview
Givex Corp. - Product / Service
Givex Corp. - Key offerings
SWOT

15.12 InComm Payments

InComm Payments - Overview
InComm Payments - Product / Service
InComm Payments - Key offerings
SWOT

15.13 Just Eat Takeaway.com B.V.

Just Eat Takeaway.com B.V. - Overview
Just Eat Takeaway.com B.V. - Business segments
Just Eat Takeaway.com B.V. - Key offerings
Just Eat Takeaway.com B.V. - Segment focus
SWOT

15.14 Pluxee Group

Pluxee Group - Overview
Pluxee Group - Product / Service
Pluxee Group - Key offerings
SWOT

15.15 Reward Gateway UK Ltd.

Reward Gateway UK Ltd. - Overview
Reward Gateway UK Ltd. - Product / Service
Reward Gateway UK Ltd. - Key offerings
SWOT

15.16 SAP SE

SAP SE - Overview
SAP SE - Business segments
SAP SE - Key news
SAP SE - Key offerings
SAP SE - Segment focus
SWOT

15.17 Sharebite Inc.

Sharebite Inc. - Overview
Sharebite Inc. - Product / Service
Sharebite Inc. - Key offerings
SWOT

15.18 Uber Technologies Inc.

Uber Technologies Inc. - Overview
Uber Technologies Inc. - Business segments
Uber Technologies Inc. - Key offerings
Uber Technologies Inc. - Segment focus
SWOT

16. Appendix

16.1 Scope of the report

Market definition
Objectives
Notes and caveats

16.2 Inclusions and exclusions checklist

Inclusions checklist
Exclusions checklist

16.3 Currency conversion rates for US$

16.4 Research methodology

16.5 Data procurement

Information sources

16.6 Data validation

16.7 Validation techniques employed for market sizing

16.8 Data synthesis

16.9 360 degree market analysis

16.10 List of abbreviations

Research Methodology

Technavio presents a detailed picture of the market by way of study, synthesis, and summation of data from multiple sources. The analysts have presented the various facets of the market with a particular focus on identifying the key industry influencers. The data thus presented is comprehensive, reliable, and the result of extensive research, both primary and secondary.

INFORMATION SOURCES

Primary sources

  • Manufacturers and suppliers
  • Channel partners
  • Industry experts
  • Strategic decision makers

Secondary sources

  • Industry journals and periodicals
  • Government data
  • Financial reports of key industry players
  • Historical data
  • Press releases

DATA ANALYSIS

Data Synthesis

  • Collation of data
  • Estimation of key figures
  • Analysis of derived insights

Data Validation

  • Triangulation with data models
  • Reference against proprietary databases
  • Corroboration with industry experts

REPORT WRITING

Qualitative

  • Market drivers
  • Market challenges
  • Market trends
  • Five forces analysis

Quantitative

  • Market size and forecast
  • Market segmentation
  • Geographical insights
  • Competitive landscape

Interested in this report?

Get your sample now to see our research methodology and insights!

Download Now

Frequently Asked Questions

Meal Coupons market growth will increase by USD 6198.5 million during 2026-2030.

The Meal Coupons market is expected to grow at a CAGR of 14.1% during 2026-2030.

Meal Coupons market is segmented by Product (Food delivery promo codes, QSR promotional coupons, Restaurant discount coupons, Printed dine-in coupons) Type (Digital meal coupons, Paper meal coupons) Product type (Dinner coupons, Lunch coupons, Multi use coupons, Breakfast coupons)

Benify AB, Blackhawk Network Holdings Inc., Circula GmbH, DOORDASH INC., Edenred SE, ezCater Inc., Giftbit Inc., Givex Corp., InComm Payments, Just Eat Takeaway.com B.V., Pluxee Group, Reward Gateway UK Ltd., SAP SE, Sharebite Inc., Uber Technologies Inc., UP COOP, Vantage Circle., Workday Inc., Worklife., Zeta Services Inc. are a few of the key vendors in the Meal Coupons market.

North America will register the highest growth rate of 34.6% among the other regions. Therefore, the Meal Coupons market in North America is expected to garner significant business opportunities for the vendors during the forecast period.

US, Canada, Mexico, UK, Germany, France, Italy, Spain, The Netherlands, China, India, Japan, South Korea, Australia, Indonesia, Brazil, Argentina, Chile, Saudi Arabia, UAE, South Africa, Israel, Turkey

  • Technological advancement and digitalization of benefit platforms is the driving factor this market.

The Meal Coupons market vendors should focus on grabbing business opportunities from the Product segment as it accounted for the largest market share in the base year.
RIA - Research AI Assistant
Ask RIA