Marine Loading Arms Market Analysis, Size, and Forecast 2026-2030: APAC (China, India, and Japan), North America (US, Canada, and Mexico), Europe (Germany, The Netherlands, and France), Middle East and Africa (Saudi Arabia, UAE, and South Africa), South America (Brazil and Argentina), and Rest of World (ROW)

Marine Loading Arms Market Analysis, Size, and Forecast 2026-2030:
APAC (China, India, and Japan), North America (US, Canada, and Mexico), Europe (Germany, The Netherlands, and France), Middle East and Africa (Saudi Arabia, UAE, and South Africa), South America (Brazil and Argentina), and Rest of World (ROW)

Published: May 2026 310 Pages SKU: IRTNTR40469

Market Overview at a Glance

$86.19 Mn
Market Opportunity
4.1%
CAGR 2025 - 2030
36.9%
APAC Growth
$143.66 Mn
Crude oil segment 2024

Marine Loading Arms Market Size 2026-2030

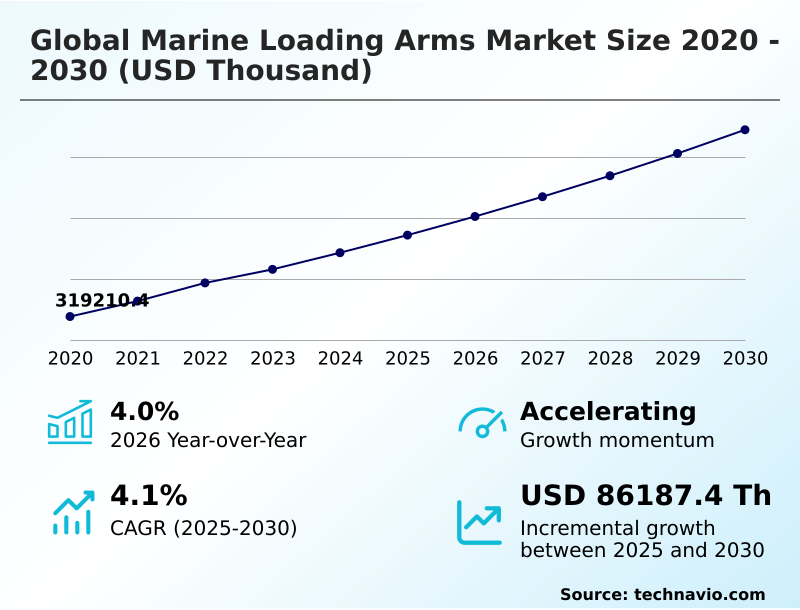
The Marine Loading Arms Market size was valued at USD 385.81 million in 2025, growing at a CAGR of 4.1% during the forecast period 2026-2030.

Major Market Trends & Insights

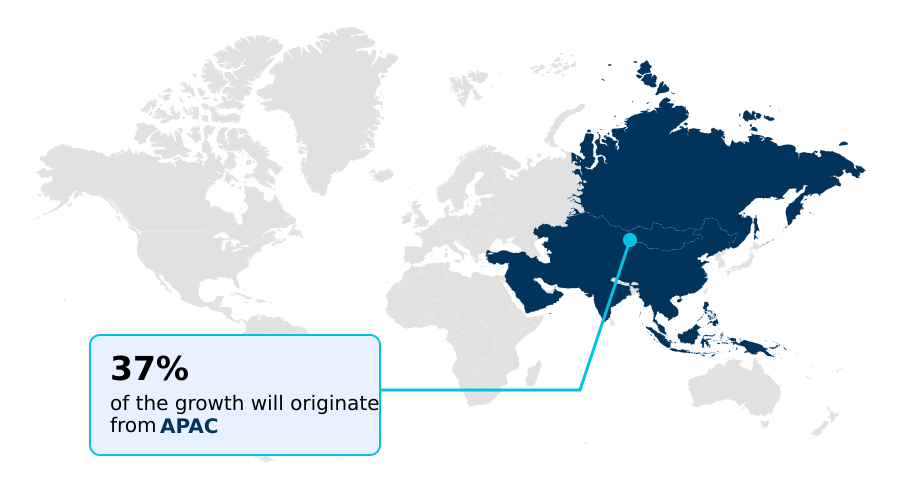
  • APAC dominated the market and accounted for a 36.9% growth during the forecast period.
  • By Application - Crude oil segment was valued at USD 143.66 million in 2024
  • By Type - Manual marine loading arms segment accounted for the largest market revenue share in 2024

Market Size & Forecast

  • Historic Market Opportunities 2020-2024:
  • Market Future Opportunities 2025-2030: USD 86.19 million
  • CAGR from 2025 to 2030 : 4.1%

Market Summary

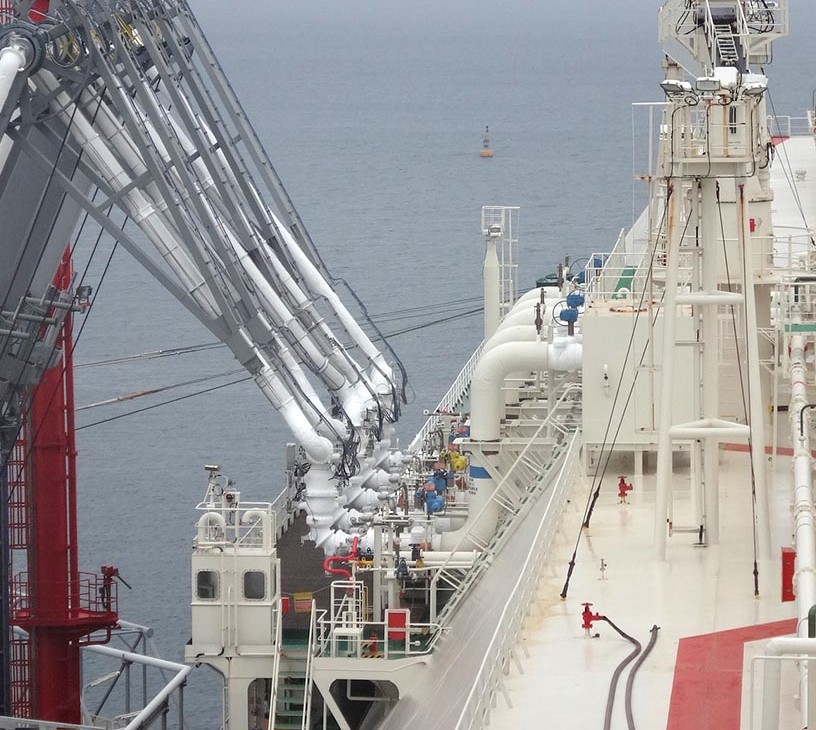
  • The marine loading arms market is defined by its critical role in energy and chemical logistics, where hydraulic systems now represent over 45% of new installations. These systems provide a more than 30% improvement in connection speed compared to manual marine loading arm counterparts, directly enhancing terminal throughput.
  • A primary driver is the global expansion of LNG transfer infrastructure, demanding advanced cryogenic loading arm technology to support the energy transition. Operations often involve complex vessel motion dynamics, requiring sophisticated motion compensation to ensure a safe operating envelope.
  • However, the market faces a significant challenge from the volatility in crude oil prices, which can delay capital expenditure on new port infrastructure and modernization projects, impacting manufacturer order books and supply chain logistics.

What will be the Size of the Marine Loading Arms Market during the forecast period?

Get Key Insights on Market Forecast (PDF) Request Free Sample

How is the Marine Loading Arms Market Segmented?

The marine loading arms industry research report provides comprehensive data (region-wise segment analysis), with forecasts and analysis for the period 2026-2030, as well as historical data from 2020-2024 for the following segments.

  • Application
    • Crude oil
    • LG
    • IG
  • Type
    • Manual marine loading arms
    • Hydraulic marine loading arms
  • Method
    • Top loading
    • Bottom Loading
  • Material
    • Carbon steel
    • Stainless steel
    • Aluminum
    • Others
  • Geography
    • APAC
      • China
      • India
      • Japan
    • North America
      • US
      • Canada
      • Mexico
    • Europe
      • Germany
      • The Netherlands
      • France
    • Middle East and Africa
      • Saudi Arabia
      • UAE
      • South Africa
    • South America
      • Brazil
      • Argentina
    • Rest of World (ROW)

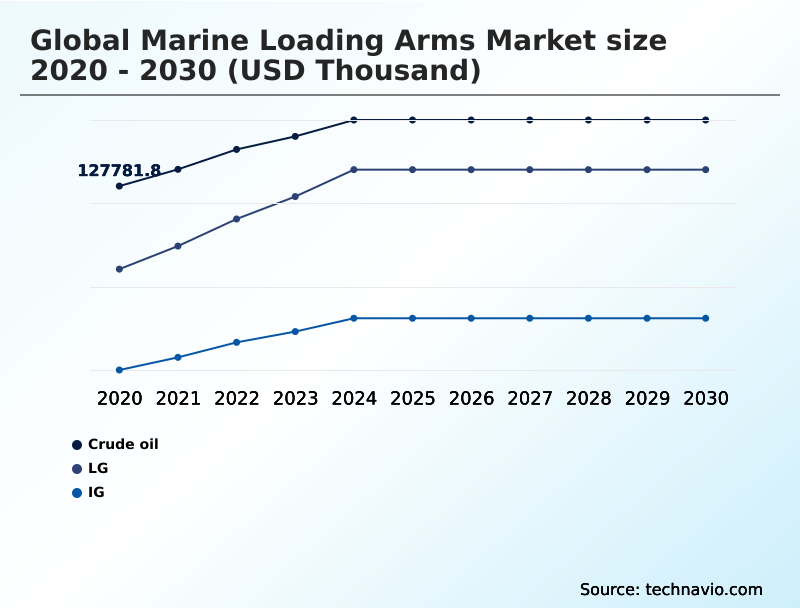
How is the Marine Loading Arms Market Segmented by Application?

The crude oil segment is estimated to witness significant growth during the forecast period.

The crude oil segment, which accounts for over 35% of all applications, remains the foundational application for marine loading arms.

These systems are engineered for the high-volume transfer of petroleum, requiring large nominal bore diameters, typically 20% greater than those used for chemical transfers, to maximize terminal throughput.

The construction relies on robust carbon steel to handle operational pressures and the abrasive nature of raw petroleum.

Modern designs incorporate advanced vapor recovery systems and emergency release systems (ERS), which mitigate fugitive emissions and improve disconnection safety by over 99%, meeting stringent environmental and port infrastructure regulations.

This focus on safety and efficiency is critical for maintaining asset integrity in high-consequence cargo handling operations.

Request Free Sample

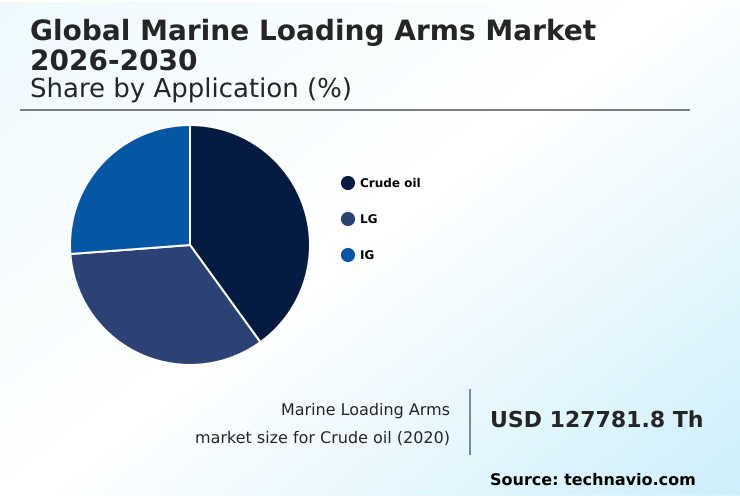
The Crude oil segment was valued at USD 143.66 million in 2024 and showed a gradual increase during the forecast period.

Request Free Sample

How demand for the Marine Loading Arms market is rising in the leading region?

APAC is estimated to contribute 36.9% to the growth of the global market during the forecast period.Technavio’s analysts have elaborately explained the regional trends and drivers that shape the market during the forecast period.

See How Marine Loading Arms Market demand is rising in APAC Request Free Sample

The geographic landscape of the marine loading arms market is led by APAC, which is projected to contribute 37% of the market's incremental growth, outpacing North America's 31% share.

This dominance is fueled by massive port infrastructure investments in countries like China and India, whose energy demands are driving the construction of new LNG import terminals and petrochemical handling facilities.

In contrast, the market in Europe, which accounts for approximately 16% of growth, is primarily driven by retrofitting and modernization projects focused on regulatory compliance and enhancing terminal throughput.

North America's growth is concentrated in the US Gulf Coast, where a boom in hydrocarbon infrastructure for LNG and crude oil exports necessitates new installations of high-capacity hydraulic marine loading arms.

This regional difference in drivers—new builds in APAC versus upgrades in Europe—shapes global supply chain logistics and sales strategies.

What are the key Drivers, Trends, and Challenges in the Marine Loading Arms Market?

Our researchers analyzed the data with 2025 as the base year, along with the key drivers, trends, and challenges. A holistic analysis of drivers will help companies refine their marketing strategies to gain a competitive advantage.

  • Terminal operators evaluating the total cost of marine loading arm installation must consider factors beyond the initial purchase price, including long-term operational efficiency and asset integrity. The decision between a manual loading arm and a hydraulic marine loading arm often hinges on terminal throughput requirements and safety protocols, with hydraulic systems offering a 25% faster connection time on average.
  • For facilities handling LNG transfer, the selection of a cryogenic marine loading arm for LNG transfer is non-negotiable, requiring specialized materials and swivel joint technology to handle extreme temperatures. Proper marine loading arm maintenance and inspection are critical to prevent spills and ensure regulatory compliance, forming a significant part of the lifecycle cost.
  • Furthermore, integrating motion compensating systems for offshore loading is essential for operations in challenging sea conditions, ensuring a safe operating envelope and protecting both equipment and personnel. Understanding the specific safety features of hydraulic marine loading arms, such as the emergency release system (ERS), is paramount for risk management in all hazardous fluid transfer scenarios.
  • These considerations are fundamental to modern port modernization and hydrocarbon infrastructure projects.

What are the key market drivers leading to the rise in the adoption of Marine Loading Arms Industry?

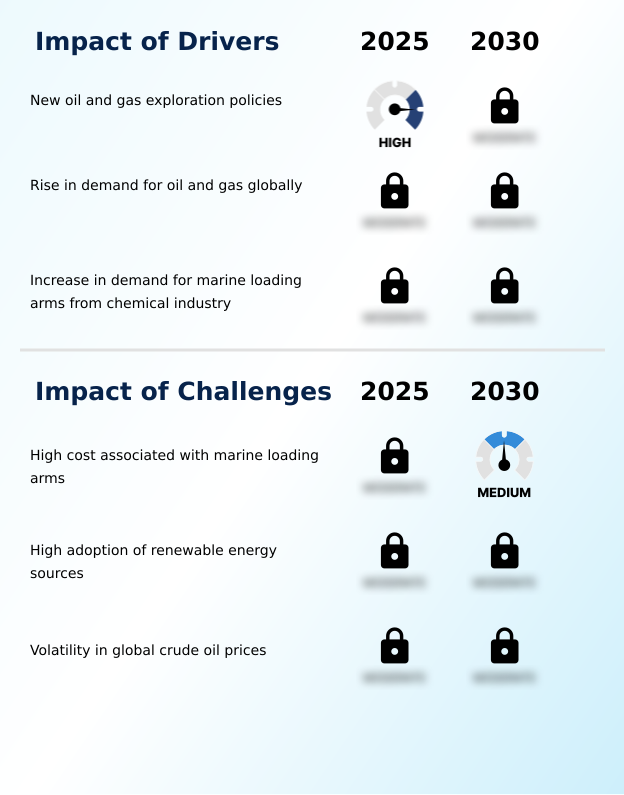
  • New oil and gas exploration policies are a key driver for the market, stimulating investment in hydrocarbon infrastructure and increasing the demand for efficient fluid transfer equipment.

  • Rising global energy demand is a primary driver, with projections indicating a more than 700,000 barrel-per-day increase in oil consumption, directly boosting the need for efficient fluid transfer equipment.
  • This surge necessitates significant investment in port modernization and new hydrocarbon infrastructure to expand cargo handling capacity.
  • Simultaneously, the chemical industry's expansion, particularly in APAC, is projected to grow by 5-6% annually, fueling demand for specialized loading arms for petrochemical handling.
  • The growing international trade in LNG, driven by the global push for cleaner energy transition fuels, requires a substantial build-out of terminals equipped with advanced cryogenic loading arm technology.
  • This confluence of demand from the oil, gas, and chemical sectors underpins the sustained need for new marine transfer systems globally.

What are the market trends shaping the Marine Loading Arms Industry?

  • The advent of motion-recognizing marine loading arms represents a significant market trend. This innovation is driven by the increasing need for enhanced safety and operational efficiency during fluid transfer.

  • The market is shifting toward intelligent and flexible fluid transfer equipment, with motion-recognizing marine loading arms delivering over 20% improvements in operational efficiency. This trend is driven by the need to manage complex vessel motion dynamics during LNG transfer, where automated positioning can reduce connection time by up to 30%.
  • The emergence of mobile marine loading arms provides enhanced flexibility for jetty operations, allowing for quicker adaptation to different cargo handling needs without fixed port infrastructure. Innovations focus on integrating remote diagnostics and a robust counterweight system to improve safety and simplify preventive maintenance.
  • These advancements in terminal automation are critical for operators looking to improve terminal throughput and ensure a safe operating envelope, especially in FLNG applications and bunkering operations.

What challenges does the Marine Loading Arms Industry face during its growth?

  • The high initial capital investment and long-term maintenance costs associated with marine loading arms present a significant challenge to market growth, particularly for smaller terminal operators.

  • The high cost associated with marine loading arms, with prices for a single hydraulic unit ranging from USD 50,000 to over USD 250,000, presents a significant barrier to adoption for many operators. This capital expenditure is often 3-4 times higher than that for flexible hose alternatives, although the lifecycle cost and safety benefits differ.
  • Price volatility in the crude oil market creates further challenges, as a sudden downturn can lead to the deferral of up to 40% of planned capital projects for port infrastructure upgrades, directly impacting manufacturers' order pipelines.
  • This financial uncertainty complicates long-term investment in advanced technologies like the articulated arm or systems with integrated motion compensation, forcing operators to balance immediate costs against long-term operational efficiency and regulatory compliance requirements.

Exclusive Technavio Analysis on Customer Landscape

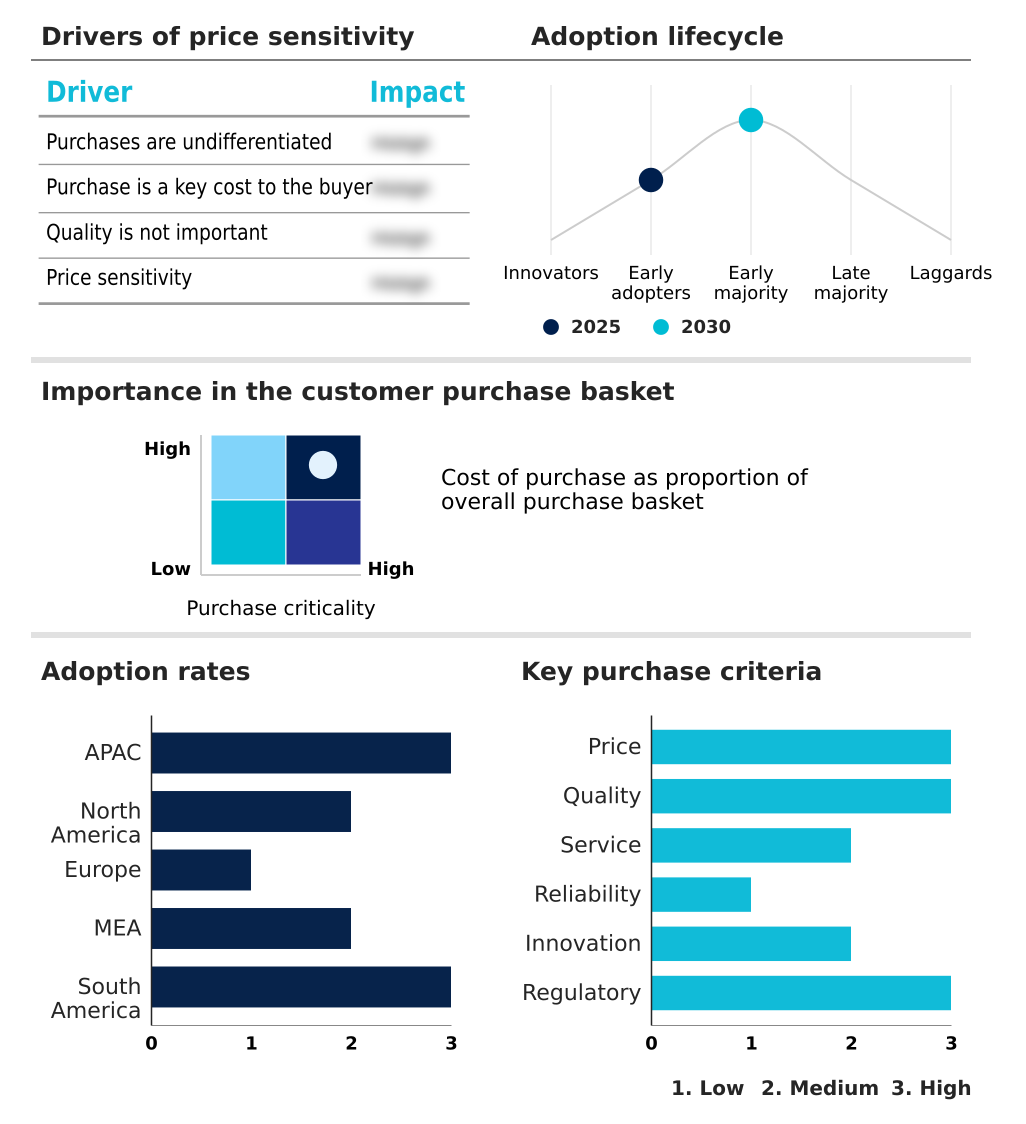
The marine loading arms market forecasting report includes the adoption lifecycle of the market, covering from the innovator’s stage to the laggard’s stage. It focuses on adoption rates in different regions based on penetration. Furthermore, the marine loading arms market report also includes key purchase criteria and drivers of price sensitivity to help companies evaluate and develop their market growth analysis strategies.

Customer Landscape of Marine Loading Arms Industry

Competitive Landscape

Companies are implementing various strategies, such as strategic alliances, marine loading arms market forecast, partnerships, mergers and acquisitions, geographical expansion, and product/service launches, to enhance their presence in the industry.

Baretti - Provides specialized fluid transfer equipment and integrated arm systems, including the 400 Series, engineered for industrial loading and precision fluid management applications across multiple sectors.

The industry research and growth report includes detailed analyses of the competitive landscape of the market and information about key companies, including:

  • Baretti
  • Carbis Loadtec Group
  • Flotech Performance Systems
  • Ingersoll Rand Inc.
  • J de Jonge Group
  • Jiangsu Changlong Co. Ltd.
  • JRE Pvt. Ltd.
  • KANON Loading Equipment BV
  • Lianyungang HUADE Co. Ltd.
  • Lloyds Steel Industries Ltd.
  • OGCF Engineering M Sdn Bhd.
  • OPW Engineered Systems
  • Safe Harbor Access Systems
  • SVT APAC Pte. Ltd.
  • TB Global Technologies Ltd.
  • TechnipFMC plc
  • WLT liquid and gas BV
  • Woodfield Systems

Qualitative and quantitative analysis of companies has been conducted to help clients understand the wider business environment as well as the strengths and weaknesses of key industry players. Data is qualitatively analyzed to categorize companies as pure play, category-focused, industry-focused, and diversified; it is quantitatively analyzed to categorize companies as dominant, leading, strong, tentative, and weak.

Market Intelligence Radar: High-Impact Developments & Growth Signals

  • In the Marine Transportation industry, the accelerated adoption of Liquefied Natural Gas (LNG) as a primary marine fuel has directly increased demand for specialized cryogenic marine loading arms. This shift, driven by the need to comply with stricter emissions standards, necessitates new bunkering operations infrastructure at major ports, creating a high-value niche for equipment capable of handling cryogenic fluid.
  • Stringent international regulations, such as the International Maritime Organization's (IMO) mandates on sulfur emissions, have forced a focus on cleaner fuels and advanced vapor recovery systems. This regulatory compliance push is a primary driver for the retrofitting of older terminals with modern marine transfer solutions that minimize environmental impact during cargo handling.
  • A significant trend toward port modernization involves the integration of terminal automation and digital twin technologies for optimizing jetty operations. This development fuels the demand for smart articulated arms equipped with sensors for remote diagnostics and automated positioning, enhancing both operational efficiency and safety.
  • The strategic development of new energy export hubs focused on energy transition fuels, such as green ammonia and liquid hydrogen, is creating future demand for a new generation of marine loading arms. These projects require advanced material science and engineering to ensure the safe transfer of highly specialized and often corrosive fluids, reshaping long-term R&D priorities for manufacturers.

Dive into Technavio’s robust research methodology, blending expert interviews, extensive data synthesis, and validated models for unparalleled Marine Loading Arms Market insights. See full methodology.

Market Scope
Page number 310
Base year 2025
Historic period 2020-2024
Forecast period 2026-2030
Growth momentum & CAGR Accelerate at a CAGR of 4.1%
Market growth 2026-2030 USD 86187.4 thousand
Market structure Fragmented
YoY growth 2025-2026(%) 4.0%
Key countries China, India, Japan, South Korea, Australia, Indonesia, US, Canada, Mexico, Germany, The Netherlands, Norway, France, Italy, Spain, Saudi Arabia, UAE, South Africa, Egypt, Turkey, Brazil, Argentina and Chile
Competitive landscape Leading Companies, Market Positioning of Companies, Competitive Strategies, and Industry Risks

Request Free Sample

Research Analyst Overview

  • The marine loading arms market ecosystem is a complex network where raw material suppliers of high-grade carbon steel construction and stainless steel fabrication provide essential inputs to equipment manufacturers. These manufacturers, in turn, produce systems like the cryogenic loading arm and hydraulic power unit, which are then supplied to end-users such as oil and gas terminals and petrochemical handling facilities.
  • Regulatory bodies like the Oil Companies International Marine Forum (OCIMF) establish the design and safety standards, heavily influencing product development and necessitating features like an emergency release system (ERS). This creates a market where manufacturers must balance the high cost of regulatory compliance with end-user demands for operational efficiency, where advanced systems can improve terminal throughput by over 15%.
  • Supporting entities focused on logistics and installation play a vital role in port modernization projects, ensuring these complex systems are integrated correctly into existing port infrastructure.

What are the Key Data Covered in this Marine Loading Arms Market Research and Growth Report?

  • What is the expected growth of the Marine Loading Arms Market between 2026 and 2030?

    • The Marine Loading Arms Market is expected to grow by USD 86.19 million during 2026-2030, registering a CAGR of 4.1%. Year-over-year growth in 2026 is estimated at 4.0%%. This acceleration is shaped by new oil and gas exploration policies, which is intensifying demand across multiple end-use verticals covered in the report.

  • What segmentation does the market report cover?

    • The report is segmented by Application (Crude oil, LG, and IG), Type (Manual marine loading arms, and Hydraulic marine loading arms), Method (Top loading, and Bottom Loading), Material (Carbon steel, Stainless steel, Aluminum, and Others) and Geography (APAC, North America, Europe, Middle East and Africa, South America). Among these, the Crude oil segment is estimated to witness significant growth during the forecast period, driven by rising adoption across key application areas. Each segment includes detailed qualitative and quantitative analysis, along with historical data from 2020-2024 and forecasts through 2030 with year-over-year growth rates.

  • Which regions are analyzed in the report?

    • The report covers APAC, North America, Europe, Middle East and Africa and South America. APAC is estimated to contribute 36.9% to market growth during the forecast period. Country-level analysis includes China, India, Japan, South Korea, Australia, Indonesia, US, Canada, Mexico, Germany, The Netherlands, Norway, France, Italy, Spain, Saudi Arabia, UAE, South Africa, Egypt, Turkey, Brazil, Argentina and Chile, with dedicated market size tables and year-over-year growth for each.

  • What are the key growth drivers and market challenges?

    • The primary driver is new oil and gas exploration policies, which is accelerating investment and industry demand. The main challenge is high cost associated with marine loading arms, creating operational barriers for key market participants. The report quantifies the impact of each driver and challenge across 2026 and 2030 with comparative analysis.

  • Who are the major players in the Marine Loading Arms Market?

    • Key vendors include Baretti, Carbis Loadtec Group, Flotech Performance Systems, Ingersoll Rand Inc., J de Jonge Group, Jiangsu Changlong Co. Ltd., JRE Pvt. Ltd., KANON Loading Equipment BV, Lianyungang HUADE Co. Ltd., Lloyds Steel Industries Ltd., OGCF Engineering M Sdn Bhd., OPW Engineered Systems, Safe Harbor Access Systems, SVT APAC Pte. Ltd., TB Global Technologies Ltd., TechnipFMC plc, WLT liquid and gas BV and Woodfield Systems. The report provides qualitative and quantitative analysis categorizing companies as dominant, leading, strong, tentative, and weak based on their market positioning. Company profiles include business segment analysis, SWOT assessment, key offerings, and recent strategic developments.

Market Research Insights

  • The competitive landscape for marine loading arms is moderately fragmented, with the top five vendors comprising less than 40% of the market share. Key players like TechnipFMC plc and Ingersoll Rand Inc. are focusing on technological differentiation, particularly in cryogenic loading arm systems for the expanding LNG market.
  • Recent innovations center on terminal automation and the integration of remote diagnostics, which can reduce unplanned downtime by up to 15%. This shift addresses the end-user demand for higher operational efficiency and enhanced safety in hazardous fluid transfer.
  • A persistent challenge remains the high capital expenditure required for these advanced systems, compelling vendors to offer comprehensive lifecycle cost analyses and preventive maintenance packages to justify the initial investment and ensure long-term asset integrity.

We can help! Our analysts can customize this marine loading arms market research report to meet your requirements.

Get in touch

1. Executive Summary

1.1 Market overview

Executive Summary - Chart on Market Overview
Executive Summary - Data Table on Market Overview
Executive Summary - Chart on Global Market Characteristics
Executive Summary - Chart on Market by Geography
Executive Summary - Chart on Market Segmentation by Application
Executive Summary - Chart on Market Segmentation by Type
Executive Summary - Chart on Market Segmentation by Method
Executive Summary - Chart on Market Segmentation by Material
Executive Summary - Chart on Incremental Growth
Executive Summary - Data Table on Incremental Growth
Executive Summary - Chart on Company Market Positioning

2. Technavio Analysis

2.1 Analysis of price sensitivity, lifecycle, customer purchase basket, adoption rates, and purchase criteria

2.2 Criticality of inputs and Factors of differentiation

Chart on Overview on criticality of inputs and factors of differentiation

2.3 Factors of disruption

Chart on Overview on factors of disruption

2.4 Impact of drivers and challenges

Chart on Impact of drivers and challenges in 2025 and 2030

3. Market Landscape

3.1 Market ecosystem

Chart on Parent Market
Data Table on - Parent Market

3.2 Market characteristics

Chart on Market characteristics analysis

3.3 Value chain analysis

Chart on Value chain analysis

4. Market Sizing

4.1 Market definition

Data Table on Offerings of companies included in the market definition

4.2 Market segment analysis

Market segments

4.3 Market size 2025

4.4 Market outlook: Forecast for 2025-2030

Chart on Global - Market size and forecast 2025-2030 ($ thousand)
Data Table on Global - Market size and forecast 2025-2030 ($ thousand)
Chart on Global Market: Year-over-year growth 2025-2030 (%)
Data Table on Global Market: Year-over-year growth 2025-2030 (%)

5. Historic Market Size

5.1 Global Marine Loading Arms Market 2020 - 2024

Historic Market Size - Data Table on Global Marine Loading Arms Market 2020 - 2024 ($ thousand)

5.2 Application segment analysis 2020 - 2024

Historic Market Size - Application Segment 2020 - 2024 ($ thousand)

5.3 Type segment analysis 2020 - 2024

Historic Market Size - Type Segment 2020 - 2024 ($ thousand)

5.4 Method segment analysis 2020 - 2024

Historic Market Size - Method Segment 2020 - 2024 ($ thousand)

5.5 Material segment analysis 2020 - 2024

Historic Market Size - Material Segment 2020 - 2024 ($ thousand)

5.6 Geography segment analysis 2020 - 2024

Historic Market Size - Geography Segment 2020 - 2024 ($ thousand)

5.7 Country segment analysis 2020 - 2024

Historic Market Size - Country Segment 2020 - 2024 ($ thousand)

6. Qualitative Analysis

6.1 The AI impact on Global Marine Loading Arms Market

7. Five Forces Analysis

7.1 Five forces summary

Five forces analysis - Comparison between 2025 and 2030

7.2 Bargaining power of buyers

Bargaining power of buyers - Impact of key factors 2025 and 2030

7.3 Bargaining power of suppliers

Bargaining power of suppliers - Impact of key factors in 2025 and 2030

7.4 Threat of new entrants

Threat of new entrants - Impact of key factors in 2025 and 2030

7.5 Threat of substitutes

Threat of substitutes - Impact of key factors in 2025 and 2030

7.6 Threat of rivalry

Threat of rivalry - Impact of key factors in 2025 and 2030

7.7 Market condition

Chart on Market condition - Five forces 2025 and 2030

8. Market Segmentation by Application

8.1 Market segments

Chart on Application - Market share 2025-2030 (%)
Data Table on Application - Market share 2025-2030 (%)

8.2 Comparison by Application

Chart on Comparison by Application
Data Table on Comparison by Application

8.3 Crude oil - Market size and forecast 2025-2030

Chart on Crude oil - Market size and forecast 2025-2030 ($ thousand)
Data Table on Crude oil - Market size and forecast 2025-2030 ($ thousand)
Chart on Crude oil - Year-over-year growth 2025-2030 (%)
Data Table on Crude oil - Year-over-year growth 2025-2030 (%)

8.4 LG - Market size and forecast 2025-2030

Chart on LG - Market size and forecast 2025-2030 ($ thousand)
Data Table on LG - Market size and forecast 2025-2030 ($ thousand)
Chart on LG - Year-over-year growth 2025-2030 (%)
Data Table on LG - Year-over-year growth 2025-2030 (%)

8.5 IG - Market size and forecast 2025-2030

Chart on IG - Market size and forecast 2025-2030 ($ thousand)
Data Table on IG - Market size and forecast 2025-2030 ($ thousand)
Chart on IG - Year-over-year growth 2025-2030 (%)
Data Table on IG - Year-over-year growth 2025-2030 (%)

8.6 Market opportunity by Application

Market opportunity by Application ($ thousand)
Data Table on Market opportunity by Application ($ thousand)

9. Market Segmentation by Type

9.1 Market segments

Chart on Type - Market share 2025-2030 (%)
Data Table on Type - Market share 2025-2030 (%)

9.2 Comparison by Type

Chart on Comparison by Type
Data Table on Comparison by Type

9.3 Manual marine loading arms - Market size and forecast 2025-2030

Chart on Manual marine loading arms - Market size and forecast 2025-2030 ($ thousand)
Data Table on Manual marine loading arms - Market size and forecast 2025-2030 ($ thousand)
Chart on Manual marine loading arms - Year-over-year growth 2025-2030 (%)
Data Table on Manual marine loading arms - Year-over-year growth 2025-2030 (%)

9.4 Hydraulic marine loading arms - Market size and forecast 2025-2030

Chart on Hydraulic marine loading arms - Market size and forecast 2025-2030 ($ thousand)
Data Table on Hydraulic marine loading arms - Market size and forecast 2025-2030 ($ thousand)
Chart on Hydraulic marine loading arms - Year-over-year growth 2025-2030 (%)
Data Table on Hydraulic marine loading arms - Year-over-year growth 2025-2030 (%)

9.5 Market opportunity by Type

Market opportunity by Type ($ thousand)
Data Table on Market opportunity by Type ($ thousand)

10. Market Segmentation by Method

10.1 Market segments

Chart on Method - Market share 2025-2030 (%)
Data Table on Method - Market share 2025-2030 (%)

10.2 Comparison by Method

Chart on Comparison by Method
Data Table on Comparison by Method

10.3 Top loading - Market size and forecast 2025-2030

Chart on Top loading - Market size and forecast 2025-2030 ($ thousand)
Data Table on Top loading - Market size and forecast 2025-2030 ($ thousand)
Chart on Top loading - Year-over-year growth 2025-2030 (%)
Data Table on Top loading - Year-over-year growth 2025-2030 (%)

10.4 Bottom Loading - Market size and forecast 2025-2030

Chart on Bottom Loading - Market size and forecast 2025-2030 ($ thousand)
Data Table on Bottom Loading - Market size and forecast 2025-2030 ($ thousand)
Chart on Bottom Loading - Year-over-year growth 2025-2030 (%)
Data Table on Bottom Loading - Year-over-year growth 2025-2030 (%)

10.5 Market opportunity by Method

Market opportunity by Method ($ thousand)
Data Table on Market opportunity by Method ($ thousand)

11. Market Segmentation by Material

11.1 Market segments

Chart on Material - Market share 2025-2030 (%)
Data Table on Material - Market share 2025-2030 (%)

11.2 Comparison by Material

Chart on Comparison by Material
Data Table on Comparison by Material

11.3 Carbon steel - Market size and forecast 2025-2030

Chart on Carbon steel - Market size and forecast 2025-2030 ($ thousand)
Data Table on Carbon steel - Market size and forecast 2025-2030 ($ thousand)
Chart on Carbon steel - Year-over-year growth 2025-2030 (%)
Data Table on Carbon steel - Year-over-year growth 2025-2030 (%)

11.4 Stainless steel - Market size and forecast 2025-2030

Chart on Stainless steel - Market size and forecast 2025-2030 ($ thousand)
Data Table on Stainless steel - Market size and forecast 2025-2030 ($ thousand)
Chart on Stainless steel - Year-over-year growth 2025-2030 (%)
Data Table on Stainless steel - Year-over-year growth 2025-2030 (%)

11.5 Aluminum - Market size and forecast 2025-2030

Chart on Aluminum - Market size and forecast 2025-2030 ($ thousand)
Data Table on Aluminum - Market size and forecast 2025-2030 ($ thousand)
Chart on Aluminum - Year-over-year growth 2025-2030 (%)
Data Table on Aluminum - Year-over-year growth 2025-2030 (%)

11.6 Others - Market size and forecast 2025-2030

Chart on Others - Market size and forecast 2025-2030 ($ thousand)
Data Table on Others - Market size and forecast 2025-2030 ($ thousand)
Chart on Others - Year-over-year growth 2025-2030 (%)
Data Table on Others - Year-over-year growth 2025-2030 (%)

11.7 Market opportunity by Material

Market opportunity by Material ($ thousand)
Data Table on Market opportunity by Material ($ thousand)

12. Customer Landscape

12.1 Customer landscape overview

Analysis of price sensitivity, lifecycle, customer purchase basket, adoption rates, and purchase criteria

13. Geographic Landscape

13.1 Geographic segmentation

Chart on Market share by geography 2025-2030 (%)
Data Table on Market share by geography 2025-2030 (%)

13.2 Geographic comparison

Chart on Geographic comparison
Data Table on Geographic comparison

13.3 APAC - Market size and forecast 2025-2030

Chart on APAC - Market size and forecast 2025-2030 ($ thousand)
Data Table on APAC - Market size and forecast 2025-2030 ($ thousand)
Chart on APAC - Year-over-year growth 2025-2030 (%)
Data Table on APAC - Year-over-year growth 2025-2030 (%)
Chart on Regional Comparison - APAC
Data Table on Regional Comparison - APAC

13.3.1 China - Market size and forecast 2025-2030

Chart on China - Market size and forecast 2025-2030 ($ thousand)
Data Table on China - Market size and forecast 2025-2030 ($ thousand)
Chart on China - Year-over-year growth 2025-2030 (%)
Data Table on China - Year-over-year growth 2025-2030 (%)

13.3.2 India - Market size and forecast 2025-2030

Chart on India - Market size and forecast 2025-2030 ($ thousand)
Data Table on India - Market size and forecast 2025-2030 ($ thousand)
Chart on India - Year-over-year growth 2025-2030 (%)
Data Table on India - Year-over-year growth 2025-2030 (%)

13.3.3 Japan - Market size and forecast 2025-2030

Chart on Japan - Market size and forecast 2025-2030 ($ thousand)
Data Table on Japan - Market size and forecast 2025-2030 ($ thousand)
Chart on Japan - Year-over-year growth 2025-2030 (%)
Data Table on Japan - Year-over-year growth 2025-2030 (%)

13.3.4 South Korea - Market size and forecast 2025-2030

Chart on South Korea - Market size and forecast 2025-2030 ($ thousand)
Data Table on South Korea - Market size and forecast 2025-2030 ($ thousand)
Chart on South Korea - Year-over-year growth 2025-2030 (%)
Data Table on South Korea - Year-over-year growth 2025-2030 (%)

13.3.5 Australia - Market size and forecast 2025-2030

Chart on Australia - Market size and forecast 2025-2030 ($ thousand)
Data Table on Australia - Market size and forecast 2025-2030 ($ thousand)
Chart on Australia - Year-over-year growth 2025-2030 (%)
Data Table on Australia - Year-over-year growth 2025-2030 (%)

13.3.6 Indonesia - Market size and forecast 2025-2030

Chart on Indonesia - Market size and forecast 2025-2030 ($ thousand)
Data Table on Indonesia - Market size and forecast 2025-2030 ($ thousand)
Chart on Indonesia - Year-over-year growth 2025-2030 (%)
Data Table on Indonesia - Year-over-year growth 2025-2030 (%)

13.4 North America - Market size and forecast 2025-2030

Chart on North America - Market size and forecast 2025-2030 ($ thousand)
Data Table on North America - Market size and forecast 2025-2030 ($ thousand)
Chart on North America - Year-over-year growth 2025-2030 (%)
Data Table on North America - Year-over-year growth 2025-2030 (%)
Chart on Regional Comparison - North America
Data Table on Regional Comparison - North America

13.4.1 US - Market size and forecast 2025-2030

Chart on US - Market size and forecast 2025-2030 ($ thousand)
Data Table on US - Market size and forecast 2025-2030 ($ thousand)
Chart on US - Year-over-year growth 2025-2030 (%)
Data Table on US - Year-over-year growth 2025-2030 (%)

13.4.2 Canada - Market size and forecast 2025-2030

Chart on Canada - Market size and forecast 2025-2030 ($ thousand)
Data Table on Canada - Market size and forecast 2025-2030 ($ thousand)
Chart on Canada - Year-over-year growth 2025-2030 (%)
Data Table on Canada - Year-over-year growth 2025-2030 (%)

13.4.3 Mexico - Market size and forecast 2025-2030

Chart on Mexico - Market size and forecast 2025-2030 ($ thousand)
Data Table on Mexico - Market size and forecast 2025-2030 ($ thousand)
Chart on Mexico - Year-over-year growth 2025-2030 (%)
Data Table on Mexico - Year-over-year growth 2025-2030 (%)

13.5 Europe - Market size and forecast 2025-2030

Chart on Europe - Market size and forecast 2025-2030 ($ thousand)
Data Table on Europe - Market size and forecast 2025-2030 ($ thousand)
Chart on Europe - Year-over-year growth 2025-2030 (%)
Data Table on Europe - Year-over-year growth 2025-2030 (%)
Chart on Regional Comparison - Europe
Data Table on Regional Comparison - Europe

13.5.1 Germany - Market size and forecast 2025-2030

Chart on Germany - Market size and forecast 2025-2030 ($ thousand)
Data Table on Germany - Market size and forecast 2025-2030 ($ thousand)
Chart on Germany - Year-over-year growth 2025-2030 (%)
Data Table on Germany - Year-over-year growth 2025-2030 (%)

13.5.2 The Netherlands - Market size and forecast 2025-2030

Chart on The Netherlands - Market size and forecast 2025-2030 ($ thousand)
Data Table on The Netherlands - Market size and forecast 2025-2030 ($ thousand)
Chart on The Netherlands - Year-over-year growth 2025-2030 (%)
Data Table on The Netherlands - Year-over-year growth 2025-2030 (%)

13.5.3 Norway - Market size and forecast 2025-2030

Chart on Norway - Market size and forecast 2025-2030 ($ thousand)
Data Table on Norway - Market size and forecast 2025-2030 ($ thousand)
Chart on Norway - Year-over-year growth 2025-2030 (%)
Data Table on Norway - Year-over-year growth 2025-2030 (%)

13.5.4 France - Market size and forecast 2025-2030

Chart on France - Market size and forecast 2025-2030 ($ thousand)
Data Table on France - Market size and forecast 2025-2030 ($ thousand)
Chart on France - Year-over-year growth 2025-2030 (%)
Data Table on France - Year-over-year growth 2025-2030 (%)

13.5.5 Italy - Market size and forecast 2025-2030

Chart on Italy - Market size and forecast 2025-2030 ($ thousand)
Data Table on Italy - Market size and forecast 2025-2030 ($ thousand)
Chart on Italy - Year-over-year growth 2025-2030 (%)
Data Table on Italy - Year-over-year growth 2025-2030 (%)

13.5.6 Spain - Market size and forecast 2025-2030

Chart on Spain - Market size and forecast 2025-2030 ($ thousand)
Data Table on Spain - Market size and forecast 2025-2030 ($ thousand)
Chart on Spain - Year-over-year growth 2025-2030 (%)
Data Table on Spain - Year-over-year growth 2025-2030 (%)

13.6 Middle East and Africa - Market size and forecast 2025-2030

Chart on Middle East and Africa - Market size and forecast 2025-2030 ($ thousand)
Data Table on Middle East and Africa - Market size and forecast 2025-2030 ($ thousand)
Chart on Middle East and Africa - Year-over-year growth 2025-2030 (%)
Data Table on Middle East and Africa - Year-over-year growth 2025-2030 (%)
Chart on Regional Comparison - Middle East and Africa
Data Table on Regional Comparison - Middle East and Africa

13.6.1 Saudi Arabia - Market size and forecast 2025-2030

Chart on Saudi Arabia - Market size and forecast 2025-2030 ($ thousand)
Data Table on Saudi Arabia - Market size and forecast 2025-2030 ($ thousand)
Chart on Saudi Arabia - Year-over-year growth 2025-2030 (%)
Data Table on Saudi Arabia - Year-over-year growth 2025-2030 (%)

13.6.2 UAE - Market size and forecast 2025-2030

Chart on UAE - Market size and forecast 2025-2030 ($ thousand)
Data Table on UAE - Market size and forecast 2025-2030 ($ thousand)
Chart on UAE - Year-over-year growth 2025-2030 (%)
Data Table on UAE - Year-over-year growth 2025-2030 (%)

13.6.3 South Africa - Market size and forecast 2025-2030

Chart on South Africa - Market size and forecast 2025-2030 ($ thousand)
Data Table on South Africa - Market size and forecast 2025-2030 ($ thousand)
Chart on South Africa - Year-over-year growth 2025-2030 (%)
Data Table on South Africa - Year-over-year growth 2025-2030 (%)

13.6.4 Egypt - Market size and forecast 2025-2030

Chart on Egypt - Market size and forecast 2025-2030 ($ thousand)
Data Table on Egypt - Market size and forecast 2025-2030 ($ thousand)
Chart on Egypt - Year-over-year growth 2025-2030 (%)
Data Table on Egypt - Year-over-year growth 2025-2030 (%)

13.6.5 Turkey - Market size and forecast 2025-2030

Chart on Turkey - Market size and forecast 2025-2030 ($ thousand)
Data Table on Turkey - Market size and forecast 2025-2030 ($ thousand)
Chart on Turkey - Year-over-year growth 2025-2030 (%)
Data Table on Turkey - Year-over-year growth 2025-2030 (%)

13.7 South America - Market size and forecast 2025-2030

Chart on South America - Market size and forecast 2025-2030 ($ thousand)
Data Table on South America - Market size and forecast 2025-2030 ($ thousand)
Chart on South America - Year-over-year growth 2025-2030 (%)
Data Table on South America - Year-over-year growth 2025-2030 (%)
Chart on Regional Comparison - South America
Data Table on Regional Comparison - South America

13.7.1 Brazil - Market size and forecast 2025-2030

Chart on Brazil - Market size and forecast 2025-2030 ($ thousand)
Data Table on Brazil - Market size and forecast 2025-2030 ($ thousand)
Chart on Brazil - Year-over-year growth 2025-2030 (%)
Data Table on Brazil - Year-over-year growth 2025-2030 (%)

13.7.2 Argentina - Market size and forecast 2025-2030

Chart on Argentina - Market size and forecast 2025-2030 ($ thousand)
Data Table on Argentina - Market size and forecast 2025-2030 ($ thousand)
Chart on Argentina - Year-over-year growth 2025-2030 (%)
Data Table on Argentina - Year-over-year growth 2025-2030 (%)

13.7.3 Chile - Market size and forecast 2025-2030

Chart on Chile - Market size and forecast 2025-2030 ($ thousand)
Data Table on Chile - Market size and forecast 2025-2030 ($ thousand)
Chart on Chile - Year-over-year growth 2025-2030 (%)
Data Table on Chile - Year-over-year growth 2025-2030 (%)

13.8 Market opportunity by geography

Market opportunity by geography ($ thousand)
Data Tables on Market opportunity by geography ($ thousand)

14. Drivers, Challenges, and Opportunity

14.1 Market drivers

New oil and gas exploration policies
Rise in demand for oil and gas globally
Increase in demand for marine loading arms from chemical industry

14.2 Market challenges

High cost associated with marine loading arms
High adoption of renewable energy sources
Volatility in global crude oil prices

14.3 Impact of drivers and challenges

Impact of drivers and challenges in 2025 and 2030

14.4 Market opportunities

Advent of motion-recognizing marine loading arms
Emergence of mobile marine loading arm
Growing popularity of LNG fuel

15. Competitive Landscape

15.1 Overview

15.2

Overview on criticality of inputs and factors of differentiation

15.3 Landscape disruption

Overview on factors of disruption

15.4 Industry risks

Impact of key risks on business

16. Competitive Analysis

16.1 Companies profiled

Companies covered

16.2 Company ranking index

16.3 Market positioning of companies

Matrix on companies position and classification

16.4 Baretti

Baretti - Overview
Baretti - Product / Service
Baretti - Key offerings
SWOT

16.5 Carbis Loadtec Group

Carbis Loadtec Group - Overview
Carbis Loadtec Group - Product / Service
Carbis Loadtec Group - Key offerings
SWOT

16.6 Flotech Performance Systems

Flotech Performance Systems - Overview
Flotech Performance Systems - Product / Service
Flotech Performance Systems - Key offerings
SWOT

16.7 Ingersoll Rand Inc.

Ingersoll Rand Inc. - Overview
Ingersoll Rand Inc. - Business segments
Ingersoll Rand Inc. - Key offerings
Ingersoll Rand Inc. - Segment focus
SWOT

16.8 J de Jonge Group

J de Jonge Group - Overview
J de Jonge Group - Product / Service
J de Jonge Group - Key offerings
SWOT

16.9 Jiangsu Changlong Co. Ltd.

Jiangsu Changlong Co. Ltd. - Overview
Jiangsu Changlong Co. Ltd. - Product / Service
Jiangsu Changlong Co. Ltd. - Key offerings
SWOT

16.10 JRE Pvt. Ltd.

JRE Pvt. Ltd. - Overview
JRE Pvt. Ltd. - Product / Service
JRE Pvt. Ltd. - Key offerings
SWOT

16.11 KANON Loading Equipment BV

KANON Loading Equipment BV - Overview
KANON Loading Equipment BV - Product / Service
KANON Loading Equipment BV - Key offerings
SWOT

16.12 Lianyungang HUADE Co. Ltd.

Lianyungang HUADE Co. Ltd. - Overview
Lianyungang HUADE Co. Ltd. - Product / Service
Lianyungang HUADE Co. Ltd. - Key offerings
SWOT

16.13 Lloyds Steel Industries Ltd.

Lloyds Steel Industries Ltd. - Overview
Lloyds Steel Industries Ltd. - Product / Service
Lloyds Steel Industries Ltd. - Key offerings
SWOT

16.14 OPW Engineered Systems

OPW Engineered Systems - Overview
OPW Engineered Systems - Product / Service
OPW Engineered Systems - Key offerings
SWOT

16.15 TB Global Technologies Ltd.

TB Global Technologies Ltd. - Overview
TB Global Technologies Ltd. - Product / Service
TB Global Technologies Ltd. - Key offerings
SWOT

16.16 TechnipFMC plc

TechnipFMC plc - Overview
TechnipFMC plc - Business segments
TechnipFMC plc - Key news
TechnipFMC plc - Key offerings
TechnipFMC plc - Segment focus
SWOT

16.17 WLT liquid and gas BV

WLT liquid and gas BV - Overview
WLT liquid and gas BV - Product / Service
WLT liquid and gas BV - Key offerings
SWOT

16.18 Woodfield Systems

Woodfield Systems - Overview
Woodfield Systems - Product / Service
Woodfield Systems - Key offerings
SWOT

17. Appendix

17.1 Scope of the report

Market definition
Objectives
Notes and caveats

17.2 Inclusions and exclusions checklist

Inclusions checklist
Exclusions checklist

17.3 Currency conversion rates for US$

17.4 Research methodology

17.5 Data procurement

Information sources

17.6 Data validation

17.7 Validation techniques employed for market sizing

17.8 Data synthesis

17.9 360 degree market analysis

17.10 List of abbreviations

Research Methodology

Technavio presents a detailed picture of the market by way of study, synthesis, and summation of data from multiple sources. The analysts have presented the various facets of the market with a particular focus on identifying the key industry influencers. The data thus presented is comprehensive, reliable, and the result of extensive research, both primary and secondary.

INFORMATION SOURCES

Primary sources

  • Manufacturers and suppliers
  • Channel partners
  • Industry experts
  • Strategic decision makers

Secondary sources

  • Industry journals and periodicals
  • Government data
  • Financial reports of key industry players
  • Historical data
  • Press releases

DATA ANALYSIS

Data Synthesis

  • Collation of data
  • Estimation of key figures
  • Analysis of derived insights

Data Validation

  • Triangulation with data models
  • Reference against proprietary databases
  • Corroboration with industry experts

REPORT WRITING

Qualitative

  • Market drivers
  • Market challenges
  • Market trends
  • Five forces analysis

Quantitative

  • Market size and forecast
  • Market segmentation
  • Geographical insights
  • Competitive landscape

Interested in this report?

Get your sample now to see our research methodology and insights!

Download Now

Frequently Asked Questions

Marine Loading Arms market growth will increase by USD 86187.4 thousand thousand during 2026-2030.

The Marine Loading Arms market is expected to grow at a CAGR of 4.1% during 2026-2030.

Marine Loading Arms market is segmented by Application (Crude oil, LG, IG) Type (Manual marine loading arms, Hydraulic marine loading arms) Method (Top loading, Bottom Loading) Material (Carbon steel, Stainless steel, Aluminum, Others)

Baretti, Carbis Loadtec Group, Flotech Performance Systems, Ingersoll Rand Inc., J de Jonge Group, Jiangsu Changlong Co. Ltd., JRE Pvt. Ltd., KANON Loading Equipment BV, Lianyungang HUADE Co. Ltd., Lloyds Steel Industries Ltd., OGCF Engineering M Sdn Bhd., OPW Engineered Systems, Safe Harbor Access Systems, SVT APAC Pte. Ltd., TB Global Technologies Ltd., TechnipFMC plc, WLT liquid and gas BV, Woodfield Systems are a few of the key vendors in the Marine Loading Arms market.

APAC will register the highest growth rate of 36.9% among the other regions. Therefore, the Marine Loading Arms market in APAC is expected to garner significant business opportunities for the vendors during the forecast period.

China, India, Japan, South Korea, Australia, Indonesia, US, Canada, Mexico, Germany, The Netherlands, Norway, France, Italy, Spain, Saudi Arabia, UAE, South Africa, Egypt, Turkey, Brazil, Argentina, Chile

  • New oil and gas exploration policies is the driving factor this market.

The Marine Loading Arms market vendors should focus on grabbing business opportunities from the Application segment as it accounted for the largest market share in the base year.
RIA - Research AI Assistant
Ask RIA