Long Duration Energy Storage (LDES) Market Analysis, Size, and Forecast 2026-2030: North America (US, Canada, and Mexico), APAC (China, India, and Japan), Europe (Germany, UK, and France), Middle East and Africa (Saudi Arabia, UAE, and South Africa), South America (Brazil, Argentina, and Colombia), and Rest of World (ROW)

Long Duration Energy Storage (LDES) Market Analysis, Size, and Forecast 2026-2030:
North America (US, Canada, and Mexico), APAC (China, India, and Japan), Europe (Germany, UK, and France), Middle East and Africa (Saudi Arabia, UAE, and South Africa), South America (Brazil, Argentina, and Colombia), and Rest of World (ROW)

Published: May 2026 304 Pages SKU: IRTNTR81378

Market Overview at a Glance

$3.70 B
Market Opportunity
11.6%
CAGR 2025 - 2030
34.9%
APAC Growth
$1.82 B
Mechanical storage segment 2024

Long Duration Energy Storage (Ldes) Market Size and Growth Forecast 2026-2030

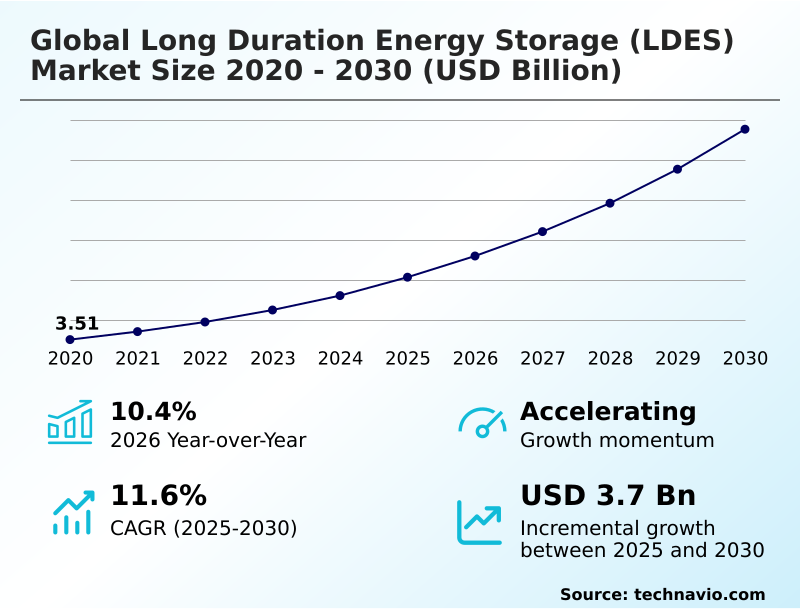
The Long Duration Energy Storage (Ldes) Market size was valued at USD 5.07 billion in 2025 growing at a CAGR of 11.6% during the forecast period 2026-2030.

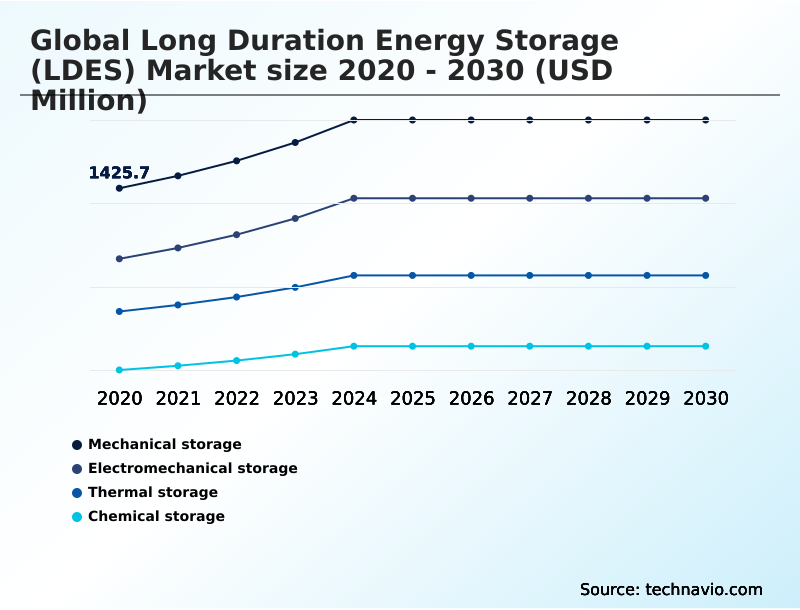
APAC accounts for 34.9% of incremental growth during the forecast period. The Mechanical storage segment by Technology was valued at USD 1.82 billion in 2024, while the Up to 50 MW segment holds the largest revenue share by Capacity.

The market is projected to grow by USD 5.26 billion from 2020 to 2030, with USD 3.70 billion of the growth expected during the forecast period of 2025 to 2030.

Get Key Insights on Market Forecast (PDF) Request Free Sample

Long Duration Energy Storage (Ldes) Market Overview

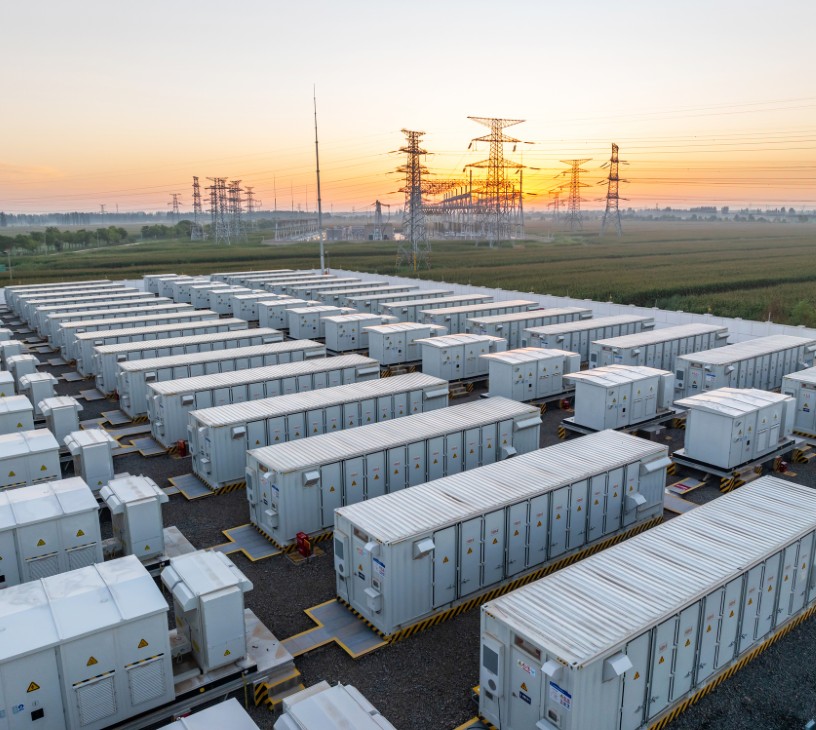
The long duration energy storage (LDES) market is fundamentally reshaping power grids by enabling deep renewable energy integration. With year-over-year growth accelerating beyond 10%, driven significantly by the APAC region's contribution of over 34% to incremental growth, the focus is on technologies that provide extended dispatchable power. These systems are crucial for curtailment mitigation and ensuring grid stability as intermittent solar and wind sources proliferate. For instance, a large-scale industrial manufacturing hub with extensive on-site solar generation can deploy a multi-hour thermal energy storage unit. This allows the facility to absorb all its solar output, even when production lines are idle, and discharge the stored thermal energy for process heat after sunset. This strategy of energy shifting not only maximizes the use of clean energy but also insulates the facility from volatile evening peak electricity prices, often reducing peak-hour grid reliance by over 50%. This capability makes long duration storage a cornerstone of industrial decarbonization and energy resilience, moving beyond simple backup power to active grid management.

Drivers, Trends, and Challenges in the Long Duration Energy Storage (Ldes) Market

The viability of long duration energy storage for grid services is increasingly underwritten by supportive regulatory frameworks, such as the Investment Tax Credits for standalone storage under the US Inflation Reduction Act of 2022. This policy directly improves the economic case when conducting a cost comparison of flow batteries vs lithium-ion for multi-hour applications.

Boardroom decisions on capital expenditure now weigh the levelized cost of storage and supply chain stability, pushing utilities to explore alternatives. For example, a decommissioned coal plant can be repurposed for thermal energy storage vs chemical storage, leveraging existing grid interconnections to cut development time by more than half compared to a greenfield project.

This synergy is a key factor in evaluating vanadium redox flow battery market applications against the technical hurdles of compressed air energy storage efficiency. Ultimately, the choice between mechanical vs chemical energy storage and the debate over iron flow battery vs zinc battery chemistries will be decided by project-specific requirements for discharge duration and round-trip efficiency.

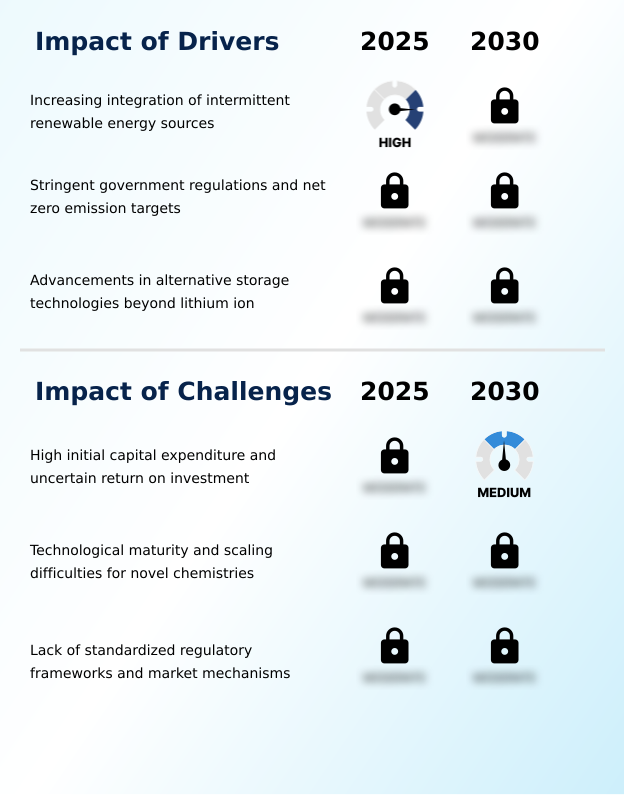
Primary Growth Driver: The increasing integration of intermittent renewable energy sources serves as a key driver for the market's growth.

The primary market driver is the urgent need to integrate massive volumes of intermittent renewables while maintaining grid stability.

As solar and wind penetration increases, grid operators face significant challenges in managing the mismatch between generation and demand, leading to costly curtailment.

Long-duration energy storage provides the essential capability for energy shifting, absorbing surplus power during periods of high generation and discharging it for many hours to serve peak demand.

This function transforms variable renewable sources into a reliable form of baseload power.

With APAC's renewable capacity growing at over 13% annually, the demand for technologies that can provide multi-day storage to ensure a continuous power supply is accelerating, making long-duration storage a foundational component of decarbonized energy networks.

Emerging Market Trend: The emergence of novel financing structures and Energy-as-a-Service frameworks is a notable market trend. These models are pivotal in overcoming high initial capital costs for deploying large-scale systems.

Key market trends revolve around the adoption of sophisticated commercial models and digital optimization to improve the bankability of long-duration assets. The rise of Energy as a Service (EaaS) frameworks and specialized Power Purchase Agreements (PPAs) allows industrial consumers to access dispatchable power without massive upfront capital expenditure.

Concurrently, the integration of AI for energy storage optimization is becoming standard practice for maximizing returns through complex energy arbitrage strategies. These platforms analyze real-time market signals to automate the charge and discharge cycles of assets like vanadium redox flow batteries, significantly improving the levelized cost of storage (LCOS).

This digital transformation is enabling assets to provide multiple grid services simultaneously, from seasonal energy storage to rapid frequency regulation, thus creating more resilient and profitable energy systems.

Key Industry Challenge: High initial capital expenditure coupled with uncertain returns on investment presents a key challenge affecting the industry's growth.

A significant challenge remains the high initial capital expenditure and perceived technology risk associated with novel long-duration storage systems. While the long-term value is clear, the technological maturity of several chemistries, such as liquid metal battery and iron-air battery technology, is still being proven at utility scale. This creates uncertainty for investors and complicates project financing.

Furthermore, the lack of standardized market mechanisms to compensate storage assets for all the grid services they provide, including resilience and capacity firming, hinders revenue stacking.

Issues with the round trip efficiency and cycle life of some thermal energy storage and power-to-gas technology pathways also present technical hurdles that must be overcome to achieve widespread commercial viability and compete with incumbent solutions.

Explore Full Market Dynamics Analysis Request Free Sample

Long Duration Energy Storage (Ldes) Market Segmentation

The long duration energy storage (ldes) industry research report provides comprehensive data including region-wise segment analysis, with forecasts and analysis for the period 2026-2030, as well as historical data from 2020-2024 for the following segments.

Market Segment by Technology
  • Mechanical storage
  • Electromechanical storage
  • Thermal storage
  • Chemical storage
Market Segment by Capacity
  • Up to 50 MW
  • 50 to 100 MW
  • More than 100 MW
Market Segment by Application
  • Renewable energy integration
  • Grid management
  • Power backup
  • Off grid and microgrid systems
Market Segment by Geography
North America
US, Canada, Mexico
APAC
China, India, Japan, Australia, South Korea, Indonesia
Europe
Germany, UK, France, Italy, Spain, The Netherlands
Middle East and Africa
Saudi Arabia, UAE, South Africa, Israel, Turkey
South America
Brazil, Argentina, Colombia

Technology Segment Analysis

The mechanical storage segment is estimated to witness significant growth during the forecast period.

The market for long duration energy storage (LDES) relies heavily on mechanical storage, a segment encompassing established technologies like pumped hydro storage and emerging solutions like gravity energy storage.

This category, which includes compressed air energy storage (caes), is foundational for providing grid stability through system inertia. Mechanical energy storage solutions, including kinetic energy storage, are critical for utility-scale applications, addressing the need for multi-hour discharge capabilities.

Accounting for a significant portion of the installed capacity, this segment's growth is driven by the demand for large-scale, cost-effective storage, despite geographical constraints for technologies like pumped hydro.

Its role is pivotal in managing grid frequency and supporting the integration of variable renewable sources, representing a cornerstone of modern energy infrastructure.

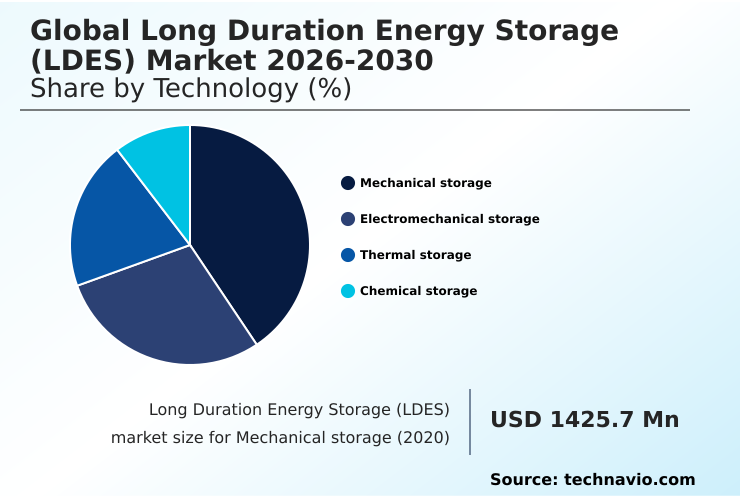
The Mechanical storage segment was valued at USD 1.82 billion in 2024 and showed a gradual increase during the forecast period.

Long Duration Energy Storage (Ldes) Market by Region: APAC Leads with 34.9% Growth Share

APAC is estimated to contribute 34.9% to the growth of the global market during the forecast period.

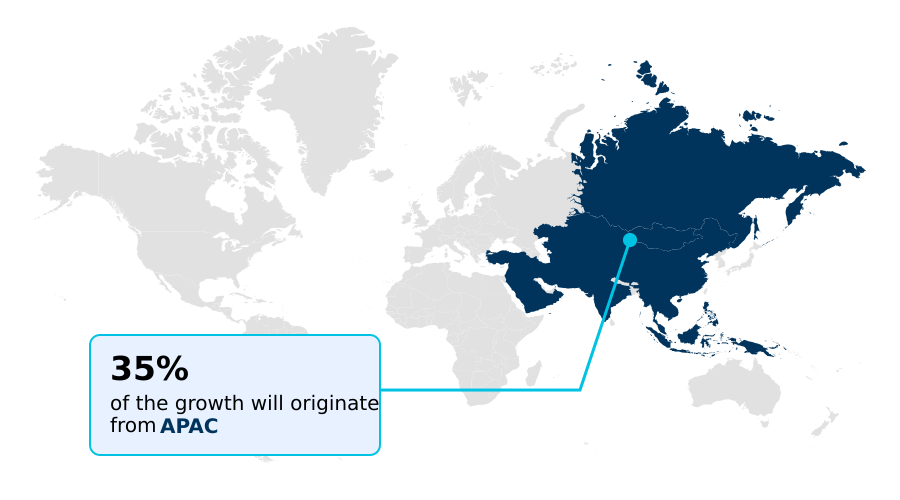
The geographic landscape of the long duration energy storage market is led by APAC, which accounts for approximately 35% of the incremental growth, driven by massive renewable energy integration mandates in China and India.

North America follows, contributing around 31%, where federal incentives under policies like the Inflation Reduction Act of 2022 are accelerating deployments of utility-scale battery storage and other long-duration technologies to enhance grid resilience.

In this region, developers are focused on providing critical grid balancing services. Europe, representing nearly 22% of the opportunity, is prioritizing energy independence through significant investments in offshore wind integration and green hydrogen infrastructure.

The focus here is on developing robust energy storage reserves to manage seasonal variations in wind and solar output, ensuring a stable power supply across the continent.

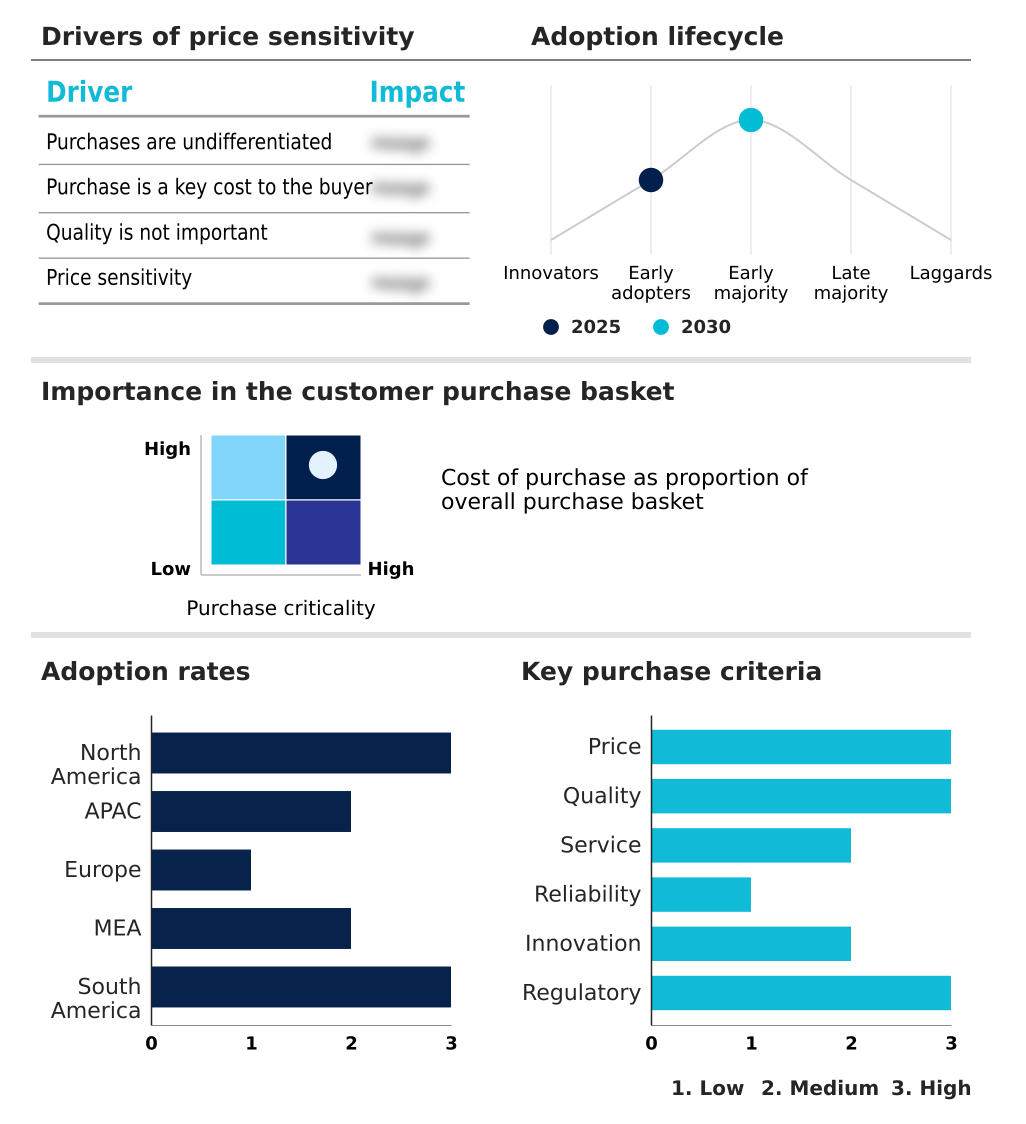
Customer Landscape Analysis for the Long Duration Energy Storage (Ldes) Market

The long duration energy storage (ldes) market forecasting report includes the adoption lifecycle of the market, covering from the innovator’s stage to the laggard’s stage. It focuses on adoption rates in different regions based on penetration. Furthermore, the long duration energy storage (ldes) market report also includes key purchase criteria and drivers of price sensitivity to help companies evaluate and develop their market growth analysis strategies.

Competitive Landscape of the Long Duration Energy Storage (Ldes) Market

Companies are implementing various strategies, such as strategic alliances, partnerships, mergers and acquisitions, geographical expansion, and product/service launches, to enhance their presence in the long duration energy storage (ldes) market industry.

Ambri Incorporated - Offerings include gravity-based kinetic energy storage systems that utilize automated block-lifting for long-duration grid-scale applications.

The industry research and growth report includes detailed analyses of the competitive landscape of the market and information about key companies, including:

  • Ambri Incorporated
  • Antora Energy
  • CellCube Energy Storage GmbH
  • CMBlu Energy AG
  • ENERGY DOME S.p.A
  • Energy Vault Holdings Inc.
  • ESS Tech Inc.
  • e-Zinc Inc
  • Form Energy
  • Highview Enterprises Ltd
  • Hydrostor
  • Invinity Energy Systems plc
  • Kraftblock GmbH
  • Malta Inc
  • Stryten Energy LLC
  • Sumitomo Electric Industries
  • VRB Energy

Qualitative and quantitative analysis of companies has been conducted to help clients understand the wider business environment as well as the strengths and weaknesses of key industry players. Data is qualitatively analyzed to categorize companies as pure play, category-focused, industry-focused, and diversified; it is quantitatively analyzed to categorize companies as dominant, leading, strong, tentative, and weak.

Recent Developments in the Long Duration Energy Storage (Ldes) Market

  • In May, 2025, the New York State Energy Research and Development Authority (NYSERDA) announced funding of over $5 million to support innovative long-duration energy storage technologies designed to enhance grid reliability and the integration of renewable energy.
  • In May, 2025, Zeo Energy Corp. announced a proposed acquisition of Heliogen, Inc., a move expected to create synergies between concentrated solar power generation and long-duration thermal energy storage technologies.
  • In April, 2025, the UK's Office of Gas and Electricity Markets (Ofgem) launched the first application window for its Long Duration Energy Storage cap and floor revenue support scheme, aiming to de-risk investments in large-scale storage infrastructure.
  • In February, 2025, Google entered a definitive agreement with Xcel Energy to deploy a 300 MW/30 GWh iron-air battery system in Pine Island, Minnesota, to support carbon-free power for its data center operations.

Research Analyst Overview: Long Duration Energy Storage (Ldes) Market

The strategic shift from short-duration ancillary services to multi-hour bulk energy shifting defines the current long duration energy storage (LDES) market. With APAC poised to capture nearly 35% of incremental growth, the global imperative is to find scalable solutions beyond lithium-ion.

Boardroom decisions now center on balancing the high upfront CAPEX of novel chemistries against the long-term levelized cost of storage (LCOS). For example, a utility must weigh the proven operational history of pumped hydro storage against the potential for lower LCOS and siting flexibility offered by emerging iron-air battery technology.

This decision is complicated by evolving grid codes, like those from regional ISOs, which now mandate specific fast frequency response capabilities, influencing the technology qualification criteria.

The technical debate over round trip efficiency versus total cycle life is paramount as stakeholders assess different platforms, from vanadium redox flow batteries to mechanical gravity systems, to deliver reliable, grid-scale energy storage and ensure a firm power capacity.

Dive into Technavio’s robust research methodology, blending expert interviews, extensive data synthesis, and validated models for unparalleled Long Duration Energy Storage (Ldes) Market insights. See full methodology.

Request Free Sample

Market Scope
Page number 304
Base year 2025
Historic period 2020-2024
Forecast period 2026-2030
Growth momentum & CAGR Accelerate at a CAGR of 11.6%
Market growth 2026-2030 USD 3702.4 million
Market structure Fragmented
YoY growth 2025-2026(%) 10.4%
Key countries US, Canada, Mexico, China, India, Japan, Australia, South Korea, Indonesia, Germany, UK, France, Italy, Spain, The Netherlands, Saudi Arabia, UAE, South Africa, Israel, Turkey, Brazil, Argentina and Colombia
Competitive landscape Leading Companies, Market Positioning of Companies, Competitive Strategies, and Industry Risks

Long Duration Energy Storage (Ldes) Market: Key Questions Answered in This Report

  • What is the expected growth of the Long Duration Energy Storage (Ldes) Market between 2026 and 2030?

    • The Long Duration Energy Storage (Ldes) Market is expected to grow by USD 3.70 billion during 2026-2030, registering a CAGR of 11.6%. Year-over-year growth in 2026 is estimated at 10.4%%. This acceleration is shaped by increasing integration of intermittent renewable energy sources, which is intensifying demand across multiple end-use verticals covered in the report.

  • What segmentation does the market report cover?

    • The report is segmented by Technology (Mechanical storage, Electromechanical storage, Thermal storage, and Chemical storage), Capacity (Up to 50 MW, 50 to 100 MW, and More than 100 MW), Application (Renewable energy integration, Grid management, Power backup, and Off grid and microgrid systems) and Geography (North America, APAC, Europe, Middle East and Africa, South America). Among these, the Mechanical storage segment is estimated to witness significant growth during the forecast period, driven by rising adoption across key application areas. Each segment includes detailed qualitative and quantitative analysis, along with historical data from 2020-2024 and forecasts through 2030 with year-over-year growth rates.

  • Which regions are analyzed in the report?

    • The report covers North America, APAC, Europe, Middle East and Africa and South America. APAC is estimated to contribute 34.9% to market growth during the forecast period. Country-level analysis includes US, Canada, Mexico, China, India, Japan, Australia, South Korea, Indonesia, Germany, UK, France, Italy, Spain, The Netherlands, Saudi Arabia, UAE, South Africa, Israel, Turkey, Brazil, Argentina and Colombia, with dedicated market size tables and year-over-year growth for each.

  • What are the key growth drivers and market challenges?

    • The primary driver is increasing integration of intermittent renewable energy sources, which is accelerating investment and industry demand. The main challenge is high initial capital expenditure and uncertain return on investment, creating operational barriers for key market participants. The report quantifies the impact of each driver and challenge across 2026 and 2030 with comparative analysis.

  • Who are the major players in the Long Duration Energy Storage (Ldes) Market?

    • Key vendors include Ambri Incorporated, Antora Energy, CellCube Energy Storage GmbH, CMBlu Energy AG, ENERGY DOME S.p.A, Energy Vault Holdings Inc., ESS Tech Inc., e-Zinc Inc, Form Energy, Highview Enterprises Ltd, Hydrostor, Invinity Energy Systems plc, Kraftblock GmbH, Malta Inc, Stryten Energy LLC, Sumitomo Electric Industries and VRB Energy. The report provides qualitative and quantitative analysis categorizing companies as dominant, leading, strong, tentative, and weak based on their market positioning. Company profiles include business segment analysis, SWOT assessment, key offerings, and recent strategic developments.

Long Duration Energy Storage (Ldes) Market Research Insights

Market dynamics are increasingly shaped by the need for enhanced grid resilience, forcing utilities to look beyond short-duration batteries. Under reliability standards set by bodies like the North American Electric Reliability Corporation (NERC), operators must ensure resource adequacy, a key driver for seasonal energy storage solutions.

For example, the 'More than 100 MW' capacity segment is expanding at a faster rate than smaller-scale deployments as utilities seek to replace retiring fossil-fuel baseload plants. AI for energy storage optimization allows asset owners to maximize revenue through sophisticated energy arbitrage strategies, bidding into multiple ancillary service markets simultaneously.

This digital layer, combined with hardware like power-to-gas technology, is critical for managing the intermittency that defines modern power systems and ensuring a stable supply.

We can help! Our analysts can customize this long duration energy storage (ldes) market research report to meet your requirements.

Get in touch

1. Executive Summary

1.1 Market overview

Executive Summary - Chart on Market Overview
Executive Summary - Data Table on Market Overview
Executive Summary - Chart on Global Market Characteristics
Executive Summary - Chart on Market by Geography
Executive Summary - Chart on Market Segmentation by Technology
Executive Summary - Chart on Market Segmentation by Capacity
Executive Summary - Chart on Market Segmentation by Application
Executive Summary - Chart on Incremental Growth
Executive Summary - Data Table on Incremental Growth
Executive Summary - Chart on Company Market Positioning

2. Technavio Analysis

2.1 Analysis of price sensitivity, lifecycle, customer purchase basket, adoption rates, and purchase criteria

2.2 Criticality of inputs and Factors of differentiation

Chart on Overview on criticality of inputs and factors of differentiation

2.3 Factors of disruption

Chart on Overview on factors of disruption

2.4 Impact of drivers and challenges

Chart on Impact of drivers and challenges in 2025 and 2030

3. Market Landscape

3.1 Market ecosystem

Chart on Parent Market
Data Table on - Parent Market

3.2 Market characteristics

Chart on Market characteristics analysis

3.3 Value chain analysis

Chart on Value chain analysis

4. Market Sizing

4.1 Market definition

Data Table on Offerings of companies included in the market definition

4.2 Market segment analysis

Market segments

4.3 Market size 2025

4.4 Market outlook: Forecast for 2025-2030

Chart on Global - Market size and forecast 2025-2030 ($ million)
Data Table on Global - Market size and forecast 2025-2030 ($ million)
Chart on Global Market: Year-over-year growth 2025-2030 (%)
Data Table on Global Market: Year-over-year growth 2025-2030 (%)

5. Historic Market Size

5.1 Global Long Duration Energy Storage (LDES) Market 2020 - 2024

Historic Market Size - Data Table on Global Long Duration Energy Storage (LDES) Market 2020 - 2024 ($ million)

5.2 Technology segment analysis 2020 - 2024

Historic Market Size - Technology Segment 2020 - 2024 ($ million)

5.3 Capacity segment analysis 2020 - 2024

Historic Market Size - Capacity Segment 2020 - 2024 ($ million)

5.4 Application segment analysis 2020 - 2024

Historic Market Size - Application Segment 2020 - 2024 ($ million)

5.5 Geography segment analysis 2020 - 2024

Historic Market Size - Geography Segment 2020 - 2024 ($ million)

5.6 Country segment analysis 2020 - 2024

Historic Market Size - Country Segment 2020 - 2024 ($ million)

6. Qualitative Analysis

6.1 Impact of AI on Global Long Duration Energy Storage (LDES) Market

6.2 Impact of Geopolitical Conflicts on Global Long Duration Energy Storage (LDES) Market

7. Five Forces Analysis

7.1 Five forces summary

Five forces analysis - Comparison between 2025 and 2030

7.2 Bargaining power of buyers

Bargaining power of buyers - Impact of key factors 2025 and 2030

7.3 Bargaining power of suppliers

Bargaining power of suppliers - Impact of key factors in 2025 and 2030

7.4 Threat of new entrants

Threat of new entrants - Impact of key factors in 2025 and 2030

7.5 Threat of substitutes

Threat of substitutes - Impact of key factors in 2025 and 2030

7.6 Threat of rivalry

Threat of rivalry - Impact of key factors in 2025 and 2030

7.7 Market condition

Chart on Market condition - Five forces 2025 and 2030

8. Market Segmentation by Technology

8.1 Market segments

Chart on Technology - Market share 2025-2030 (%)
Data Table on Technology - Market share 2025-2030 (%)

8.2 Comparison by Technology

Chart on Comparison by Technology
Data Table on Comparison by Technology

8.3 Mechanical storage - Market size and forecast 2025-2030

Chart on Mechanical storage - Market size and forecast 2025-2030 ($ million)
Data Table on Mechanical storage - Market size and forecast 2025-2030 ($ million)
Chart on Mechanical storage - Year-over-year growth 2025-2030 (%)
Data Table on Mechanical storage - Year-over-year growth 2025-2030 (%)

8.4 Electromechanical storage - Market size and forecast 2025-2030

Chart on Electromechanical storage - Market size and forecast 2025-2030 ($ million)
Data Table on Electromechanical storage - Market size and forecast 2025-2030 ($ million)
Chart on Electromechanical storage - Year-over-year growth 2025-2030 (%)
Data Table on Electromechanical storage - Year-over-year growth 2025-2030 (%)

8.5 Thermal storage - Market size and forecast 2025-2030

Chart on Thermal storage - Market size and forecast 2025-2030 ($ million)
Data Table on Thermal storage - Market size and forecast 2025-2030 ($ million)
Chart on Thermal storage - Year-over-year growth 2025-2030 (%)
Data Table on Thermal storage - Year-over-year growth 2025-2030 (%)

8.6 Chemical storage - Market size and forecast 2025-2030

Chart on Chemical storage - Market size and forecast 2025-2030 ($ million)
Data Table on Chemical storage - Market size and forecast 2025-2030 ($ million)
Chart on Chemical storage - Year-over-year growth 2025-2030 (%)
Data Table on Chemical storage - Year-over-year growth 2025-2030 (%)

8.7 Market opportunity by Technology

Market opportunity by Technology ($ million)
Data Table on Market opportunity by Technology ($ million)

9. Market Segmentation by Capacity

9.1 Market segments

Chart on Capacity - Market share 2025-2030 (%)
Data Table on Capacity - Market share 2025-2030 (%)

9.2 Comparison by Capacity

Chart on Comparison by Capacity
Data Table on Comparison by Capacity

9.3 Up to 50 MW - Market size and forecast 2025-2030

Chart on Up to 50 MW - Market size and forecast 2025-2030 ($ million)
Data Table on Up to 50 MW - Market size and forecast 2025-2030 ($ million)
Chart on Up to 50 MW - Year-over-year growth 2025-2030 (%)
Data Table on Up to 50 MW - Year-over-year growth 2025-2030 (%)

9.4 50 to 100 MW - Market size and forecast 2025-2030

Chart on 50 to 100 MW - Market size and forecast 2025-2030 ($ million)
Data Table on 50 to 100 MW - Market size and forecast 2025-2030 ($ million)
Chart on 50 to 100 MW - Year-over-year growth 2025-2030 (%)
Data Table on 50 to 100 MW - Year-over-year growth 2025-2030 (%)

9.5 More than 100 MW - Market size and forecast 2025-2030

Chart on More than 100 MW - Market size and forecast 2025-2030 ($ million)
Data Table on More than 100 MW - Market size and forecast 2025-2030 ($ million)
Chart on More than 100 MW - Year-over-year growth 2025-2030 (%)
Data Table on More than 100 MW - Year-over-year growth 2025-2030 (%)

9.6 Market opportunity by Capacity

Market opportunity by Capacity ($ million)
Data Table on Market opportunity by Capacity ($ million)

10. Market Segmentation by Application

10.1 Market segments

Chart on Application - Market share 2025-2030 (%)
Data Table on Application - Market share 2025-2030 (%)

10.2 Comparison by Application

Chart on Comparison by Application
Data Table on Comparison by Application

10.3 Renewable energy integration - Market size and forecast 2025-2030

Chart on Renewable energy integration - Market size and forecast 2025-2030 ($ million)
Data Table on Renewable energy integration - Market size and forecast 2025-2030 ($ million)
Chart on Renewable energy integration - Year-over-year growth 2025-2030 (%)
Data Table on Renewable energy integration - Year-over-year growth 2025-2030 (%)

10.4 Grid management - Market size and forecast 2025-2030

Chart on Grid management - Market size and forecast 2025-2030 ($ million)
Data Table on Grid management - Market size and forecast 2025-2030 ($ million)
Chart on Grid management - Year-over-year growth 2025-2030 (%)
Data Table on Grid management - Year-over-year growth 2025-2030 (%)

10.5 Power backup - Market size and forecast 2025-2030

Chart on Power backup - Market size and forecast 2025-2030 ($ million)
Data Table on Power backup - Market size and forecast 2025-2030 ($ million)
Chart on Power backup - Year-over-year growth 2025-2030 (%)
Data Table on Power backup - Year-over-year growth 2025-2030 (%)

10.6 Off grid and microgrid systems - Market size and forecast 2025-2030

Chart on Off grid and microgrid systems - Market size and forecast 2025-2030 ($ million)
Data Table on Off grid and microgrid systems - Market size and forecast 2025-2030 ($ million)
Chart on Off grid and microgrid systems - Year-over-year growth 2025-2030 (%)
Data Table on Off grid and microgrid systems - Year-over-year growth 2025-2030 (%)

10.7 Market opportunity by Application

Market opportunity by Application ($ million)
Data Table on Market opportunity by Application ($ million)

11. Customer Landscape

11.1 Customer landscape overview

Analysis of price sensitivity, lifecycle, customer purchase basket, adoption rates, and purchase criteria

12. Geographic Landscape

12.1 Geographic segmentation

Chart on Market share by geography 2025-2030 (%)
Data Table on Market share by geography 2025-2030 (%)

12.2 Geographic comparison

Chart on Geographic comparison
Data Table on Geographic comparison

12.3 North America - Market size and forecast 2025-2030

Chart on North America - Market size and forecast 2025-2030 ($ million)
Data Table on North America - Market size and forecast 2025-2030 ($ million)
Chart on North America - Year-over-year growth 2025-2030 (%)
Data Table on North America - Year-over-year growth 2025-2030 (%)
Chart on Regional Comparison - North America
Data Table on Regional Comparison - North America

12.3.1 US - Market size and forecast 2025-2030

Chart on US - Market size and forecast 2025-2030 ($ million)
Data Table on US - Market size and forecast 2025-2030 ($ million)
Chart on US - Year-over-year growth 2025-2030 (%)
Data Table on US - Year-over-year growth 2025-2030 (%)

12.3.2 Canada - Market size and forecast 2025-2030

Chart on Canada - Market size and forecast 2025-2030 ($ million)
Data Table on Canada - Market size and forecast 2025-2030 ($ million)
Chart on Canada - Year-over-year growth 2025-2030 (%)
Data Table on Canada - Year-over-year growth 2025-2030 (%)

12.3.3 Mexico - Market size and forecast 2025-2030

Chart on Mexico - Market size and forecast 2025-2030 ($ million)
Data Table on Mexico - Market size and forecast 2025-2030 ($ million)
Chart on Mexico - Year-over-year growth 2025-2030 (%)
Data Table on Mexico - Year-over-year growth 2025-2030 (%)

12.4 APAC - Market size and forecast 2025-2030

Chart on APAC - Market size and forecast 2025-2030 ($ million)
Data Table on APAC - Market size and forecast 2025-2030 ($ million)
Chart on APAC - Year-over-year growth 2025-2030 (%)
Data Table on APAC - Year-over-year growth 2025-2030 (%)
Chart on Regional Comparison - APAC
Data Table on Regional Comparison - APAC

12.4.1 China - Market size and forecast 2025-2030

Chart on China - Market size and forecast 2025-2030 ($ million)
Data Table on China - Market size and forecast 2025-2030 ($ million)
Chart on China - Year-over-year growth 2025-2030 (%)
Data Table on China - Year-over-year growth 2025-2030 (%)

12.4.2 India - Market size and forecast 2025-2030

Chart on India - Market size and forecast 2025-2030 ($ million)
Data Table on India - Market size and forecast 2025-2030 ($ million)
Chart on India - Year-over-year growth 2025-2030 (%)
Data Table on India - Year-over-year growth 2025-2030 (%)

12.4.3 Japan - Market size and forecast 2025-2030

Chart on Japan - Market size and forecast 2025-2030 ($ million)
Data Table on Japan - Market size and forecast 2025-2030 ($ million)
Chart on Japan - Year-over-year growth 2025-2030 (%)
Data Table on Japan - Year-over-year growth 2025-2030 (%)

12.4.4 Australia - Market size and forecast 2025-2030

Chart on Australia - Market size and forecast 2025-2030 ($ million)
Data Table on Australia - Market size and forecast 2025-2030 ($ million)
Chart on Australia - Year-over-year growth 2025-2030 (%)
Data Table on Australia - Year-over-year growth 2025-2030 (%)

12.4.5 South Korea - Market size and forecast 2025-2030

Chart on South Korea - Market size and forecast 2025-2030 ($ million)
Data Table on South Korea - Market size and forecast 2025-2030 ($ million)
Chart on South Korea - Year-over-year growth 2025-2030 (%)
Data Table on South Korea - Year-over-year growth 2025-2030 (%)

12.4.6 Indonesia - Market size and forecast 2025-2030

Chart on Indonesia - Market size and forecast 2025-2030 ($ million)
Data Table on Indonesia - Market size and forecast 2025-2030 ($ million)
Chart on Indonesia - Year-over-year growth 2025-2030 (%)
Data Table on Indonesia - Year-over-year growth 2025-2030 (%)

12.5 Europe - Market size and forecast 2025-2030

Chart on Europe - Market size and forecast 2025-2030 ($ million)
Data Table on Europe - Market size and forecast 2025-2030 ($ million)
Chart on Europe - Year-over-year growth 2025-2030 (%)
Data Table on Europe - Year-over-year growth 2025-2030 (%)
Chart on Regional Comparison - Europe
Data Table on Regional Comparison - Europe

12.5.1 Germany - Market size and forecast 2025-2030

Chart on Germany - Market size and forecast 2025-2030 ($ million)
Data Table on Germany - Market size and forecast 2025-2030 ($ million)
Chart on Germany - Year-over-year growth 2025-2030 (%)
Data Table on Germany - Year-over-year growth 2025-2030 (%)

12.5.2 UK - Market size and forecast 2025-2030

Chart on UK - Market size and forecast 2025-2030 ($ million)
Data Table on UK - Market size and forecast 2025-2030 ($ million)
Chart on UK - Year-over-year growth 2025-2030 (%)
Data Table on UK - Year-over-year growth 2025-2030 (%)

12.5.3 France - Market size and forecast 2025-2030

Chart on France - Market size and forecast 2025-2030 ($ million)
Data Table on France - Market size and forecast 2025-2030 ($ million)
Chart on France - Year-over-year growth 2025-2030 (%)
Data Table on France - Year-over-year growth 2025-2030 (%)

12.5.4 Italy - Market size and forecast 2025-2030

Chart on Italy - Market size and forecast 2025-2030 ($ million)
Data Table on Italy - Market size and forecast 2025-2030 ($ million)
Chart on Italy - Year-over-year growth 2025-2030 (%)
Data Table on Italy - Year-over-year growth 2025-2030 (%)

12.5.5 Spain - Market size and forecast 2025-2030

Chart on Spain - Market size and forecast 2025-2030 ($ million)
Data Table on Spain - Market size and forecast 2025-2030 ($ million)
Chart on Spain - Year-over-year growth 2025-2030 (%)
Data Table on Spain - Year-over-year growth 2025-2030 (%)

12.5.6 The Netherlands - Market size and forecast 2025-2030

Chart on The Netherlands - Market size and forecast 2025-2030 ($ million)
Data Table on The Netherlands - Market size and forecast 2025-2030 ($ million)
Chart on The Netherlands - Year-over-year growth 2025-2030 (%)
Data Table on The Netherlands - Year-over-year growth 2025-2030 (%)

12.6 Middle East and Africa - Market size and forecast 2025-2030

Chart on Middle East and Africa - Market size and forecast 2025-2030 ($ million)
Data Table on Middle East and Africa - Market size and forecast 2025-2030 ($ million)
Chart on Middle East and Africa - Year-over-year growth 2025-2030 (%)
Data Table on Middle East and Africa - Year-over-year growth 2025-2030 (%)
Chart on Regional Comparison - Middle East and Africa
Data Table on Regional Comparison - Middle East and Africa

12.6.1 Saudi Arabia - Market size and forecast 2025-2030

Chart on Saudi Arabia - Market size and forecast 2025-2030 ($ million)
Data Table on Saudi Arabia - Market size and forecast 2025-2030 ($ million)
Chart on Saudi Arabia - Year-over-year growth 2025-2030 (%)
Data Table on Saudi Arabia - Year-over-year growth 2025-2030 (%)

12.6.2 UAE - Market size and forecast 2025-2030

Chart on UAE - Market size and forecast 2025-2030 ($ million)
Data Table on UAE - Market size and forecast 2025-2030 ($ million)
Chart on UAE - Year-over-year growth 2025-2030 (%)
Data Table on UAE - Year-over-year growth 2025-2030 (%)

12.6.3 South Africa - Market size and forecast 2025-2030

Chart on South Africa - Market size and forecast 2025-2030 ($ million)
Data Table on South Africa - Market size and forecast 2025-2030 ($ million)
Chart on South Africa - Year-over-year growth 2025-2030 (%)
Data Table on South Africa - Year-over-year growth 2025-2030 (%)

12.6.4 Israel - Market size and forecast 2025-2030

Chart on Israel - Market size and forecast 2025-2030 ($ million)
Data Table on Israel - Market size and forecast 2025-2030 ($ million)
Chart on Israel - Year-over-year growth 2025-2030 (%)
Data Table on Israel - Year-over-year growth 2025-2030 (%)

12.6.5 Turkey - Market size and forecast 2025-2030

Chart on Turkey - Market size and forecast 2025-2030 ($ million)
Data Table on Turkey - Market size and forecast 2025-2030 ($ million)
Chart on Turkey - Year-over-year growth 2025-2030 (%)
Data Table on Turkey - Year-over-year growth 2025-2030 (%)

12.7 South America - Market size and forecast 2025-2030

Chart on South America - Market size and forecast 2025-2030 ($ million)
Data Table on South America - Market size and forecast 2025-2030 ($ million)
Chart on South America - Year-over-year growth 2025-2030 (%)
Data Table on South America - Year-over-year growth 2025-2030 (%)
Chart on Regional Comparison - South America
Data Table on Regional Comparison - South America

12.7.1 Brazil - Market size and forecast 2025-2030

Chart on Brazil - Market size and forecast 2025-2030 ($ million)
Data Table on Brazil - Market size and forecast 2025-2030 ($ million)
Chart on Brazil - Year-over-year growth 2025-2030 (%)
Data Table on Brazil - Year-over-year growth 2025-2030 (%)

12.7.2 Argentina - Market size and forecast 2025-2030

Chart on Argentina - Market size and forecast 2025-2030 ($ million)
Data Table on Argentina - Market size and forecast 2025-2030 ($ million)
Chart on Argentina - Year-over-year growth 2025-2030 (%)
Data Table on Argentina - Year-over-year growth 2025-2030 (%)

12.7.3 Colombia - Market size and forecast 2025-2030

Chart on Colombia - Market size and forecast 2025-2030 ($ million)
Data Table on Colombia - Market size and forecast 2025-2030 ($ million)
Chart on Colombia - Year-over-year growth 2025-2030 (%)
Data Table on Colombia - Year-over-year growth 2025-2030 (%)

12.8 Market opportunity by geography

Market opportunity by geography ($ million)
Data Tables on Market opportunity by geography ($ million)

13. Drivers, Challenges, and Opportunity

13.1 Market drivers

Increasing integration of intermittent renewable energy sources
Stringent government regulations and net zero emission targets
Advancements in alternative storage technologies beyond lithium ion

13.2 Market challenges

High initial capital expenditure and uncertain return on investment
Technological maturity and scaling difficulties for novel chemistries
Lack of standardized regulatory frameworks and market mechanisms

13.3 Impact of drivers and challenges

Impact of drivers and challenges in 2025 and 2030

13.4 Market opportunities

Emergence of novel financing structures and energy as a service frameworks
Proliferation of corporate power purchase agreements for continuous clean energy
Integration of AI and predictive analytics for asset optimization

14. Competitive Landscape

14.1 Overview

14.2

Overview on criticality of inputs and factors of differentiation

14.3 Landscape disruption

Overview on factors of disruption

14.4 Industry risks

Impact of key risks on business

15. Competitive Analysis

15.1 Companies profiled

Companies covered

15.2 Company ranking index

15.3 Market positioning of companies

Matrix on companies position and classification

15.4 Ambri Incorporated

Ambri Incorporated - Overview
Ambri Incorporated - Product / Service
Ambri Incorporated - Key offerings
SWOT

15.5 Antora Energy

Antora Energy - Overview
Antora Energy - Product / Service
Antora Energy - Key offerings
SWOT

15.6 CellCube Energy Storage GmbH

CellCube Energy Storage GmbH - Overview
CellCube Energy Storage GmbH - Product / Service
CellCube Energy Storage GmbH - Key offerings
SWOT

15.7 CMBlu Energy AG

CMBlu Energy AG - Overview
CMBlu Energy AG - Product / Service
CMBlu Energy AG - Key offerings
SWOT

15.8 ENERGY DOME S.p.A

ENERGY DOME S.p.A - Overview
ENERGY DOME S.p.A - Product / Service
ENERGY DOME S.p.A - Key offerings
SWOT

15.9 Energy Vault Holdings Inc.

Energy Vault Holdings Inc. - Overview
Energy Vault Holdings Inc. - Product / Service
Energy Vault Holdings Inc. - Key offerings
SWOT

15.10 ESS Tech Inc.

ESS Tech Inc. - Overview
ESS Tech Inc. - Product / Service
ESS Tech Inc. - Key offerings
SWOT

15.11 Form Energy

Form Energy - Overview
Form Energy - Product / Service
Form Energy - Key offerings
SWOT

15.12 Highview Enterprises Ltd

Highview Enterprises Ltd - Overview
Highview Enterprises Ltd - Product / Service
Highview Enterprises Ltd - Key offerings
SWOT

15.13 Hydrostor

Hydrostor - Overview
Hydrostor - Product / Service
Hydrostor - Key offerings
SWOT

15.14 Invinity Energy Systems plc

Invinity Energy Systems plc - Overview
Invinity Energy Systems plc - Product / Service
Invinity Energy Systems plc - Key offerings
SWOT

15.15 Malta Inc

Malta Inc - Overview
Malta Inc - Product / Service
Malta Inc - Key offerings
SWOT

15.16 Stryten Energy LLC

Stryten Energy LLC - Overview
Stryten Energy LLC - Product / Service
Stryten Energy LLC - Key offerings
SWOT

15.17 Sumitomo Electric Industries

Sumitomo Electric Industries - Overview
Sumitomo Electric Industries - Business segments
Sumitomo Electric Industries - Key news
Sumitomo Electric Industries - Key offerings
Sumitomo Electric Industries - Segment focus
SWOT

15.18 VRB Energy

VRB Energy - Overview
VRB Energy - Product / Service
VRB Energy - Key offerings
SWOT

16. Appendix

16.1 Scope of the report

Market definition
Objectives
Notes and caveats

16.2 Inclusions and exclusions checklist

Inclusions checklist
Exclusions checklist

16.3 Currency conversion rates for US$

16.4 Research methodology

16.5 Data procurement

Information sources

16.6 Data validation

16.7 Validation techniques employed for market sizing

16.8 Data synthesis

16.9 360 degree market analysis

16.10 List of abbreviations

Research Methodology

Technavio presents a detailed picture of the market by way of study, synthesis, and summation of data from multiple sources. The analysts have presented the various facets of the market with a particular focus on identifying the key industry influencers. The data thus presented is comprehensive, reliable, and the result of extensive research, both primary and secondary.

INFORMATION SOURCES

Primary sources

  • Manufacturers and suppliers
  • Channel partners
  • Industry experts
  • Strategic decision makers

Secondary sources

  • Industry journals and periodicals
  • Government data
  • Financial reports of key industry players
  • Historical data
  • Press releases

DATA ANALYSIS

Data Synthesis

  • Collation of data
  • Estimation of key figures
  • Analysis of derived insights

Data Validation

  • Triangulation with data models
  • Reference against proprietary databases
  • Corroboration with industry experts

REPORT WRITING

Qualitative

  • Market drivers
  • Market challenges
  • Market trends
  • Five forces analysis

Quantitative

  • Market size and forecast
  • Market segmentation
  • Geographical insights
  • Competitive landscape

Interested in this report?

Get your sample now to see our research methodology and insights!

Download Now

Frequently Asked Questions

Long Duration Energy Storage (Ldes) market growth will increase by USD 3702.4 million during 2026-2030.

The Long Duration Energy Storage (Ldes) market is expected to grow at a CAGR of 11.6% during 2026-2030.

Long Duration Energy Storage (Ldes) market is segmented by Technology (Mechanical storage, Electromechanical storage, Thermal storage, Chemical storage) Capacity (Up to 50 MW, 50 to 100 MW, More than 100 MW) Application (Renewable energy integration, Grid management, Power backup, Off grid and microgrid systems)

Ambri Incorporated, Antora Energy, CellCube Energy Storage GmbH, CMBlu Energy AG, ENERGY DOME S.p.A, Energy Vault Holdings Inc., ESS Tech Inc., e-Zinc Inc, Form Energy, Highview Enterprises Ltd, Hydrostor, Invinity Energy Systems plc, Kraftblock GmbH, Malta Inc, Stryten Energy LLC, Sumitomo Electric Industries, VRB Energy are a few of the key vendors in the Long Duration Energy Storage (Ldes) market.

APAC will register the highest growth rate of 34.9% among the other regions. Therefore, the Long Duration Energy Storage (Ldes) market in APAC is expected to garner significant business opportunities for the vendors during the forecast period.

US, Canada, Mexico, China, India, Japan, Australia, South Korea, Indonesia, Germany, UK, France, Italy, Spain, The Netherlands, Saudi Arabia, UAE, South Africa, Israel, Turkey, Brazil, Argentina, Colombia

  • Increasing integration of intermittent renewable energy sources is the driving factor this market.

The Long Duration Energy Storage (Ldes) market vendors should focus on grabbing business opportunities from the Technology segment as it accounted for the largest market share in the base year.
RIA - Research AI Assistant
Ask RIA