Less-than-truckload (LTL) Market Analysis, Size, and Forecast 2026-2030: APAC (China, India, and Japan), North America (US, Canada, and Mexico), Europe (Germany, France, and UK), Middle East and Africa (Saudi Arabia, UAE, and South Africa), South America (Brazil and Argentina), and Rest of World (ROW)

Less-than-truckload (LTL) Market Analysis, Size, and Forecast 2026-2030:
APAC (China, India, and Japan), North America (US, Canada, and Mexico), Europe (Germany, France, and UK), Middle East and Africa (Saudi Arabia, UAE, and South Africa), South America (Brazil and Argentina), and Rest of World (ROW)

Published: May 2026 295 Pages SKU: IRTNTR71750

Market Overview at a Glance

$119.56 B
Market Opportunity
6.9%
CAGR 2025 - 2030
57.9%
APAC Growth
$118.15 B
Long-haul carriers segment 2024

Less-than-truckload (LTL) Market Size 2026-2030

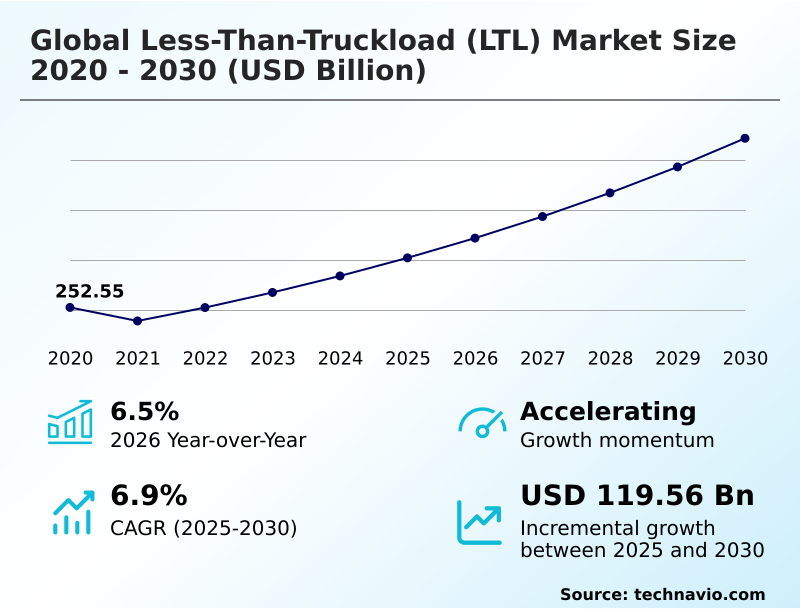
The less-than-truckload (ltl) market size is valued to increase by USD 119.56 billion, at a CAGR of 6.9% from 2025 to 2030. Proliferation of e-commerce and omnichannel distribution networks will drive the less-than-truckload (ltl) market.

Major Market Trends & Insights

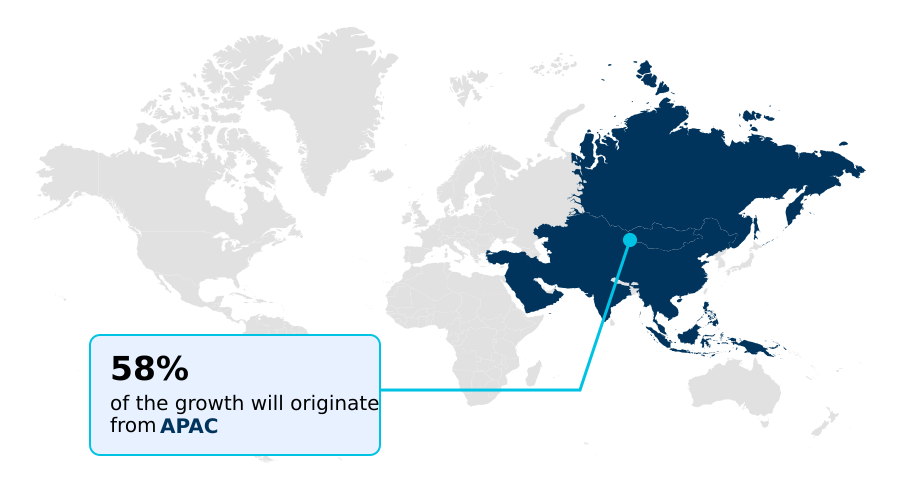
  • APAC dominated the market and accounted for a 57.9% growth during the forecast period.
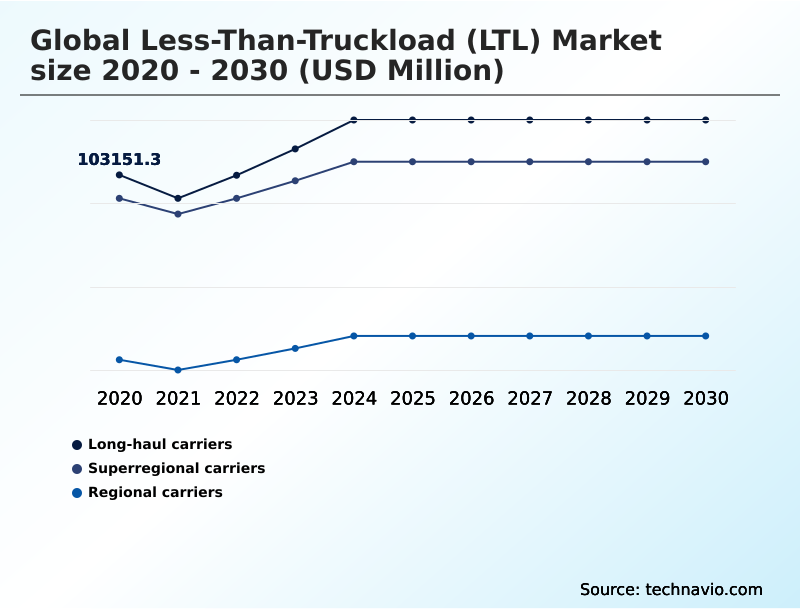
  • By Type - Long-haul carriers segment was valued at USD 118.15 billion in 2024
  • By Capacity - Light LTL volume segment accounted for the largest market revenue share in 2024

Market Size & Forecast

  • Market Opportunities: USD 169.16 billion
  • Market Future Opportunities: USD 119.56 billion
  • CAGR from 2025 to 2030 : 6.9%

Market Summary

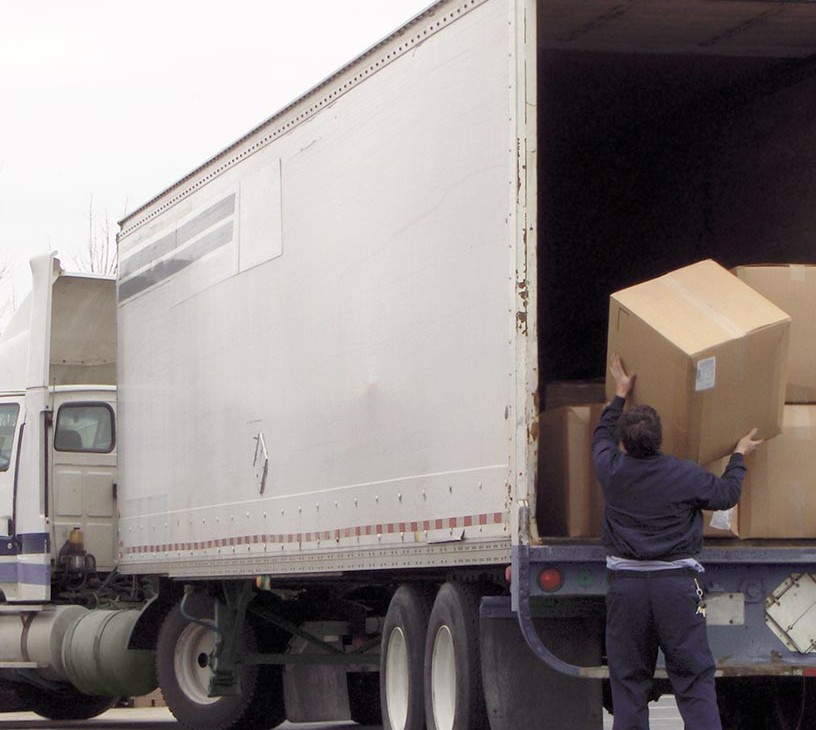
  • The less-than-truckload (LTL) market operates on a sophisticated hub and spoke network model, designed for consolidating shipments that do not require a full trailer. This structure is essential for businesses seeking cost-effective freight transportation.
  • Key market drivers include the rapid expansion of e-commerce, which fuels demand for smaller, more frequent deliveries, and the strategic shift toward nearshoring, which increases regional and cross-border LTL volumes. The adoption of AI for route optimization and density-based pricing is a major trend reshaping operational efficiency and logistics services.
  • For instance, a retail company can leverage the LTL network for just-in-time inventory replenishment across its stores, optimizing supply chain visibility without incurring the expense of underutilized full truckloads. However, the industry grapples with challenges such as severe labor shortages, volatile fuel costs, and escalating cybersecurity threats that can disrupt the entire supply chain.
  • The global less-than-truckload (LTL) market 2026-2030 continues to evolve through technological integration and strategic network expansions to meet these complex demands.

What will be the Size of the Less-than-truckload (LTL) Market during the forecast period?

Get Key Insights on Market Forecast (PDF) Get Free Sample

How is the Less-than-truckload (LTL) Market Segmented?

The less-than-truckload (ltl) industry research report provides comprehensive data (region-wise segment analysis), with forecasts and estimates in "USD million" for the period 2026-2030, as well as historical data from 2020-2024 for the following segments.

  • Type
    • Long-haul carriers
    • Superregional carriers
    • Regional carriers
  • Capacity
    • Light LTL volume
    • Heavy LTL volume
  • Mode of transportation
    • Domestic
    • International
  • Geography
    • APAC
      • China
      • India
      • Japan
    • North America
      • US
      • Canada
      • Mexico
    • Europe
      • Germany
      • France
      • UK
    • Middle East and Africa
      • Saudi Arabia
      • UAE
      • South Africa
    • South America
      • Brazil
      • Argentina
    • Rest of World (ROW)

By Type Insights

The long-haul carriers segment is estimated to witness significant growth during the forecast period.

Long-haul carriers in the global less-than-truckload (LTL) market 2026-2030 are central to transcontinental supply chains, specializing in freight transportation over extensive distances.

These operators leverage a robust hub and spoke network of break-bulk hubs to consolidate palletized freight and maximize trailer cube utilization during linehaul movements.

A structural shift is underway, with a greater focus on multimodal coordination, particularly intermodal rail, to offset volatile operational costs. This asset-based logistics segment is defined by its ability to offer day-definite service across vast geographies.

To enhance service reliability, major operators are insourcing a larger share of their linehaul miles, reporting a significant reduction in reliance on third-party capacity to maintain control over transit times and uphold freight classification standards for contract logistics.

Get Free Sample

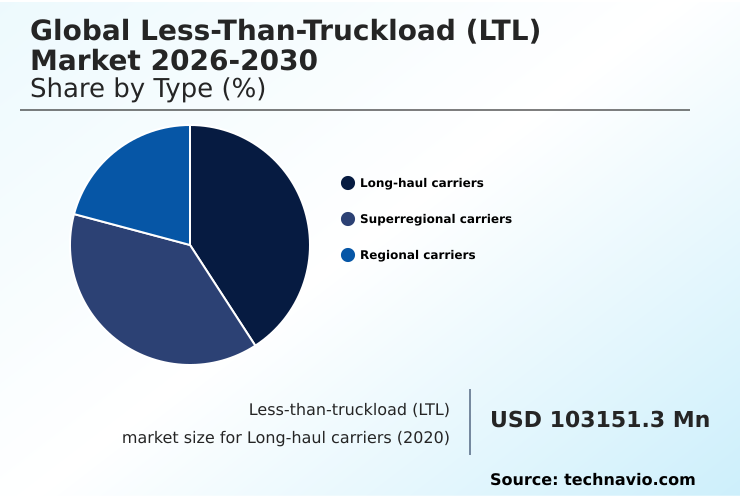
The Long-haul carriers segment was valued at USD 118.15 billion in 2024 and showed a gradual increase during the forecast period.

Get Free Sample

Regional Analysis

APAC is estimated to contribute 57.9% to the growth of the global market during the forecast period.Technavio’s analysts have elaborately explained the regional trends and drivers that shape the market during the forecast period.

See How Less-than-truckload (LTL) Market Demand is Rising in APAC Get Free Sample

The geographic landscape is being reshaped by the rise of regional trade blocs and the strategic pivot to nearshoring, increasing demand for sophisticated supply chain management.

In North America, network density and service excellence define the market, with investments focused on expanding cross-docking facility infrastructure to handle both light LTL volume and heavy LTL volume.

Conversely, the APAC region is the fastest-growing market, driven by digitalization and infrastructure investment. In this region, machine learning algorithms are improving fleet utilization by 15-20%.

The rapid adoption of technology in APAC, where electric heavy-duty trucks reached a 29% market share in China, is enabling carriers to build highly efficient hub and spoke networks that integrate intermodal rail and optimize warehousing and distribution for final mile delivery.

Market Dynamics

Our researchers analyzed the data with 2025 as the base year, along with the key drivers, trends, and challenges. A holistic analysis of drivers will help companies refine their marketing strategies to gain a competitive advantage.

  • Strategic decision-making in the less-than-truckload (LTL) sector is increasingly complex, requiring a thorough less-than-truckload vs full truckload cost analysis for each shipment. Businesses are focused on improving LTL freight transit times to meet consumer expectations, a challenge amplified by the persistent impact of the driver shortage on LTL services.
  • The AI impact on less-than-truckload routing is a critical factor, with advanced algorithms optimizing networks and mitigating delays. Adopting AI-driven platforms has been shown to reduce empty miles by over 10% compared to traditional methods, directly improving asset utilization. This is particularly relevant for autonomous trucking in LTL middle mile, which promises further efficiencies.
  • The shift toward density-based pricing impact on LTL shippers necessitates new packaging strategies to control costs, while the role of terminal density in LTL networks becomes paramount for managing capacity. Carriers are also enhancing cross-border LTL services for nearshoring to support resilient supply chains. Simultaneously, managing fuel surcharges in LTL shipping remains a constant operational hurdle.
  • Shippers now use sophisticated LTL carrier selection criteria for shippers that prioritize technology and service. These challenges in LTL final mile delivery and LTL capacity constraints and market impact are driving investments in real-time tracking technologies for LTL freight and automating LTL terminal and sorting operations.
  • Navigating LTL freight classification changes and embracing multimodal LTL solutions for cost savings are key to success. Finally, cybersecurity risks in LTL transportation management, LTL services for e-commerce fulfillment, optimizing trailer cube utilization in LTL and adopting sustainable practices in LTL logistics are becoming core competencies.

What are the key market drivers leading to the rise in the adoption of Less-than-truckload (LTL) Industry?

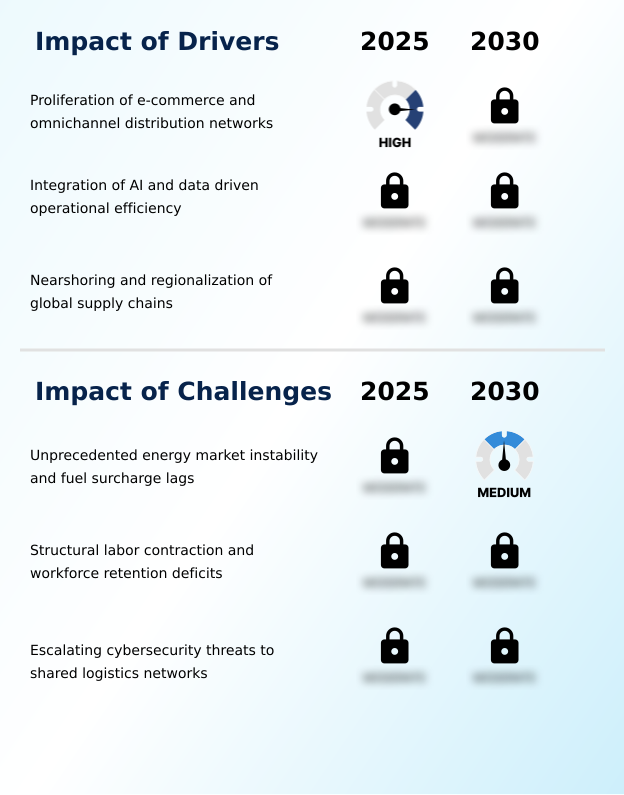
  • The proliferation of e-commerce and the expansion of omnichannel distribution networks are key drivers of market growth.

  • The expansion of e-commerce and omnichannel distribution is a primary market driver, compelling a shift toward smaller, more frequent less-than-truckload freight shipments to support just-in-time inventory strategies.
  • This surge in demand from e-commerce fulfillment has led to a 3% rise in daily shipment counts for some providers, even during periods of manufacturing slowdown.
  • To manage this complexity, carriers are adopting AI-powered route optimization and other advanced logistics services to improve trailer cube utilization and overall fleet utilization.
  • The adoption of machine learning algorithms in some regions has been shown to improve efficiency by 15-20%.
  • The widespread demand for complete supply chain visibility and real-time freight visibility is now a standard expectation for all stakeholders in the global less-than-truckload (LTL) market 2026-2030.

What are the market trends shaping the Less-than-truckload (LTL) Industry?

  • A key market trend is the accelerated commercialization of Level 4 autonomous technology. This is primarily focused on middle-mile logistics to enhance operational efficiency.

  • A transformative trend is the commercialization of autonomous trucking for middle-mile logistics, a development that promises to reduce delivery times by up to 40% and address chronic labor shortages. This shift is complemented by a move toward density-based pricing, enabled by the aggressive deployment of dimensional scanners and automated sorting technology in terminal operations.
  • Regional carriers are expanding physical terminal density to enhance network efficiency for freight consolidation and groupage services. This investment in both physical and digital infrastructure allows for improved handling of time-critical LTL shipments and is setting a new performance benchmark that even freight forwarders must adapt to.
  • Through better network design and handling protocols, leading operators have also driven damage claim ratios below 0.2%, improving service reliability.

What challenges does the Less-than-truckload (LTL) Industry face during its growth?

  • Unprecedented energy market instability, compounded by fuel surcharge lags, presents a key challenge to industry growth.

  • The sector faces significant headwinds from extreme energy price volatility, with diesel costs surging 50% in some instances, creating severe challenges in managing fuel surcharges. This is compounded by a structural driver shortage and persistent LTL capacity constraints, forcing some firms to increase compensation by 20% to retain staff for services like last mile delivery and cross-border LTL.
  • Furthermore, escalating cybersecurity risks threaten shared logistics platforms used for shipment tracking, freight brokerage, and even customs brokerage. A successful attack can paralyze inventory management systems, with the frequency of such incidents having surged by 61% in the logistics sector, and the average cost of a data breach exceeding $4 million.

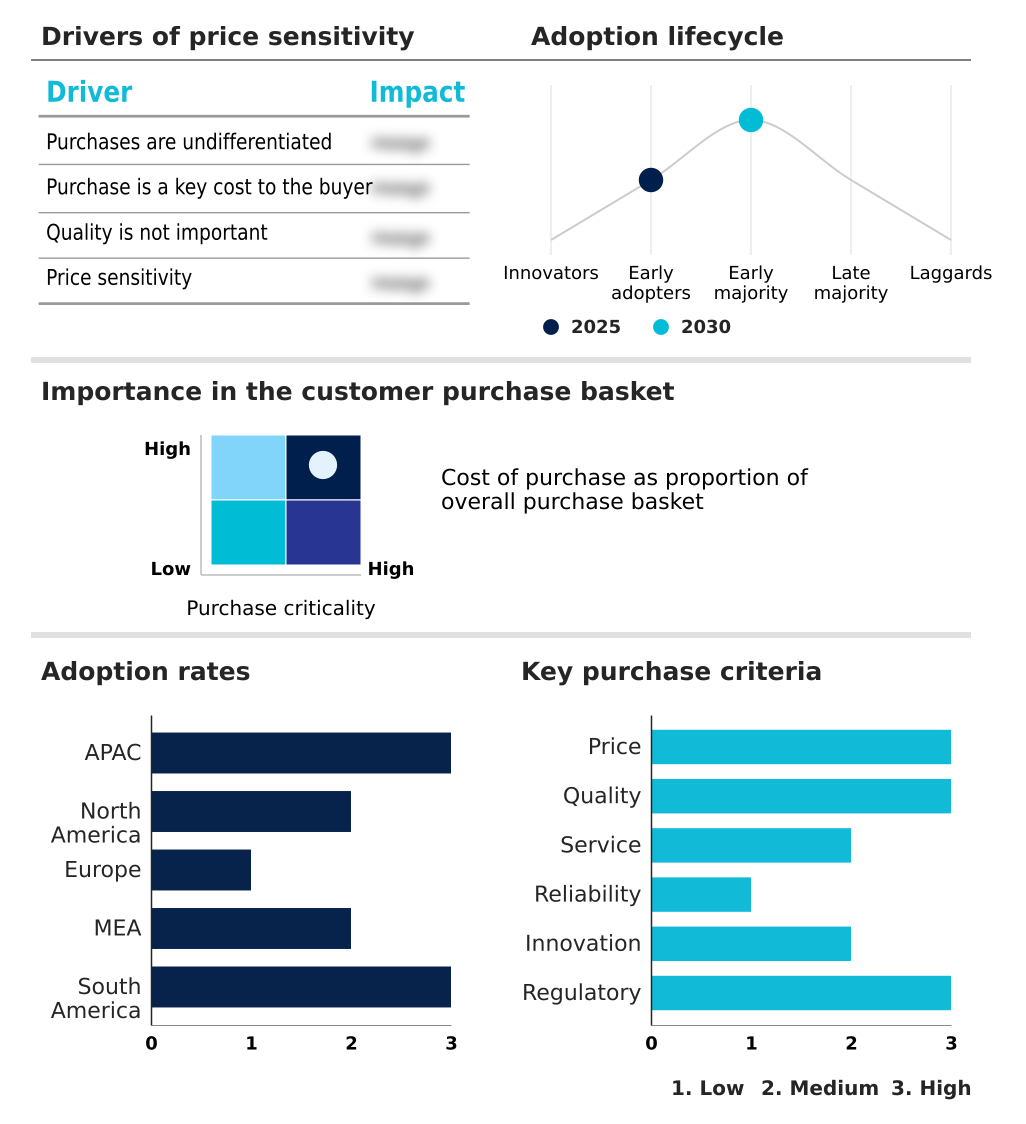
Exclusive Technavio Analysis on Customer Landscape

The less-than-truckload (ltl) market forecasting report includes the adoption lifecycle of the market, covering from the innovator’s stage to the laggard’s stage. It focuses on adoption rates in different regions based on penetration. Furthermore, the less-than-truckload (ltl) market report also includes key purchase criteria and drivers of price sensitivity to help companies evaluate and develop their market growth analysis strategies.

Customer Landscape of Less-than-truckload (LTL) Industry

Competitive Landscape

Companies are implementing various strategies, such as strategic alliances, less-than-truckload (ltl) market forecast, partnerships, mergers and acquisitions, geographical expansion, and product/service launches, to enhance their presence in the industry.

ArcBest Corp. - Specializes in providing time-critical and managed logistics less-than-truckload (LTL) solutions, focusing on asset-based freight services for complex supply chain needs.

The industry research and growth report includes detailed analyses of the competitive landscape of the market and information about key companies, including:

  • ArcBest Corp.
  • C H Robinson Worldwide Inc.
  • CEVA Logistics SA
  • CJ Logistics Corp.
  • Dachser SE
  • DB Schenker
  • DHL International GmbH
  • DSV AS
  • FedEx Corp.
  • Forward Air Corporation
  • GEODIS
  • Kuehne Nagel Management AG
  • Landstar System Inc.
  • Mainfreight Ltd.
  • Nippon Express Holdings Inc.
  • Old Dominion Freight Line
  • Rhenus SE and Co. KG
  • Schneider National Inc.
  • TFI International Inc.
  • XPO Inc.

Qualitative and quantitative analysis of companies has been conducted to help clients understand the wider business environment as well as the strengths and weaknesses of key industry players. Data is qualitatively analyzed to categorize companies as pure play, category-focused, industry-focused, and diversified; it is quantitatively analyzed to categorize companies as dominant, leading, strong, tentative, and weak.

Recent Development and News in Less-than-truckload (ltl) market

  • In March, 2025, FedEx Corp. detailed its independence strategy for its FedEx Freight division, targeting a 12% operating margin by focusing on high-value industrial and cross-border shipments.
  • In April, 2025, Saia Inc. expanded its network by opening a new 74-door terminal in York, Pennsylvania, to enhance one-day service capabilities in the Mid-Atlantic and Northeast corridors.
  • In May, 2025, Amazon expanded its logistics services, opening its automated freight, distribution, and parcel shipping network to external businesses, increasing competition in the supply chain sector.
  • In January, 2025, The National Motor Freight Traffic Association initiated a major classification overhaul, transitioning the industry toward a streamlined, density-based system to reduce disputes and modernize freight preparation.

Dive into Technavio’s robust research methodology, blending expert interviews, extensive data synthesis, and validated models for unparalleled Less-than-truckload (LTL) Market insights. See full methodology.

Market Scope
Page number 295
Base year 2025
Historic period 2020-2024
Forecast period 2026-2030
Growth momentum & CAGR Accelerate at a CAGR of 6.9%
Market growth 2026-2030 USD 119555.1 million
Market structure Fragmented
YoY growth 2025-2026(%) 6.5%
Key countries China, India, Japan, South Korea, Australia, Indonesia, US, Canada, Mexico, Germany, France, UK, Italy, Poland, The Netherlands, Saudi Arabia, UAE, South Africa, Turkey, Qatar, Brazil, Argentina and Chile
Competitive landscape Leading Companies, Market Positioning of Companies, Competitive Strategies, and Industry Risks

Request Free Sample

Research Analyst Overview

  • The less-than-truckload (LTL) market is undergoing a significant transformation driven by technological integration and shifting supply chain dynamics. The foundational hub and spoke network is being enhanced with advanced route optimization and automated sorting technology to manage the complexities of modern logistics services. This evolution is critical for handling the surge in less-than-truckload freight from e-commerce and regionalized manufacturing.
  • A key trend is the industry's move toward density-based pricing, supported by automated dimensional scanners that provide precise freight data. This shift forces a boardroom-level re-evaluation of packaging engineering and its impact on overall logistics costs, directly influencing product profitability and supply chain strategy. The implementation of AI-driven terminal operations has demonstrated the ability to improve throughput by over 30%.
  • As the market evolves, capabilities such as real-time shipment tracking, efficient customs brokerage for cross-border LTL, and sophisticated inventory management are becoming standard. This digital transformation is essential for optimizing trailer cube utilization and enhancing overall supply chain visibility.

What are the Key Data Covered in this Less-than-truckload (LTL) Market Research and Growth Report?

  • What is the expected growth of the Less-than-truckload (LTL) Market between 2026 and 2030?

    • USD 119.56 billion, at a CAGR of 6.9%

  • What segmentation does the market report cover?

    • The report is segmented by Type (Long-haul carriers, Superregional carriers, and Regional carriers), Capacity (Light LTL volume, and Heavy LTL volume), Mode of Transportation (Domestic, and International) and Geography (APAC, North America, Europe, Middle East and Africa, South America)

  • Which regions are analyzed in the report?

    • APAC, North America, Europe, Middle East and Africa and South America

  • What are the key growth drivers and market challenges?

    • Proliferation of e-commerce and omnichannel distribution networks, Unprecedented energy market instability and fuel surcharge lags

  • Who are the major players in the Less-than-truckload (LTL) Market?

    • ArcBest Corp., C H Robinson Worldwide Inc., CEVA Logistics SA, CJ Logistics Corp., Dachser SE, DB Schenker, DHL International GmbH, DSV AS, FedEx Corp., Forward Air Corporation, GEODIS, Kuehne Nagel Management AG, Landstar System Inc., Mainfreight Ltd., Nippon Express Holdings Inc., Old Dominion Freight Line, Rhenus SE and Co. KG, Schneider National Inc., TFI International Inc. and XPO Inc.

Market Research Insights

  • The less-than-truckload (LTL) market is characterized by disciplined pricing and a strategic pivot toward enhanced regional service offerings. Asset-based logistics providers are expanding their terminal density to support day-definite service commitments, a crucial factor as shippers prioritize reliability. The transition to density-based freight classification is compelling shippers to optimize packaging, impacting both light LTL volume and heavy LTL volume.
  • To manage rising costs from the persistent driver shortage, some carriers have increased compensation by up to 20%. Concurrently, leading operators have improved service quality, with damage claim ratios falling below 0.2%. This focus on efficiency and service is vital for managing time-critical LTL and expedited LTL shipments in a competitive environment where e-commerce fulfillment and just-in-time inventory models dominate.

We can help! Our analysts can customize this less-than-truckload (ltl) market research report to meet your requirements.

Get in touch

1. Executive Summary

1.1 Market overview

Executive Summary - Chart on Market Overview
Executive Summary - Data Table on Market Overview
Executive Summary - Chart on Global Market Characteristics
Executive Summary - Chart on Market by Geography
Executive Summary - Chart on Market Segmentation by Type
Executive Summary - Chart on Market Segmentation by Capacity
Executive Summary - Chart on Market Segmentation by Mode of Transportation
Executive Summary - Chart on Incremental Growth
Executive Summary - Data Table on Incremental Growth
Executive Summary - Chart on Company Market Positioning

2. Technavio Analysis

2.1 Analysis of price sensitivity, lifecycle, customer purchase basket, adoption rates, and purchase criteria

2.2 Criticality of inputs and Factors of differentiation

Chart on Overview on criticality of inputs and factors of differentiation

2.3 Factors of disruption

Chart on Overview on factors of disruption

2.4 Impact of drivers and challenges

Chart on Impact of drivers and challenges in 2025 and 2030

3. Market Landscape

3.1 Market ecosystem

Chart on Parent Market
Data Table on - Parent Market

3.2 Market characteristics

Chart on Market characteristics analysis

3.3 Value chain analysis

Chart on Value chain analysis

4. Market Sizing

4.1 Market definition

Data Table on Offerings of companies included in the market definition

4.2 Market segment analysis

Market segments

4.3 Market size 2025

4.4 Market outlook: Forecast for 2025-2030

Chart on Global - Market size and forecast 2025-2030 ($ million)
Data Table on Global - Market size and forecast 2025-2030 ($ million)
Chart on Global Market: Year-over-year growth 2025-2030 (%)
Data Table on Global Market: Year-over-year growth 2025-2030 (%)

5. Historic Market Size

5.1 Global Less-Than-Truckload (LTL) Market 2020 - 2024

Historic Market Size - Data Table on Global Less-Than-Truckload (LTL) Market 2020 - 2024 ($ million)

5.2 Type segment analysis 2020 - 2024

Historic Market Size - Type Segment 2020 - 2024 ($ million)

5.3 Capacity segment analysis 2020 - 2024

Historic Market Size - Capacity Segment 2020 - 2024 ($ million)

5.4 Mode of Transportation segment analysis 2020 - 2024

Historic Market Size - Mode of Transportation Segment 2020 - 2024 ($ million)

5.5 Geography segment analysis 2020 - 2024

Historic Market Size - Geography Segment 2020 - 2024 ($ million)

5.6 Country segment analysis 2020 - 2024

Historic Market Size - Country Segment 2020 - 2024 ($ million)

6. Qualitative Analysis

6.1 Impact of AI on global less-than-truckload (LTL) market

6.2 Impact of geopolitical conflict on global less-than-truckload (LTL) market

7. Five Forces Analysis

7.1 Five forces summary

Five forces analysis - Comparison between 2025 and 2030

7.2 Bargaining power of buyers

Bargaining power of buyers - Impact of key factors 2025 and 2030

7.3 Bargaining power of suppliers

Bargaining power of suppliers - Impact of key factors in 2025 and 2030

7.4 Threat of new entrants

Threat of new entrants - Impact of key factors in 2025 and 2030

7.5 Threat of substitutes

Threat of substitutes - Impact of key factors in 2025 and 2030

7.6 Threat of rivalry

Threat of rivalry - Impact of key factors in 2025 and 2030

7.7 Market condition

Chart on Market condition - Five forces 2025 and 2030

8. Market Segmentation by Type

8.1 Market segments

Chart on Type - Market share 2025-2030 (%)
Data Table on Type - Market share 2025-2030 (%)

8.2 Comparison by Type

Chart on Comparison by Type
Data Table on Comparison by Type

8.3 Long-haul carriers - Market size and forecast 2025-2030

Chart on Long-haul carriers - Market size and forecast 2025-2030 ($ million)
Data Table on Long-haul carriers - Market size and forecast 2025-2030 ($ million)
Chart on Long-haul carriers - Year-over-year growth 2025-2030 (%)
Data Table on Long-haul carriers - Year-over-year growth 2025-2030 (%)

8.4 Superregional carriers - Market size and forecast 2025-2030

Chart on Superregional carriers - Market size and forecast 2025-2030 ($ million)
Data Table on Superregional carriers - Market size and forecast 2025-2030 ($ million)
Chart on Superregional carriers - Year-over-year growth 2025-2030 (%)
Data Table on Superregional carriers - Year-over-year growth 2025-2030 (%)

8.5 Regional carriers - Market size and forecast 2025-2030

Chart on Regional carriers - Market size and forecast 2025-2030 ($ million)
Data Table on Regional carriers - Market size and forecast 2025-2030 ($ million)
Chart on Regional carriers - Year-over-year growth 2025-2030 (%)
Data Table on Regional carriers - Year-over-year growth 2025-2030 (%)

8.6 Market opportunity by Type

Market opportunity by Type ($ million)
Data Table on Market opportunity by Type ($ million)

9. Market Segmentation by Capacity

9.1 Market segments

Chart on Capacity - Market share 2025-2030 (%)
Data Table on Capacity - Market share 2025-2030 (%)

9.2 Comparison by Capacity

Chart on Comparison by Capacity
Data Table on Comparison by Capacity

9.3 Light LTL volume - Market size and forecast 2025-2030

Chart on Light LTL volume - Market size and forecast 2025-2030 ($ million)
Data Table on Light LTL volume - Market size and forecast 2025-2030 ($ million)
Chart on Light LTL volume - Year-over-year growth 2025-2030 (%)
Data Table on Light LTL volume - Year-over-year growth 2025-2030 (%)

9.4 Heavy LTL volume - Market size and forecast 2025-2030

Chart on Heavy LTL volume - Market size and forecast 2025-2030 ($ million)
Data Table on Heavy LTL volume - Market size and forecast 2025-2030 ($ million)
Chart on Heavy LTL volume - Year-over-year growth 2025-2030 (%)
Data Table on Heavy LTL volume - Year-over-year growth 2025-2030 (%)

9.5 Market opportunity by Capacity

Market opportunity by Capacity ($ million)
Data Table on Market opportunity by Capacity ($ million)

10. Market Segmentation by Mode of Transportation

10.1 Market segments

Chart on Mode of Transportation - Market share 2025-2030 (%)
Data Table on Mode of Transportation - Market share 2025-2030 (%)

10.2 Comparison by Mode of Transportation

Chart on Comparison by Mode of Transportation
Data Table on Comparison by Mode of Transportation

10.3 Domestic - Market size and forecast 2025-2030

Chart on Domestic - Market size and forecast 2025-2030 ($ million)
Data Table on Domestic - Market size and forecast 2025-2030 ($ million)
Chart on Domestic - Year-over-year growth 2025-2030 (%)
Data Table on Domestic - Year-over-year growth 2025-2030 (%)

10.4 International - Market size and forecast 2025-2030

Chart on International - Market size and forecast 2025-2030 ($ million)
Data Table on International - Market size and forecast 2025-2030 ($ million)
Chart on International - Year-over-year growth 2025-2030 (%)
Data Table on International - Year-over-year growth 2025-2030 (%)

10.5 Market opportunity by Mode of Transportation

Market opportunity by Mode of Transportation ($ million)
Data Table on Market opportunity by Mode of Transportation ($ million)

11. Customer Landscape

11.1 Customer landscape overview

Analysis of price sensitivity, lifecycle, customer purchase basket, adoption rates, and purchase criteria

12. Geographic Landscape

12.1 Geographic segmentation

Chart on Market share by geography 2025-2030 (%)
Data Table on Market share by geography 2025-2030 (%)

12.2 Geographic comparison

Chart on Geographic comparison
Data Table on Geographic comparison

12.3 APAC - Market size and forecast 2025-2030

Chart on APAC - Market size and forecast 2025-2030 ($ million)
Data Table on APAC - Market size and forecast 2025-2030 ($ million)
Chart on APAC - Year-over-year growth 2025-2030 (%)
Data Table on APAC - Year-over-year growth 2025-2030 (%)
Chart on Regional Comparison - APAC
Data Table on Regional Comparison - APAC

12.3.1 China - Market size and forecast 2025-2030

Chart on China - Market size and forecast 2025-2030 ($ million)
Data Table on China - Market size and forecast 2025-2030 ($ million)
Chart on China - Year-over-year growth 2025-2030 (%)
Data Table on China - Year-over-year growth 2025-2030 (%)

12.3.2 India - Market size and forecast 2025-2030

Chart on India - Market size and forecast 2025-2030 ($ million)
Data Table on India - Market size and forecast 2025-2030 ($ million)
Chart on India - Year-over-year growth 2025-2030 (%)
Data Table on India - Year-over-year growth 2025-2030 (%)

12.3.3 Japan - Market size and forecast 2025-2030

Chart on Japan - Market size and forecast 2025-2030 ($ million)
Data Table on Japan - Market size and forecast 2025-2030 ($ million)
Chart on Japan - Year-over-year growth 2025-2030 (%)
Data Table on Japan - Year-over-year growth 2025-2030 (%)

12.3.4 South Korea - Market size and forecast 2025-2030

Chart on South Korea - Market size and forecast 2025-2030 ($ million)
Data Table on South Korea - Market size and forecast 2025-2030 ($ million)
Chart on South Korea - Year-over-year growth 2025-2030 (%)
Data Table on South Korea - Year-over-year growth 2025-2030 (%)

12.3.5 Australia - Market size and forecast 2025-2030

Chart on Australia - Market size and forecast 2025-2030 ($ million)
Data Table on Australia - Market size and forecast 2025-2030 ($ million)
Chart on Australia - Year-over-year growth 2025-2030 (%)
Data Table on Australia - Year-over-year growth 2025-2030 (%)

12.3.6 Indonesia - Market size and forecast 2025-2030

Chart on Indonesia - Market size and forecast 2025-2030 ($ million)
Data Table on Indonesia - Market size and forecast 2025-2030 ($ million)
Chart on Indonesia - Year-over-year growth 2025-2030 (%)
Data Table on Indonesia - Year-over-year growth 2025-2030 (%)

12.4 North America - Market size and forecast 2025-2030

Chart on North America - Market size and forecast 2025-2030 ($ million)
Data Table on North America - Market size and forecast 2025-2030 ($ million)
Chart on North America - Year-over-year growth 2025-2030 (%)
Data Table on North America - Year-over-year growth 2025-2030 (%)
Chart on Regional Comparison - North America
Data Table on Regional Comparison - North America

12.4.1 US - Market size and forecast 2025-2030

Chart on US - Market size and forecast 2025-2030 ($ million)
Data Table on US - Market size and forecast 2025-2030 ($ million)
Chart on US - Year-over-year growth 2025-2030 (%)
Data Table on US - Year-over-year growth 2025-2030 (%)

12.4.2 Canada - Market size and forecast 2025-2030

Chart on Canada - Market size and forecast 2025-2030 ($ million)
Data Table on Canada - Market size and forecast 2025-2030 ($ million)
Chart on Canada - Year-over-year growth 2025-2030 (%)
Data Table on Canada - Year-over-year growth 2025-2030 (%)

12.4.3 Mexico - Market size and forecast 2025-2030

Chart on Mexico - Market size and forecast 2025-2030 ($ million)
Data Table on Mexico - Market size and forecast 2025-2030 ($ million)
Chart on Mexico - Year-over-year growth 2025-2030 (%)
Data Table on Mexico - Year-over-year growth 2025-2030 (%)

12.5 Europe - Market size and forecast 2025-2030

Chart on Europe - Market size and forecast 2025-2030 ($ million)
Data Table on Europe - Market size and forecast 2025-2030 ($ million)
Chart on Europe - Year-over-year growth 2025-2030 (%)
Data Table on Europe - Year-over-year growth 2025-2030 (%)
Chart on Regional Comparison - Europe
Data Table on Regional Comparison - Europe

12.5.1 Germany - Market size and forecast 2025-2030

Chart on Germany - Market size and forecast 2025-2030 ($ million)
Data Table on Germany - Market size and forecast 2025-2030 ($ million)
Chart on Germany - Year-over-year growth 2025-2030 (%)
Data Table on Germany - Year-over-year growth 2025-2030 (%)

12.5.2 France - Market size and forecast 2025-2030

Chart on France - Market size and forecast 2025-2030 ($ million)
Data Table on France - Market size and forecast 2025-2030 ($ million)
Chart on France - Year-over-year growth 2025-2030 (%)
Data Table on France - Year-over-year growth 2025-2030 (%)

12.5.3 UK - Market size and forecast 2025-2030

Chart on UK - Market size and forecast 2025-2030 ($ million)
Data Table on UK - Market size and forecast 2025-2030 ($ million)
Chart on UK - Year-over-year growth 2025-2030 (%)
Data Table on UK - Year-over-year growth 2025-2030 (%)

12.5.4 Italy - Market size and forecast 2025-2030

Chart on Italy - Market size and forecast 2025-2030 ($ million)
Data Table on Italy - Market size and forecast 2025-2030 ($ million)
Chart on Italy - Year-over-year growth 2025-2030 (%)
Data Table on Italy - Year-over-year growth 2025-2030 (%)

12.5.5 Poland - Market size and forecast 2025-2030

Chart on Poland - Market size and forecast 2025-2030 ($ million)
Data Table on Poland - Market size and forecast 2025-2030 ($ million)
Chart on Poland - Year-over-year growth 2025-2030 (%)
Data Table on Poland - Year-over-year growth 2025-2030 (%)

12.5.6 The Netherlands - Market size and forecast 2025-2030

Chart on The Netherlands - Market size and forecast 2025-2030 ($ million)
Data Table on The Netherlands - Market size and forecast 2025-2030 ($ million)
Chart on The Netherlands - Year-over-year growth 2025-2030 (%)
Data Table on The Netherlands - Year-over-year growth 2025-2030 (%)

12.6 Middle East and Africa - Market size and forecast 2025-2030

Chart on Middle East and Africa - Market size and forecast 2025-2030 ($ million)
Data Table on Middle East and Africa - Market size and forecast 2025-2030 ($ million)
Chart on Middle East and Africa - Year-over-year growth 2025-2030 (%)
Data Table on Middle East and Africa - Year-over-year growth 2025-2030 (%)
Chart on Regional Comparison - Middle East and Africa
Data Table on Regional Comparison - Middle East and Africa

12.6.1 Saudi Arabia - Market size and forecast 2025-2030

Chart on Saudi Arabia - Market size and forecast 2025-2030 ($ million)
Data Table on Saudi Arabia - Market size and forecast 2025-2030 ($ million)
Chart on Saudi Arabia - Year-over-year growth 2025-2030 (%)
Data Table on Saudi Arabia - Year-over-year growth 2025-2030 (%)

12.6.2 UAE - Market size and forecast 2025-2030

Chart on UAE - Market size and forecast 2025-2030 ($ million)
Data Table on UAE - Market size and forecast 2025-2030 ($ million)
Chart on UAE - Year-over-year growth 2025-2030 (%)
Data Table on UAE - Year-over-year growth 2025-2030 (%)

12.6.3 South Africa - Market size and forecast 2025-2030

Chart on South Africa - Market size and forecast 2025-2030 ($ million)
Data Table on South Africa - Market size and forecast 2025-2030 ($ million)
Chart on South Africa - Year-over-year growth 2025-2030 (%)
Data Table on South Africa - Year-over-year growth 2025-2030 (%)

12.6.4 Turkey - Market size and forecast 2025-2030

Chart on Turkey - Market size and forecast 2025-2030 ($ million)
Data Table on Turkey - Market size and forecast 2025-2030 ($ million)
Chart on Turkey - Year-over-year growth 2025-2030 (%)
Data Table on Turkey - Year-over-year growth 2025-2030 (%)

12.6.5 Qatar - Market size and forecast 2025-2030

Chart on Qatar - Market size and forecast 2025-2030 ($ million)
Data Table on Qatar - Market size and forecast 2025-2030 ($ million)
Chart on Qatar - Year-over-year growth 2025-2030 (%)
Data Table on Qatar - Year-over-year growth 2025-2030 (%)

12.7 South America - Market size and forecast 2025-2030

Chart on South America - Market size and forecast 2025-2030 ($ million)
Data Table on South America - Market size and forecast 2025-2030 ($ million)
Chart on South America - Year-over-year growth 2025-2030 (%)
Data Table on South America - Year-over-year growth 2025-2030 (%)
Chart on Regional Comparison - South America
Data Table on Regional Comparison - South America

12.7.1 Brazil - Market size and forecast 2025-2030

Chart on Brazil - Market size and forecast 2025-2030 ($ million)
Data Table on Brazil - Market size and forecast 2025-2030 ($ million)
Chart on Brazil - Year-over-year growth 2025-2030 (%)
Data Table on Brazil - Year-over-year growth 2025-2030 (%)

12.7.2 Argentina - Market size and forecast 2025-2030

Chart on Argentina - Market size and forecast 2025-2030 ($ million)
Data Table on Argentina - Market size and forecast 2025-2030 ($ million)
Chart on Argentina - Year-over-year growth 2025-2030 (%)
Data Table on Argentina - Year-over-year growth 2025-2030 (%)

12.7.3 Chile - Market size and forecast 2025-2030

Chart on Chile - Market size and forecast 2025-2030 ($ million)
Data Table on Chile - Market size and forecast 2025-2030 ($ million)
Chart on Chile - Year-over-year growth 2025-2030 (%)
Data Table on Chile - Year-over-year growth 2025-2030 (%)

12.8 Market opportunity by geography

Market opportunity by geography ($ million)
Data Tables on Market opportunity by geography ($ million)

13. Drivers, Challenges, and Opportunity

13.1 Market drivers

Proliferation of e-commerce and omnichannel distribution networks
Integration of AI and data driven operational efficiency
Nearshoring and regionalization of global supply chains

13.2 Market challenges

Unprecedented energy market instability and fuel surcharge lags
Structural labor contraction and workforce retention deficits
Escalating cybersecurity threats to shared logistics networks

13.3 Impact of drivers and challenges

Impact of drivers and challenges in 2025 and 2030

13.4 Market opportunities

Accelerated commercialization of level 4 autonomous middle mile logistics
Structural transition to density based pricing and dimensionalization
Aggressive expansion of terminal infrastructure and regional density

14. Competitive Landscape

14.1 Overview

14.2

Overview on criticality of inputs and factors of differentiation

14.3 Landscape disruption

Overview on factors of disruption

14.4 Industry risks

Impact of key risks on business

15. Competitive Analysis

15.1 Companies profiled

Companies covered

15.2 Company ranking index

15.3 Market positioning of companies

Matrix on companies position and classification

15.4 ArcBest Corp.

ArcBest Corp. - Overview
ArcBest Corp. - Business segments
ArcBest Corp. - Key offerings
ArcBest Corp. - Segment focus
SWOT

15.5 Dachser SE

Dachser SE - Overview
Dachser SE - Product / Service
Dachser SE - Key offerings
SWOT

15.6 DB Schenker

DB Schenker - Overview
DB Schenker - Product / Service
DB Schenker - Key offerings
SWOT

15.7 DHL International GmbH

DHL International GmbH - Overview
DHL International GmbH - Business segments
DHL International GmbH - Key news
DHL International GmbH - Key offerings
DHL International GmbH - Segment focus
SWOT

15.8 DSV AS

DSV AS - Overview
DSV AS - Business segments
DSV AS - Key offerings
DSV AS - Segment focus
SWOT

15.9 FedEx Corp.

FedEx Corp. - Overview
FedEx Corp. - Business segments
FedEx Corp. - Key offerings
FedEx Corp. - Segment focus
SWOT

15.10 Forward Air Corporation

Forward Air Corporation - Overview
Forward Air Corporation - Product / Service
Forward Air Corporation - Key offerings
SWOT

15.11 Kuehne Nagel Management AG

Kuehne Nagel Management AG - Overview
Kuehne Nagel Management AG - Business segments
Kuehne Nagel Management AG - Key offerings
Kuehne Nagel Management AG - Segment focus
SWOT

15.12 Mainfreight Ltd.

Mainfreight Ltd. - Overview
Mainfreight Ltd. - Product / Service
Mainfreight Ltd. - Key offerings
SWOT

15.13 Nippon Express Holdings Inc.

Nippon Express Holdings Inc. - Overview
Nippon Express Holdings Inc. - Business segments
Nippon Express Holdings Inc. - Key offerings
Nippon Express Holdings Inc. - Segment focus
SWOT

15.14 Old Dominion Freight Line

Old Dominion Freight Line - Overview
Old Dominion Freight Line - Product / Service
Old Dominion Freight Line - Key offerings
SWOT

15.15 Rhenus SE and Co. KG

Rhenus SE and Co. KG - Overview
Rhenus SE and Co. KG - Product / Service
Rhenus SE and Co. KG - Key offerings
SWOT

15.16 Schneider National Inc.

Schneider National Inc. - Overview
Schneider National Inc. - Business segments
Schneider National Inc. - Key offerings
Schneider National Inc. - Segment focus
SWOT

15.17 TFI International Inc.

TFI International Inc. - Overview
TFI International Inc. - Business segments
TFI International Inc. - Key offerings
TFI International Inc. - Segment focus
SWOT

15.18 XPO Inc.

XPO Inc. - Overview
XPO Inc. - Business segments
XPO Inc. - Key offerings
XPO Inc. - Segment focus
SWOT

16. Appendix

16.1 Scope of the report

Market definition
Objectives
Notes and caveats

16.2 Inclusions and exclusions checklist

Inclusions checklist
Exclusions checklist

16.3 Currency conversion rates for US$

16.4 Research methodology

16.5 Data procurement

Information sources

16.6 Data validation

16.7 Validation techniques employed for market sizing

16.8 Data synthesis

16.9 360 degree market analysis

16.10 List of abbreviations

Research Methodology

Technavio presents a detailed picture of the market by way of study, synthesis, and summation of data from multiple sources. The analysts have presented the various facets of the market with a particular focus on identifying the key industry influencers. The data thus presented is comprehensive, reliable, and the result of extensive research, both primary and secondary.

INFORMATION SOURCES

Primary sources

  • Manufacturers and suppliers
  • Channel partners
  • Industry experts
  • Strategic decision makers

Secondary sources

  • Industry journals and periodicals
  • Government data
  • Financial reports of key industry players
  • Historical data
  • Press releases

DATA ANALYSIS

Data Synthesis

  • Collation of data
  • Estimation of key figures
  • Analysis of derived insights

Data Validation

  • Triangulation with data models
  • Reference against proprietary databases
  • Corroboration with industry experts

REPORT WRITING

Qualitative

  • Market drivers
  • Market challenges
  • Market trends
  • Five forces analysis

Quantitative

  • Market size and forecast
  • Market segmentation
  • Geographical insights
  • Competitive landscape

Interested in this report?

Get your sample now to see our research methodology and insights!

Download Now

Frequently Asked Questions

Less-than-truckload (LTL) market growth will increase by USD 119555.1 million during 2026-2030.

The Less-than-truckload (LTL) market is expected to grow at a CAGR of 6.9% during 2026-2030.

Less-than-truckload (LTL) market is segmented by Type (Long-haul carriers, Superregional carriers, Regional carriers) Capacity (Light LTL volume, Heavy LTL volume) Mode of transportation (Domestic, International)

ArcBest Corp., C H Robinson Worldwide Inc., CEVA Logistics SA, CJ Logistics Corp., Dachser SE, DB Schenker, DHL International GmbH, DSV AS, FedEx Corp., Forward Air Corporation, GEODIS, Kuehne Nagel Management AG, Landstar System Inc., Mainfreight Ltd., Nippon Express Holdings Inc., Old Dominion Freight Line, Rhenus SE and Co. KG, Schneider National Inc., TFI International Inc., XPO Inc. are a few of the key vendors in the Less-than-truckload (LTL) market.

APAC will register the highest growth rate of 57.9% among the other regions. Therefore, the Less-than-truckload (LTL) market in APAC is expected to garner significant business opportunities for the vendors during the forecast period.

China, India, Japan, South Korea, Australia, Indonesia, US, Canada, Mexico, Germany, France, UK, Italy, Poland, The Netherlands, Saudi Arabia, UAE, South Africa, Turkey, Qatar, Brazil, Argentina, Chile

  • Proliferation of e-commerce and omnichannel distribution networks is the driving factor this market.

The Less-than-truckload (LTL) market vendors should focus on grabbing business opportunities from the Type segment as it accounted for the largest market share in the base year.
RIA - Research AI Assistant
Ask RIA