LBS In Healthcare Sector Market Analysis, Size, and Forecast 2026-2030: North America (US, Canada, and Mexico), Europe (Germany, UK, and France), APAC (China, India, and Japan), South America (Brazil, Argentina, and Chile), Middle East and Africa (Saudi Arabia, UAE, and South Africa), and Rest of World (ROW)

LBS In Healthcare Sector Market Analysis, Size, and Forecast 2026-2030:
North America (US, Canada, and Mexico), Europe (Germany, UK, and France), APAC (China, India, and Japan), South America (Brazil, Argentina, and Chile), Middle East and Africa (Saudi Arabia, UAE, and South Africa), and Rest of World (ROW)

Published: May 2026 294 Pages SKU: IRTNTR73423

Market Overview at a Glance

$298.47 B
Market Opportunity
71.7%
CAGR 2025 - 2030
41.7%
North America Growth
$12.47 B
Indoor LBS segment 2024

Lbs In Healthcare Sector Market Size and Growth Forecast 2026-2030

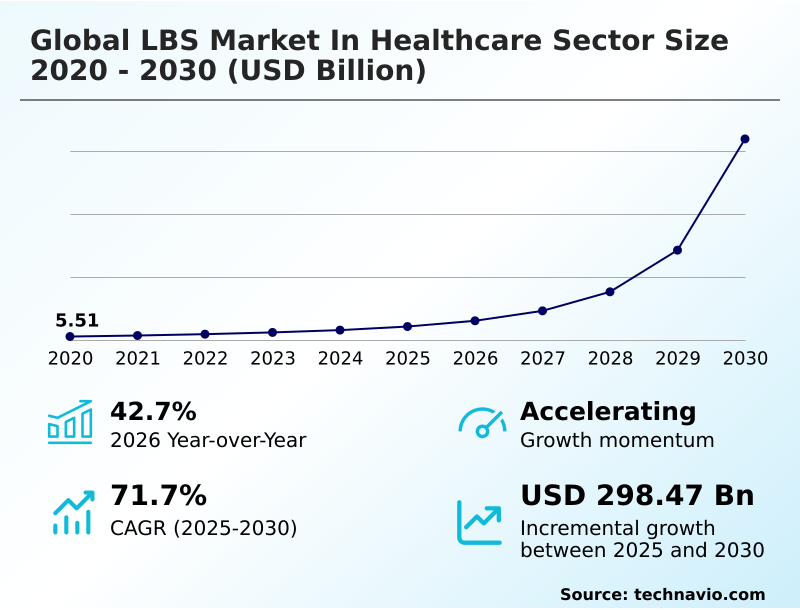
The Lbs In Healthcare Sector Market size was valued at USD 21.42 billion in 2025 growing at a CAGR of 71.7% during the forecast period 2026-2030.

North America accounts for 41.7% of incremental growth during the forecast period. The Indoor LBS segment by Type was valued at USD 12.47 billion in 2024, while the RTLS segment holds the largest revenue share by Technology.

The market is projected to grow by USD 314.39 billion from 2020 to 2030, with USD 298.47 billion of the growth expected during the forecast period of 2025 to 2030.

Get Key Insights on Market Forecast (PDF) Request Free Sample

Lbs In Healthcare Sector Market Overview

The LBS in healthcare sector market is defined by the transition from basic tracking to integrated location intelligence platforms, essential for operational transparency in complex medical environments. With North America poised to capture over 41% of the market's incremental growth, the demand is driven by the need to optimize resource utilization and enhance patient safety. Indoor positioning systems are crucial for managing mobile assets and streamlining workflows. For instance, a large urban medical center deploying a real-time location system (RTLS) with geofencing for patient safety in its memory care unit can achieve a significant reduction in wandering-related incidents, ensuring compliance with patient safety protocols under The Joint Commission. This integration of location-based automation with clinical workflow optimization tools like electronic health record (EHR) systems demonstrates the technology's value beyond simple asset tracking. The use of location intelligence analytics enables predictive insights, helping administrators manage patient flow management and improve emergency response coordination, ultimately supporting the move towards value-based care.

Drivers, Trends, and Challenges in the Lbs In Healthcare Sector Market

Strategic decisions around deploying location-based services involve a complex cost-benefit analysis of RTLS in surgery departments and other critical areas. Healthcare providers evaluating options must consider the nuances of comparing UWB vs BLE for hospital asset tracking, as the choice impacts everything from initial investment to long-term operational efficiency.

For example, an ultra-wideband (UWB) based RTLS solution implementation, while having a higher initial cost, often delivers a superior ROI of RTLS implementation in healthcare facilities by enabling more precise clinical workflow optimization using RTLS. A key challenge involves the integration of LBS with electronic health record systems, a process governed by strict data security protocols under HIPAA.

In practice, a large hospital network might find that UWB systems reduce equipment search times by more than 50% compared to a less precise WiFi-based asset tracking solution. This directly improves staff productivity and patient throughput.

The best practices for deploying indoor navigation systems and the benefits of geofencing in long-term care facilities are also critical considerations, as they directly affect how organizations are using location data to improve patient experience.

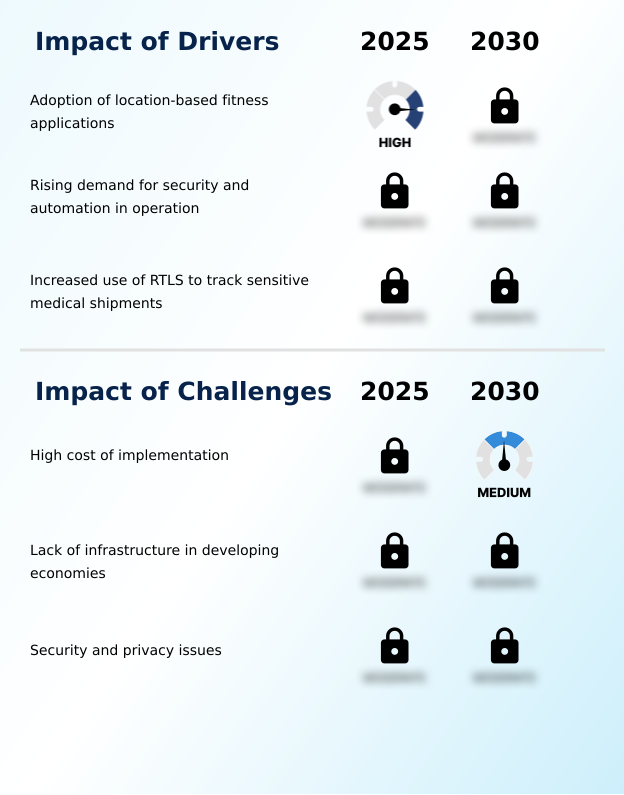
Primary Growth Driver: The increasing adoption of location-based fitness applications is a key driver, reflecting a broader shift toward preventive health practices and real-time wellness monitoring.

Market growth is propelled by an intense focus on operational efficiency and supply chain integrity.

The rising demand for security and automation is compelling healthcare facilities to adopt location-based automation to streamline workflows, secure sensitive areas, and reduce time spent on manual tasks, contributing to the market's 42.7% year-over-year growth.

Concurrently, the increased use of RTLS for medical equipment tracking is critical for managing high-value assets and ensuring their availability. This extends to logistics, where tracking sensitive medical shipments with temperature and humidity monitoring ensures supply chain visibility and compliance.

These drivers reflect a systemic shift toward data-driven operations where real-time location systems (RTLS) are fundamental to improving safety, reducing costs, and maintaining quality of care.

Emerging Market Trend: The growing popularity of location-based messaging is an emerging trend. This enables precise, contextual communication with patients and staff based on their real-time physical location within healthcare facilities.

Key market trends are centered on the fusion of location data with advanced analytics and communication platforms. The adoption of location-based messaging (LBM) is transforming patient and staff communication, moving beyond generic alerts to context-aware, real-time notifications that improve coordination. Simultaneously, the integration of advanced cloud-based location intelligence with IoT platforms allows healthcare facilities to leverage AI-driven location analytics.

This capability enables sophisticated patient flow optimization by analyzing movement patterns and predicting bottlenecks. As hospitals invest in smart hospital infrastructure, these interconnected technologies are becoming essential for creating a more responsive and efficient care environment, with indoor positioning systems and real-time data analytics forming the backbone of modern operational management and enhancing overall safety and resource utilization.

Key Industry Challenge: The high implementation cost, which includes specialized hardware, software integration, and staff training, remains a significant challenge to widespread market adoption.

Significant market challenges stem from high implementation costs and the complexities of system integration. Deploying comprehensive indoor positioning systems requires substantial upfront investment in RTLS hardware and tags, software, and infrastructure, which can be a major barrier, especially for smaller facilities. Furthermore, ensuring interoperability with EHR systems and other legacy platforms adds another layer of complexity and expense.

Data security and privacy issues remain a primary concern, as healthcare organizations must ensure that any LBS integration with EHR is fully compliant with regulations like HIPAA, protecting sensitive patient and staff location data. These hurdles can slow adoption, particularly in regions with less developed IT infrastructure, creating a gap between market potential and current implementation rates.

Explore Full Market Dynamics Analysis Request Free Sample

Lbs In Healthcare Sector Market Segmentation

The lbs in healthcare sector industry research report provides comprehensive data including region-wise segment analysis, with forecasts and analysis for the period 2026-2030, as well as historical data from 2020-2024 for the following segments.

Market Segment by Type
  • Indoor LBS
  • Outdoor LBS
Market Segment by Technology
  • RTLS
  • GPS or AGPS
Market Segment by End-user
  • Hospitals and clinics
  • Long-term care facilities
  • Others
Market Segment by Geography
North America
US, Canada, Mexico
Europe
Germany, UK, France, Italy, Spain, The Netherlands
APAC
China, India, Japan, South Korea, Australia, Indonesia
South America
Brazil, Argentina, Chile
Middle East and Africa
Saudi Arabia, UAE, South Africa, Israel, Turkey

Type Segment Analysis

The indoor lbs segment is estimated to witness significant growth during the forecast period.

The indoor LBS segment forms the core of digital infrastructure within clinical settings, addressing the critical need for precise tracking where satellite systems fail.

This sub-segment is indispensable for smart hospital models, leveraging technologies like bluetooth low energy (BLE) beacons, Wi-Fi based positioning, and ultra-wideband (UWB) technology.

These indoor positioning systems facilitate real-time location systems (RTLS) for high-value mobile assets, such as infusion pumps, which optimizes inventory and reduces equipment search times.

The segment, which accounts for the majority of the market, enhances patient safety by enabling staff duress and safety monitoring and streamlining clinical workflow optimization.

Demand is amplified by hardware-free solutions that use AI algorithms, providing floor-level accuracy for wayfinding and navigation without costly beacon installations.

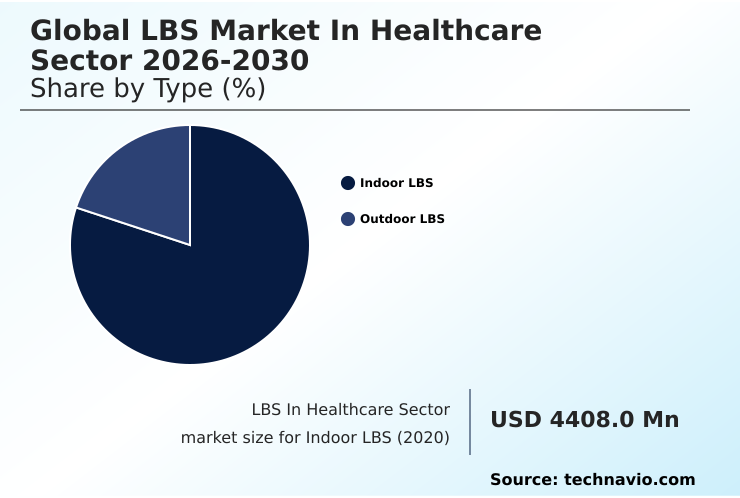
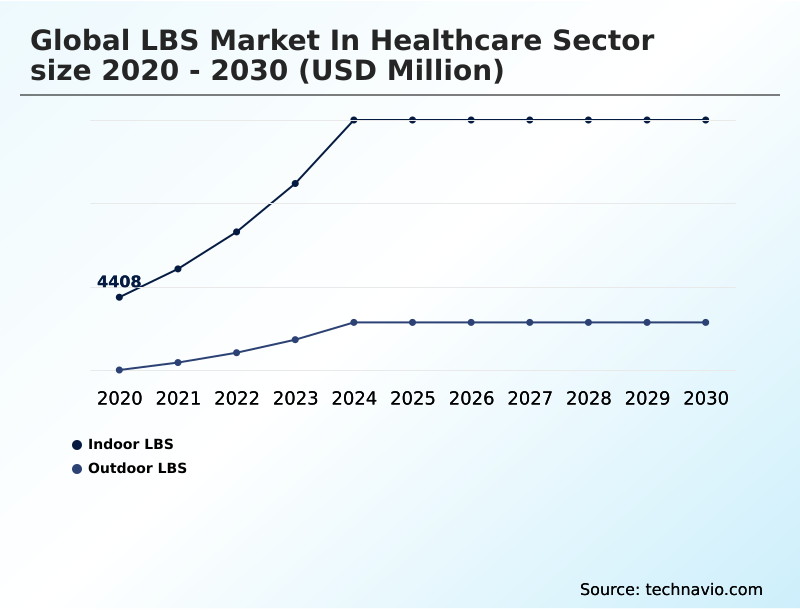
The Indoor LBS segment was valued at USD 12.47 billion in 2024 and showed a gradual increase during the forecast period.

Lbs In Healthcare Sector Market by Region: North America Leads with 41.7% Growth Share

North America is estimated to contribute 41.7% to the growth of the global market during the forecast period.

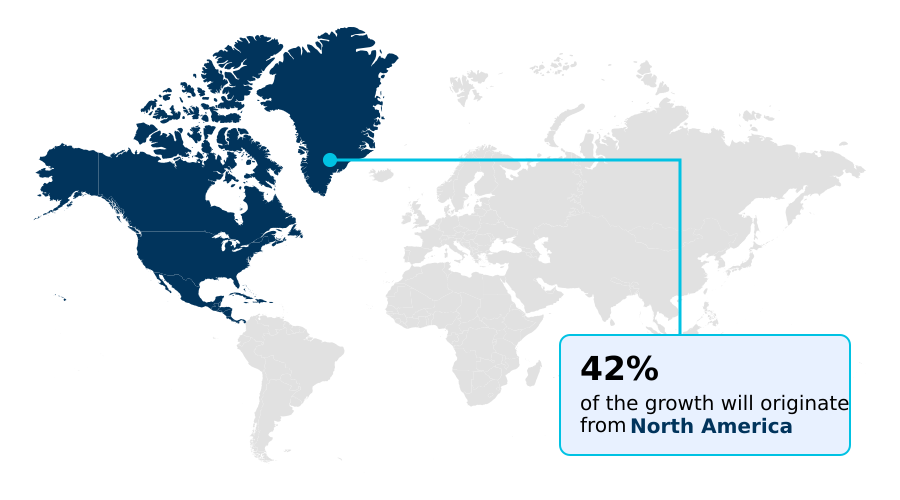
The geographic landscape of the market is led by North America, which accounts for over 41% of the incremental growth, driven by mature digital health frameworks and high adoption of real-time location systems (RTLS).

In this region, facilities prioritize solutions that ensure compliance with regulations like HIPAA. Europe follows, with a strong focus on data privacy under GDPR, which influences the design of indoor positioning systems and patient and staff location monitoring solutions.

The APAC region is the fastest-growing, fueled by government-led digital health initiatives in countries like China and India.

These markets are rapidly adopting technologies such as GPS and AGPS tracking for remote patient monitoring and deploying RFID asset tracking in new smart hospital projects to manage large-scale operational challenges and improve healthcare accessibility across vast populations.

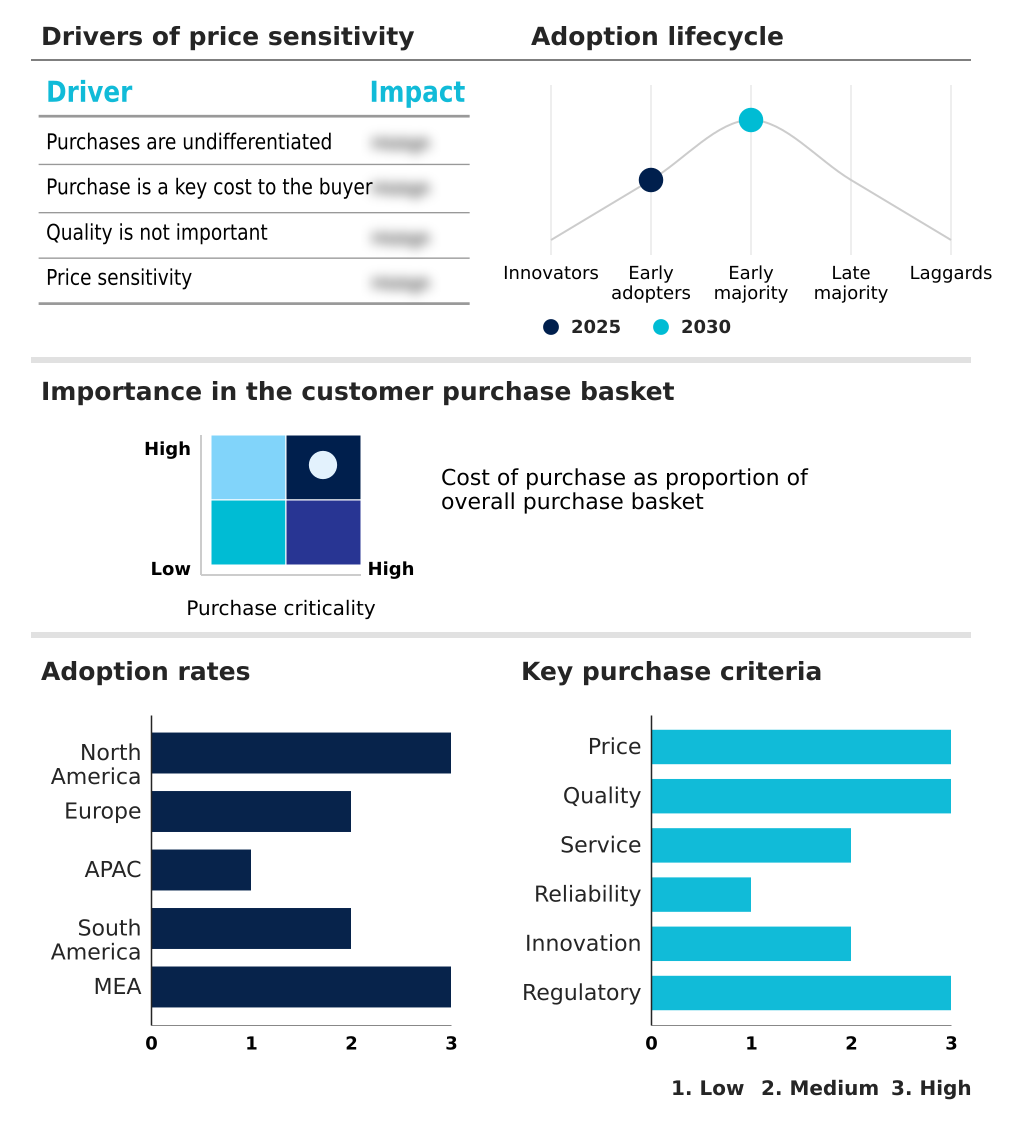
Customer Landscape Analysis for the Lbs In Healthcare Sector Market

The lbs in healthcare sector market forecasting report includes the adoption lifecycle of the market, covering from the innovator’s stage to the laggard’s stage. It focuses on adoption rates in different regions based on penetration. Furthermore, the lbs in healthcare sector market report also includes key purchase criteria and drivers of price sensitivity to help companies evaluate and develop their market growth analysis strategies.

Competitive Landscape of the Lbs In Healthcare Sector Market

Companies are implementing various strategies, such as strategic alliances, partnerships, mergers and acquisitions, geographical expansion, and product/service launches, to enhance their presence in the lbs in healthcare sector market industry.

Acceliot Inc. - Offerings include real-time location services, asset tracking, and patient monitoring solutions that enhance clinical workflows and operational efficiency in healthcare settings.

The industry research and growth report includes detailed analyses of the competitive landscape of the market and information about key companies, including:

  • Acceliot Inc.
  • AiRISTA Flow Inc.
  • Cardinal Health Inc.
  • Cisco Systems Inc.
  • Emanate Wireless Inc.
  • Esri Global Inc.
  • General Electric Co.
  • Hewlett Packard Entp. Co.
  • IBM Corp.
  • Koch Industries Inc.
  • Microsoft Corp.
  • Midmark Corp.
  • Navizon Inc.
  • Qorvo Inc.
  • Radianse
  • Securitas Healthcare LLC
  • Siemens AG
  • Sonitor Technologies AS
  • Zebra Technologies Corp.
  • Ziff Davis Inc.

Qualitative and quantitative analysis of companies has been conducted to help clients understand the wider business environment as well as the strengths and weaknesses of key industry players. Data is qualitatively analyzed to categorize companies as pure play, category-focused, industry-focused, and diversified; it is quantitatively analyzed to categorize companies as dominant, leading, strong, tentative, and weak.

Recent Developments in the Lbs In Healthcare Sector Market

  • In May 2025, Rede DOr Sao Luiz in Brazil implemented an integrated asset tracking system using RTLS technology to monitor life-saving ventilators and portable diagnostic equipment across its facilities, aiming to improve equipment utilization and staff efficiency.
  • In March 2025, the Indian government, through its Ayushman Bharat Digital Mission, launched a pilot program to integrate location-based verification for hospital empanelment, ensuring healthcare services are geographically accessible in underserved rural areas.
  • In January 2025, French authorities and European medical networks initiated a coordinated effort to standardize Radio-Frequency Identification (RFID) for pharmaceutical tracking, a move designed to secure the supply chain against counterfeit medications and improve visibility.
  • In February 2025, several prominent US health systems started deploying Blue Dot indoor navigation platforms, which provide patients with real-time, turn-by-turn guidance on smartphones to reduce wayfinding anxiety and missed appointments in large hospital campuses.

Research Analyst Overview: Lbs In Healthcare Sector Market

The market is rapidly evolving from standalone asset tracking solutions to fully integrated location intelligence platforms that are central to hospital operations. This shift is driven by the need for granular data to optimize workflows and ensure regulatory compliance with standards from bodies like The Joint Commission.

A key development is the fusion of real-time location systems (RTLS) with AI, enabling predictive location analytics for proactive resource management. For boardroom decision-makers, this translates to justifying CAPEX on advanced ultra-wideband (UWB) technology not just for its sub-meter accuracy but for its ability to generate a clear ROI through improved patient flow management and enhanced emergency response coordination.

With the market showing significant year-over-year growth of 42.7%, investment in smart hospital infrastructure, including indoor positioning systems and wearable location trackers, is no longer optional but a strategic necessity for competitive healthcare providers seeking to improve both safety and efficiency.

Dive into Technavio’s robust research methodology, blending expert interviews, extensive data synthesis, and validated models for unparalleled Lbs In Healthcare Sector Market insights. See full methodology.

Request Free Sample

Market Scope
Page number 294
Base year 2025
Historic period 2020-2024
Forecast period 2026-2030
Growth momentum & CAGR Accelerate at a CAGR of 71.7%
Market growth 2026-2030 USD 298473.7 million
Market structure Fragmented
YoY growth 2025-2026(%) 42.7%
Key countries US, Canada, Mexico, Germany, UK, France, Italy, Spain, The Netherlands, China, India, Japan, South Korea, Australia, Indonesia, Brazil, Argentina, Chile, Saudi Arabia, UAE, South Africa, Israel and Turkey
Competitive landscape Leading Companies, Market Positioning of Companies, Competitive Strategies, and Industry Risks

Lbs In Healthcare Sector Market: Key Questions Answered in This Report

  • What is the expected growth of the Lbs In Healthcare Sector Market between 2026 and 2030?

    • The Lbs In Healthcare Sector Market is expected to grow by USD 298.47 billion during 2026-2030, registering a CAGR of 71.7%. Year-over-year growth in 2026 is estimated at 42.7%%. This acceleration is shaped by adoption of location-based fitness applications, which is intensifying demand across multiple end-use verticals covered in the report.

  • What segmentation does the market report cover?

    • The report is segmented by Type (Indoor LBS, and Outdoor LBS), Technology (RTLS, and GPS or AGPS), End-user (Hospitals and clinics, Long-term care facilities, and Others) and Geography (North America, Europe, APAC, South America, Middle East and Africa). Among these, the Indoor LBS segment is estimated to witness significant growth during the forecast period, driven by rising adoption across key application areas. Each segment includes detailed qualitative and quantitative analysis, along with historical data from 2020-2024 and forecasts through 2030 with year-over-year growth rates.

  • Which regions are analyzed in the report?

    • The report covers North America, Europe, APAC, South America and Middle East and Africa. North America is estimated to contribute 41.7% to market growth during the forecast period. Country-level analysis includes US, Canada, Mexico, Germany, UK, France, Italy, Spain, The Netherlands, China, India, Japan, South Korea, Australia, Indonesia, Brazil, Argentina, Chile, Saudi Arabia, UAE, South Africa, Israel and Turkey, with dedicated market size tables and year-over-year growth for each.

  • What are the key growth drivers and market challenges?

    • The primary driver is adoption of location-based fitness applications, which is accelerating investment and industry demand. The main challenge is high cost of implementation, creating operational barriers for key market participants. The report quantifies the impact of each driver and challenge across 2026 and 2030 with comparative analysis.

  • Who are the major players in the Lbs In Healthcare Sector Market?

    • Key vendors include Acceliot Inc., AiRISTA Flow Inc., Cardinal Health Inc., Cisco Systems Inc., Emanate Wireless Inc., Esri Global Inc., General Electric Co., Hewlett Packard Entp. Co., IBM Corp., Koch Industries Inc., Microsoft Corp., Midmark Corp., Navizon Inc., Qorvo Inc., Radianse, Securitas Healthcare LLC, Siemens AG, Sonitor Technologies AS, Zebra Technologies Corp. and Ziff Davis Inc.. The report provides qualitative and quantitative analysis categorizing companies as dominant, leading, strong, tentative, and weak based on their market positioning. Company profiles include business segment analysis, SWOT assessment, key offerings, and recent strategic developments.

Lbs In Healthcare Sector Market Research Insights

Market dynamics are increasingly shaped by the need for operational efficiency under strict regulatory oversight. The adoption of smart hospital infrastructure and advanced real-time data analytics is becoming standard practice. For example, long-term care facilities are now implementing wearable location trackers for wander management solutions, a use case that demands high accuracy and reliability.

While hospitals and clinics remain the largest end-user segment, the application of location-based compliance reporting is growing in other areas, such as laboratory sample tracking. The market's trajectory is heavily influenced by the ability of vendors to provide HIPAA compliant location data systems.

These platforms must support not only asset tracking but also advanced functions like location analytics for infection control and emergency department flow optimization, reflecting a move toward more integrated and intelligent healthcare ecosystems.

We can help! Our analysts can customize this lbs in healthcare sector market research report to meet your requirements.

Get in touch

1. Executive Summary

1.1 Market overview

Executive Summary - Chart on Market Overview
Executive Summary - Data Table on Market Overview
Executive Summary - Chart on Global Market Characteristics
Executive Summary - Chart on Market by Geography
Executive Summary - Chart on Market Segmentation by Type
Executive Summary - Chart on Market Segmentation by Technology
Executive Summary - Chart on Market Segmentation by End-user
Executive Summary - Chart on Incremental Growth
Executive Summary - Data Table on Incremental Growth
Executive Summary - Chart on Company Market Positioning

2. Technavio Analysis

2.1 Analysis of price sensitivity, lifecycle, customer purchase basket, adoption rates, and purchase criteria

2.2 Criticality of inputs and Factors of differentiation

Chart on Overview on criticality of inputs and factors of differentiation

2.3 Factors of disruption

Chart on Overview on factors of disruption

2.4 Impact of drivers and challenges

Chart on Impact of drivers and challenges in 2025 and 2030

3. Market Landscape

3.1 Market ecosystem

Chart on Parent Market
Data Table on - Parent Market

3.2 Market characteristics

Chart on Market characteristics analysis

3.3 Value chain analysis

Chart on Value chain analysis

4. Market Sizing

4.1 Market definition

Data Table on Offerings of companies included in the market definition

4.2 Market segment analysis

Market segments

4.3 Market size 2025

4.4 Market outlook: Forecast for 2025-2030

Chart on Global - Market size and forecast 2025-2030 ($ million)
Data Table on Global - Market size and forecast 2025-2030 ($ million)
Chart on Global Market: Year-over-year growth 2025-2030 (%)
Data Table on Global Market: Year-over-year growth 2025-2030 (%)

5. Historic Market Size

5.1 Global LBS Market In Healthcare Sector 2020 - 2024

Historic Market Size - Data Table on Global LBS Market In Healthcare Sector 2020 - 2024 ($ million)

5.2 Type segment analysis 2020 - 2024

Historic Market Size - Type Segment 2020 - 2024 ($ million)

5.3 Technology segment analysis 2020 - 2024

Historic Market Size - Technology Segment 2020 - 2024 ($ million)

5.4 End-user segment analysis 2020 - 2024

Historic Market Size - End-user Segment 2020 - 2024 ($ million)

5.5 Geography segment analysis 2020 - 2024

Historic Market Size - Geography Segment 2020 - 2024 ($ million)

5.6 Country segment analysis 2020 - 2024

Historic Market Size - Country Segment 2020 - 2024 ($ million)

6. Qualitative Analysis

6.1 Impact of AI on the Global LBS Market in Healthcare Sector

7. Five Forces Analysis

7.1 Five forces summary

Five forces analysis - Comparison between 2025 and 2030

7.2 Bargaining power of buyers

Bargaining power of buyers - Impact of key factors 2025 and 2030

7.3 Bargaining power of suppliers

Bargaining power of suppliers - Impact of key factors in 2025 and 2030

7.4 Threat of new entrants

Threat of new entrants - Impact of key factors in 2025 and 2030

7.5 Threat of substitutes

Threat of substitutes - Impact of key factors in 2025 and 2030

7.6 Threat of rivalry

Threat of rivalry - Impact of key factors in 2025 and 2030

7.7 Market condition

Chart on Market condition - Five forces 2025 and 2030

8. Market Segmentation by Type

8.1 Market segments

Chart on Type - Market share 2025-2030 (%)
Data Table on Type - Market share 2025-2030 (%)

8.2 Comparison by Type

Chart on Comparison by Type
Data Table on Comparison by Type

8.3 Indoor LBS - Market size and forecast 2025-2030

Chart on Indoor LBS - Market size and forecast 2025-2030 ($ million)
Data Table on Indoor LBS - Market size and forecast 2025-2030 ($ million)
Chart on Indoor LBS - Year-over-year growth 2025-2030 (%)
Data Table on Indoor LBS - Year-over-year growth 2025-2030 (%)

8.4 Outdoor LBS - Market size and forecast 2025-2030

Chart on Outdoor LBS - Market size and forecast 2025-2030 ($ million)
Data Table on Outdoor LBS - Market size and forecast 2025-2030 ($ million)
Chart on Outdoor LBS - Year-over-year growth 2025-2030 (%)
Data Table on Outdoor LBS - Year-over-year growth 2025-2030 (%)

8.5 Market opportunity by Type

Market opportunity by Type ($ million)
Data Table on Market opportunity by Type ($ million)

9. Market Segmentation by Technology

9.1 Market segments

Chart on Technology - Market share 2025-2030 (%)
Data Table on Technology - Market share 2025-2030 (%)

9.2 Comparison by Technology

Chart on Comparison by Technology
Data Table on Comparison by Technology

9.3 RTLS - Market size and forecast 2025-2030

Chart on RTLS - Market size and forecast 2025-2030 ($ million)
Data Table on RTLS - Market size and forecast 2025-2030 ($ million)
Chart on RTLS - Year-over-year growth 2025-2030 (%)
Data Table on RTLS - Year-over-year growth 2025-2030 (%)

9.4 GPS or AGPS - Market size and forecast 2025-2030

Chart on GPS or AGPS - Market size and forecast 2025-2030 ($ million)
Data Table on GPS or AGPS - Market size and forecast 2025-2030 ($ million)
Chart on GPS or AGPS - Year-over-year growth 2025-2030 (%)
Data Table on GPS or AGPS - Year-over-year growth 2025-2030 (%)

9.5 Market opportunity by Technology

Market opportunity by Technology ($ million)
Data Table on Market opportunity by Technology ($ million)

10. Market Segmentation by End-user

10.1 Market segments

Chart on End-user - Market share 2025-2030 (%)
Data Table on End-user - Market share 2025-2030 (%)

10.2 Comparison by End-user

Chart on Comparison by End-user
Data Table on Comparison by End-user

10.3 Hospitals and clinics - Market size and forecast 2025-2030

Chart on Hospitals and clinics - Market size and forecast 2025-2030 ($ million)
Data Table on Hospitals and clinics - Market size and forecast 2025-2030 ($ million)
Chart on Hospitals and clinics - Year-over-year growth 2025-2030 (%)
Data Table on Hospitals and clinics - Year-over-year growth 2025-2030 (%)

10.4 Long-term care facilities - Market size and forecast 2025-2030

Chart on Long-term care facilities - Market size and forecast 2025-2030 ($ million)
Data Table on Long-term care facilities - Market size and forecast 2025-2030 ($ million)
Chart on Long-term care facilities - Year-over-year growth 2025-2030 (%)
Data Table on Long-term care facilities - Year-over-year growth 2025-2030 (%)

10.5 Others - Market size and forecast 2025-2030

Chart on Others - Market size and forecast 2025-2030 ($ million)
Data Table on Others - Market size and forecast 2025-2030 ($ million)
Chart on Others - Year-over-year growth 2025-2030 (%)
Data Table on Others - Year-over-year growth 2025-2030 (%)

10.6 Market opportunity by End-user

Market opportunity by End-user ($ million)
Data Table on Market opportunity by End-user ($ million)

11. Customer Landscape

11.1 Customer landscape overview

Analysis of price sensitivity, lifecycle, customer purchase basket, adoption rates, and purchase criteria

12. Geographic Landscape

12.1 Geographic segmentation

Chart on Market share by geography 2025-2030 (%)
Data Table on Market share by geography 2025-2030 (%)

12.2 Geographic comparison

Chart on Geographic comparison
Data Table on Geographic comparison

12.3 North America - Market size and forecast 2025-2030

Chart on North America - Market size and forecast 2025-2030 ($ million)
Data Table on North America - Market size and forecast 2025-2030 ($ million)
Chart on North America - Year-over-year growth 2025-2030 (%)
Data Table on North America - Year-over-year growth 2025-2030 (%)
Chart on Regional Comparison - North America
Data Table on Regional Comparison - North America

12.3.1 US - Market size and forecast 2025-2030

Chart on US - Market size and forecast 2025-2030 ($ million)
Data Table on US - Market size and forecast 2025-2030 ($ million)
Chart on US - Year-over-year growth 2025-2030 (%)
Data Table on US - Year-over-year growth 2025-2030 (%)

12.3.2 Canada - Market size and forecast 2025-2030

Chart on Canada - Market size and forecast 2025-2030 ($ million)
Data Table on Canada - Market size and forecast 2025-2030 ($ million)
Chart on Canada - Year-over-year growth 2025-2030 (%)
Data Table on Canada - Year-over-year growth 2025-2030 (%)

12.3.3 Mexico - Market size and forecast 2025-2030

Chart on Mexico - Market size and forecast 2025-2030 ($ million)
Data Table on Mexico - Market size and forecast 2025-2030 ($ million)
Chart on Mexico - Year-over-year growth 2025-2030 (%)
Data Table on Mexico - Year-over-year growth 2025-2030 (%)

12.4 Europe - Market size and forecast 2025-2030

Chart on Europe - Market size and forecast 2025-2030 ($ million)
Data Table on Europe - Market size and forecast 2025-2030 ($ million)
Chart on Europe - Year-over-year growth 2025-2030 (%)
Data Table on Europe - Year-over-year growth 2025-2030 (%)
Chart on Regional Comparison - Europe
Data Table on Regional Comparison - Europe

12.4.1 Germany - Market size and forecast 2025-2030

Chart on Germany - Market size and forecast 2025-2030 ($ million)
Data Table on Germany - Market size and forecast 2025-2030 ($ million)
Chart on Germany - Year-over-year growth 2025-2030 (%)
Data Table on Germany - Year-over-year growth 2025-2030 (%)

12.4.2 UK - Market size and forecast 2025-2030

Chart on UK - Market size and forecast 2025-2030 ($ million)
Data Table on UK - Market size and forecast 2025-2030 ($ million)
Chart on UK - Year-over-year growth 2025-2030 (%)
Data Table on UK - Year-over-year growth 2025-2030 (%)

12.4.3 France - Market size and forecast 2025-2030

Chart on France - Market size and forecast 2025-2030 ($ million)
Data Table on France - Market size and forecast 2025-2030 ($ million)
Chart on France - Year-over-year growth 2025-2030 (%)
Data Table on France - Year-over-year growth 2025-2030 (%)

12.4.4 Italy - Market size and forecast 2025-2030

Chart on Italy - Market size and forecast 2025-2030 ($ million)
Data Table on Italy - Market size and forecast 2025-2030 ($ million)
Chart on Italy - Year-over-year growth 2025-2030 (%)
Data Table on Italy - Year-over-year growth 2025-2030 (%)

12.4.5 Spain - Market size and forecast 2025-2030

Chart on Spain - Market size and forecast 2025-2030 ($ million)
Data Table on Spain - Market size and forecast 2025-2030 ($ million)
Chart on Spain - Year-over-year growth 2025-2030 (%)
Data Table on Spain - Year-over-year growth 2025-2030 (%)

12.4.6 The Netherlands - Market size and forecast 2025-2030

Chart on The Netherlands - Market size and forecast 2025-2030 ($ million)
Data Table on The Netherlands - Market size and forecast 2025-2030 ($ million)
Chart on The Netherlands - Year-over-year growth 2025-2030 (%)
Data Table on The Netherlands - Year-over-year growth 2025-2030 (%)

12.5 APAC - Market size and forecast 2025-2030

Chart on APAC - Market size and forecast 2025-2030 ($ million)
Data Table on APAC - Market size and forecast 2025-2030 ($ million)
Chart on APAC - Year-over-year growth 2025-2030 (%)
Data Table on APAC - Year-over-year growth 2025-2030 (%)
Chart on Regional Comparison - APAC
Data Table on Regional Comparison - APAC

12.5.1 China - Market size and forecast 2025-2030

Chart on China - Market size and forecast 2025-2030 ($ million)
Data Table on China - Market size and forecast 2025-2030 ($ million)
Chart on China - Year-over-year growth 2025-2030 (%)
Data Table on China - Year-over-year growth 2025-2030 (%)

12.5.2 India - Market size and forecast 2025-2030

Chart on India - Market size and forecast 2025-2030 ($ million)
Data Table on India - Market size and forecast 2025-2030 ($ million)
Chart on India - Year-over-year growth 2025-2030 (%)
Data Table on India - Year-over-year growth 2025-2030 (%)

12.5.3 Japan - Market size and forecast 2025-2030

Chart on Japan - Market size and forecast 2025-2030 ($ million)
Data Table on Japan - Market size and forecast 2025-2030 ($ million)
Chart on Japan - Year-over-year growth 2025-2030 (%)
Data Table on Japan - Year-over-year growth 2025-2030 (%)

12.5.4 South Korea - Market size and forecast 2025-2030

Chart on South Korea - Market size and forecast 2025-2030 ($ million)
Data Table on South Korea - Market size and forecast 2025-2030 ($ million)
Chart on South Korea - Year-over-year growth 2025-2030 (%)
Data Table on South Korea - Year-over-year growth 2025-2030 (%)

12.5.5 Australia - Market size and forecast 2025-2030

Chart on Australia - Market size and forecast 2025-2030 ($ million)
Data Table on Australia - Market size and forecast 2025-2030 ($ million)
Chart on Australia - Year-over-year growth 2025-2030 (%)
Data Table on Australia - Year-over-year growth 2025-2030 (%)

12.5.6 Indonesia - Market size and forecast 2025-2030

Chart on Indonesia - Market size and forecast 2025-2030 ($ million)
Data Table on Indonesia - Market size and forecast 2025-2030 ($ million)
Chart on Indonesia - Year-over-year growth 2025-2030 (%)
Data Table on Indonesia - Year-over-year growth 2025-2030 (%)

12.6 South America - Market size and forecast 2025-2030

Chart on South America - Market size and forecast 2025-2030 ($ million)
Data Table on South America - Market size and forecast 2025-2030 ($ million)
Chart on South America - Year-over-year growth 2025-2030 (%)
Data Table on South America - Year-over-year growth 2025-2030 (%)
Chart on Regional Comparison - South America
Data Table on Regional Comparison - South America

12.6.1 Brazil - Market size and forecast 2025-2030

Chart on Brazil - Market size and forecast 2025-2030 ($ million)
Data Table on Brazil - Market size and forecast 2025-2030 ($ million)
Chart on Brazil - Year-over-year growth 2025-2030 (%)
Data Table on Brazil - Year-over-year growth 2025-2030 (%)

12.6.2 Argentina - Market size and forecast 2025-2030

Chart on Argentina - Market size and forecast 2025-2030 ($ million)
Data Table on Argentina - Market size and forecast 2025-2030 ($ million)
Chart on Argentina - Year-over-year growth 2025-2030 (%)
Data Table on Argentina - Year-over-year growth 2025-2030 (%)

12.6.3 Chile - Market size and forecast 2025-2030

Chart on Chile - Market size and forecast 2025-2030 ($ million)
Data Table on Chile - Market size and forecast 2025-2030 ($ million)
Chart on Chile - Year-over-year growth 2025-2030 (%)
Data Table on Chile - Year-over-year growth 2025-2030 (%)

12.7 Middle East and Africa - Market size and forecast 2025-2030

Chart on Middle East and Africa - Market size and forecast 2025-2030 ($ million)
Data Table on Middle East and Africa - Market size and forecast 2025-2030 ($ million)
Chart on Middle East and Africa - Year-over-year growth 2025-2030 (%)
Data Table on Middle East and Africa - Year-over-year growth 2025-2030 (%)
Chart on Regional Comparison - Middle East and Africa
Data Table on Regional Comparison - Middle East and Africa

12.7.1 Saudi Arabia - Market size and forecast 2025-2030

Chart on Saudi Arabia - Market size and forecast 2025-2030 ($ million)
Data Table on Saudi Arabia - Market size and forecast 2025-2030 ($ million)
Chart on Saudi Arabia - Year-over-year growth 2025-2030 (%)
Data Table on Saudi Arabia - Year-over-year growth 2025-2030 (%)

12.7.2 UAE - Market size and forecast 2025-2030

Chart on UAE - Market size and forecast 2025-2030 ($ million)
Data Table on UAE - Market size and forecast 2025-2030 ($ million)
Chart on UAE - Year-over-year growth 2025-2030 (%)
Data Table on UAE - Year-over-year growth 2025-2030 (%)

12.7.3 South Africa - Market size and forecast 2025-2030

Chart on South Africa - Market size and forecast 2025-2030 ($ million)
Data Table on South Africa - Market size and forecast 2025-2030 ($ million)
Chart on South Africa - Year-over-year growth 2025-2030 (%)
Data Table on South Africa - Year-over-year growth 2025-2030 (%)

12.7.4 Israel - Market size and forecast 2025-2030

Chart on Israel - Market size and forecast 2025-2030 ($ million)
Data Table on Israel - Market size and forecast 2025-2030 ($ million)
Chart on Israel - Year-over-year growth 2025-2030 (%)
Data Table on Israel - Year-over-year growth 2025-2030 (%)

12.7.5 Turkey - Market size and forecast 2025-2030

Chart on Turkey - Market size and forecast 2025-2030 ($ million)
Data Table on Turkey - Market size and forecast 2025-2030 ($ million)
Chart on Turkey - Year-over-year growth 2025-2030 (%)
Data Table on Turkey - Year-over-year growth 2025-2030 (%)

12.8 Market opportunity by geography

Market opportunity by geography ($ million)
Data Tables on Market opportunity by geography ($ million)

13. Drivers, Challenges, and Opportunity

13.1 Market drivers

Adoption of location-based fitness applications
Rising demand for security and automation in operation
Increased use of RTLS to track sensitive medical shipments

13.2 Market challenges

High cost of implementation
Lack of infrastructure in developing economies
Security and privacy issues

13.3 Impact of drivers and challenges

Impact of drivers and challenges in 2025 and 2030

13.4 Market opportunities

Growing popularity of location-based messaging (LBM)
Presence of new and effective technologies
Advanced cloud analytics using real-time data

14. Competitive Landscape

14.1 Overview

14.2

Overview on criticality of inputs and factors of differentiation

14.3 Landscape disruption

Overview on factors of disruption

14.4 Industry risks

Impact of key risks on business

15. Competitive Analysis

15.1 Companies profiled

Companies covered

15.2 Company ranking index

15.3 Market positioning of companies

Matrix on companies position and classification

15.4 Acceliot Inc.

Acceliot Inc. - Overview
Acceliot Inc. - Product / Service
Acceliot Inc. - Key offerings
SWOT

15.5 AiRISTA Flow Inc.

AiRISTA Flow Inc. - Overview
AiRISTA Flow Inc. - Product / Service
AiRISTA Flow Inc. - Key offerings
SWOT

15.6 Cardinal Health Inc.

Cardinal Health Inc. - Overview
Cardinal Health Inc. - Business segments
Cardinal Health Inc. - Key news
Cardinal Health Inc. - Key offerings
Cardinal Health Inc. - Segment focus
SWOT

15.7 Cisco Systems Inc.

Cisco Systems Inc. - Overview
Cisco Systems Inc. - Business segments
Cisco Systems Inc. - Key news
Cisco Systems Inc. - Key offerings
Cisco Systems Inc. - Segment focus
SWOT

15.8 General Electric Co.

General Electric Co. - Overview
General Electric Co. - Business segments
General Electric Co. - Key news
General Electric Co. - Key offerings
General Electric Co. - Segment focus
SWOT

15.9 Hewlett Packard Entp. Co.

Hewlett Packard Entp. Co. - Overview
Hewlett Packard Entp. Co. - Business segments
Hewlett Packard Entp. Co. - Key news
Hewlett Packard Entp. Co. - Key offerings
Hewlett Packard Entp. Co. - Segment focus
SWOT

15.10 IBM Corp.

IBM Corp. - Overview
IBM Corp. - Business segments
IBM Corp. - Key news
IBM Corp. - Key offerings
IBM Corp. - Segment focus
SWOT

15.11 Koch Industries Inc.

Koch Industries Inc. - Overview
Koch Industries Inc. - Product / Service
Koch Industries Inc. - Key offerings
SWOT

15.12 Microsoft Corp.

Microsoft Corp. - Overview
Microsoft Corp. - Business segments
Microsoft Corp. - Key news
Microsoft Corp. - Key offerings
Microsoft Corp. - Segment focus
SWOT

15.13 Midmark Corp.

Midmark Corp. - Overview
Midmark Corp. - Product / Service
Midmark Corp. - Key offerings
SWOT

15.14 Qorvo Inc.

Qorvo Inc. - Overview
Qorvo Inc. - Business segments
Qorvo Inc. - Key news
Qorvo Inc. - Key offerings
Qorvo Inc. - Segment focus
SWOT

15.15 Securitas Healthcare LLC

Securitas Healthcare LLC - Overview
Securitas Healthcare LLC - Product / Service
Securitas Healthcare LLC - Key offerings
SWOT

15.16 Siemens AG

Siemens AG - Overview
Siemens AG - Business segments
Siemens AG - Key news
Siemens AG - Key offerings
Siemens AG - Segment focus
SWOT

15.17 Zebra Technologies Corp.

Zebra Technologies Corp. - Overview
Zebra Technologies Corp. - Business segments
Zebra Technologies Corp. - Key news
Zebra Technologies Corp. - Key offerings
Zebra Technologies Corp. - Segment focus
SWOT

15.18 Ziff Davis Inc.

Ziff Davis Inc. - Overview
Ziff Davis Inc. - Business segments
Ziff Davis Inc. - Key offerings
Ziff Davis Inc. - Segment focus
SWOT

16. Appendix

16.1 Scope of the report

Market definition
Objectives
Notes and caveats

16.2 Inclusions and exclusions checklist

Inclusions checklist
Exclusions checklist

16.3 Currency conversion rates for US$

16.4 Research methodology

16.5 Data procurement

Information sources

16.6 Data validation

16.7 Validation techniques employed for market sizing

16.8 Data synthesis

16.9 360 degree market analysis

16.10 List of abbreviations

Research Methodology

Technavio presents a detailed picture of the market by way of study, synthesis, and summation of data from multiple sources. The analysts have presented the various facets of the market with a particular focus on identifying the key industry influencers. The data thus presented is comprehensive, reliable, and the result of extensive research, both primary and secondary.

INFORMATION SOURCES

Primary sources

  • Manufacturers and suppliers
  • Channel partners
  • Industry experts
  • Strategic decision makers

Secondary sources

  • Industry journals and periodicals
  • Government data
  • Financial reports of key industry players
  • Historical data
  • Press releases

DATA ANALYSIS

Data Synthesis

  • Collation of data
  • Estimation of key figures
  • Analysis of derived insights

Data Validation

  • Triangulation with data models
  • Reference against proprietary databases
  • Corroboration with industry experts

REPORT WRITING

Qualitative

  • Market drivers
  • Market challenges
  • Market trends
  • Five forces analysis

Quantitative

  • Market size and forecast
  • Market segmentation
  • Geographical insights
  • Competitive landscape

Interested in this report?

Get your sample now to see our research methodology and insights!

Download Now

Frequently Asked Questions

Lbs In Healthcare Sector market growth will increase by USD 298473.7 million during 2026-2030.

The Lbs In Healthcare Sector market is expected to grow at a CAGR of 71.7% during 2026-2030.

Lbs In Healthcare Sector market is segmented by Type (Indoor LBS, Outdoor LBS) Technology (RTLS, GPS or AGPS) End-user (Hospitals and clinics, Long-term care facilities, Others)

Acceliot Inc., AiRISTA Flow Inc., Cardinal Health Inc., Cisco Systems Inc., Emanate Wireless Inc., Esri Global Inc., General Electric Co., Hewlett Packard Entp. Co., IBM Corp., Koch Industries Inc., Microsoft Corp., Midmark Corp., Navizon Inc., Qorvo Inc., Radianse, Securitas Healthcare LLC, Siemens AG, Sonitor Technologies AS, Zebra Technologies Corp., Ziff Davis Inc. are a few of the key vendors in the Lbs In Healthcare Sector market.

North America will register the highest growth rate of 41.7% among the other regions. Therefore, the Lbs In Healthcare Sector market in North America is expected to garner significant business opportunities for the vendors during the forecast period.

US, Canada, Mexico, Germany, UK, France, Italy, Spain, The Netherlands, China, India, Japan, South Korea, Australia, Indonesia, Brazil, Argentina, Chile, Saudi Arabia, UAE, South Africa, Israel, Turkey

  • Adoption of location-based fitness applications is the driving factor this market.

The Lbs In Healthcare Sector market vendors should focus on grabbing business opportunities from the Type segment as it accounted for the largest market share in the base year.
RIA - Research AI Assistant
Ask RIA