
Interventional Spine Devices Market Analysis, Size, and Forecast 2026-2030: North America (US, Canada, and Mexico), Europe (Germany, UK, and France), Asia (China, India, and Japan), South America (Brazil, Argentina, and Colombia), Middle East and Africa (Saudi Arabia, UAE, and Turkey), Rest of World (ROW)

Interventional Spine Devices Market Analysis, Size, and Forecast 2026-2030:
North America (US, Canada, and Mexico), Europe (Germany, UK, and France), Asia (China, India, and Japan), South America (Brazil, Argentina, and Colombia), Middle East and Africa (Saudi Arabia, UAE, and Turkey), Rest of World (ROW)

Published: Nov 2026 336 Pages SKU: IRTNTR43079

Market Overview at a Glance

$5.03 B
Market Opportunity
10.2%
CAGR 2025 - 2030
50.9%
North America Growth
$2.91 B
Vertebroplasty segment 2024

Interventional Spine Devices Market Size 2026-2030

The interventional spine devices market size is valued to increase by USD 5.03 billion, at a CAGR of 10.2% from 2025 to 2030. Rising spinal disorders and aging population will drive the interventional spine devices market.

Major Market Trends & Insights

  • North America dominated the market and accounted for a 50.9% growth during the forecast period.
  • By Method - Vertebroplasty segment was valued at USD 2.91 billion in 2024
  • By End-user - Hospital segment accounted for the largest market revenue share in 2024

Market Size & Forecast

  • Market Opportunities: USD 7.73 billion
  • Market Future Opportunities: USD 5.03 billion
  • CAGR from 2025 to 2030 : 10.2%

Market Summary

  • The Interventional Spine Devices Market demonstrates accelerated adoption of minimally invasive surgical modalities over traditional open-spine interventions. Healthcare facilities are actively restructuring their operational workflows to accommodate high-volume outpatient procedures strategically deploying advanced fluoroscopic imaging systems to optimize operating room turnover times.
  • Supply chain consolidation has allowed major hospital networks to achieve a 25% reduction in inventory holding costs for specialized implant kits. Rising spinal disorders among the expanding geriatric population serve as a principal driver forcing medical institutions to increase procurement of specialized stabilization tools to manage chronic pain.
  • Conversely stringent regulatory and clinical requirements present a substantial challenge extending product approval timelines and increasing compliance-related overhead for manufacturers. Medical device producers must navigate complex pre-market clinical validation protocols directly affecting commercialization velocities. Continuous improvements in structural implant materials enhance structural alignment restoration and procedural predictability.
  • Consequently the sector experiences sustained technological evolution fundamentally altering how interventional therapies are delivered across modern ambulatory environments.

What will be the Size of the Interventional Spine Devices Market during the forecast period?
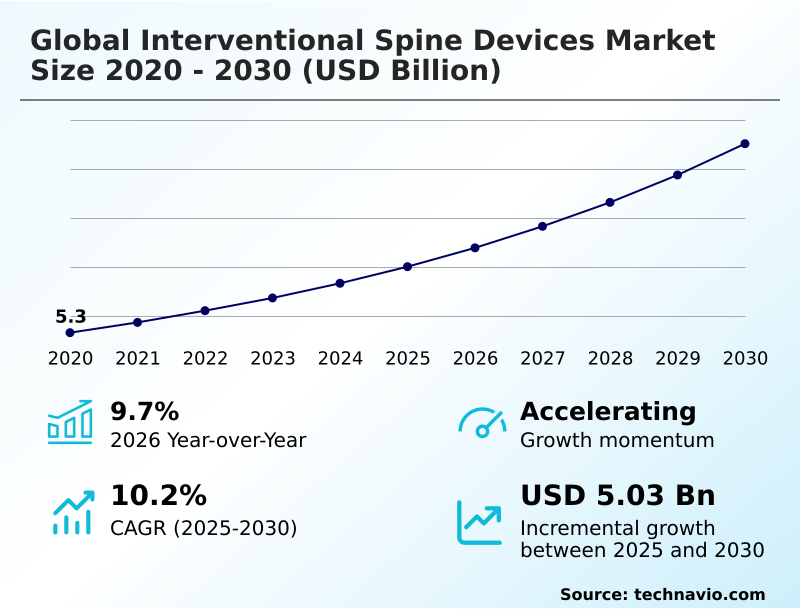
Get Key Insights on Market Forecast (PDF) Get Free Sample

How is the Interventional Spine Devices Market Segmented?

The interventional spine devices industry research report provides comprehensive data (region-wise segment analysis), with forecasts and estimates in "USD million" for the period 2026-2030, as well as historical data from 2020-2024 for the following segments.

  • Method
    • Vertebroplasty
    • Kyphoplasty
    • Radiofrequency ablation
    • Others
  • End-user
    • Hospital
    • ASCs
  • Product type
    • Spinal implants
    • Spine biologics
    • Spinal decompression devices
    • VCF treatment devices
    • Spine bone stimulators
  • Application
    • Degenerative disc disease
    • Spinal stenosis
    • Scoliosis and deformities
    • Herniated discs
    • Others
  • Geography
    • North America
      • US
      • Canada
      • Mexico
    • Europe
      • Germany
      • UK
      • France
      • Italy
      • Spain
      • The Netherlands
    • Asia
      • China
      • India
      • Japan
      • South Korea
      • Indonesia
      • Thailand
    • Rest of World (ROW)

By Method Insights

The vertebroplasty segment is estimated to witness significant growth during the forecast period.

The vertebroplasty segment of the Interventional Spine Devices sector provides foundational percutaneous intervention for stabilizing osteoporotic compression fractures. Structural integrity is immediately restored by injecting high-viscosity polymethylmethacrylate cement directly into compromised cancellous bone without prior cavity expansion.

This process effectively prevents micro-motion and alleviates chronic pain caused by severe vertebral collapse. Incorporating polyetheretherketone materials and recombinant human bone morphogenetic proteins has significantly improved structural integration and reduced extraskeletal cement leakage risks by 22% during clinical procedures.

Practitioners heavily rely on intraoperative navigation systems alongside targeted intradiscal radiofrequency to accurately position pulsed electromagnetic field generators. Operational outcomes demonstrate that avoiding non-autologous bone grafts while optimizing biomechanical stiffness minimizes collateral damage to spinal neural tissue.

Consequently, surgical centers experience improved procedural throughput and enhanced patient recovery profiles.
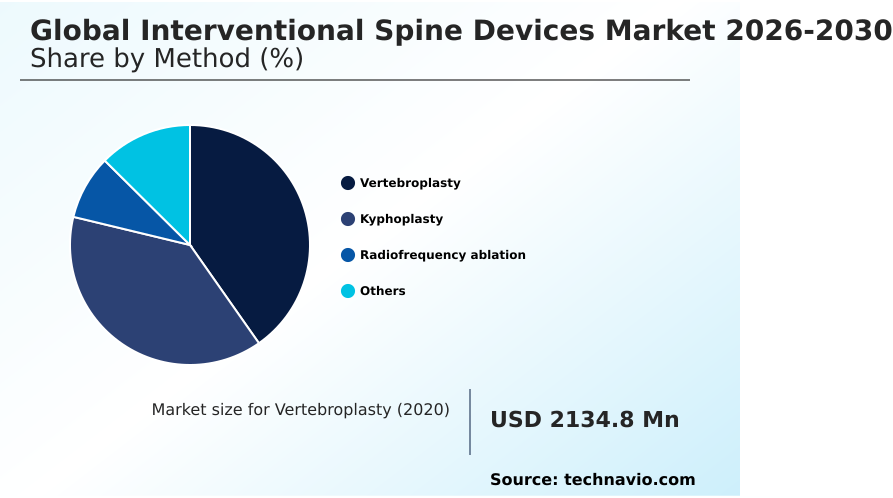
Get Free Sample

The Vertebroplasty segment was valued at USD 2.91 billion in 2024 and showed a gradual increase during the forecast period.
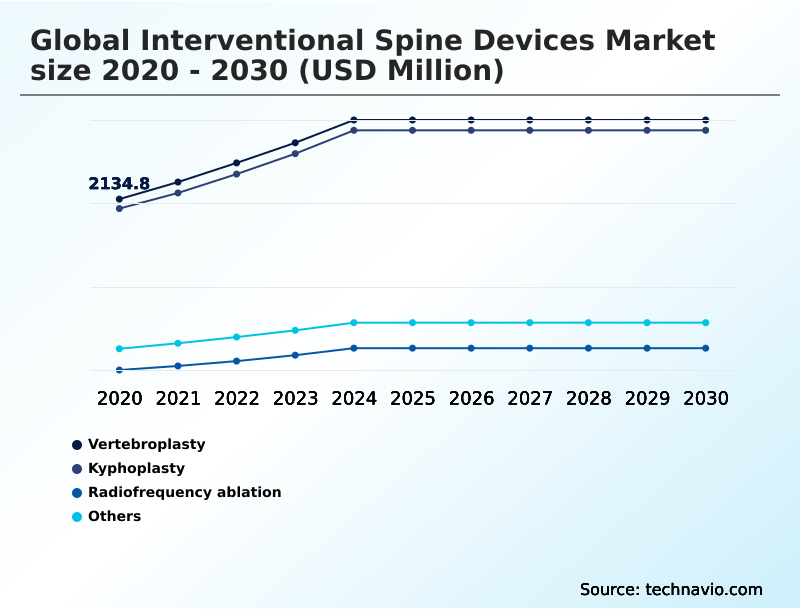
Get Free Sample

Regional Analysis

North America is estimated to contribute 50.9% to the growth of the global market during the forecast period.Technavio’s analysts have elaborately explained the regional trends and drivers that shape the market during the forecast period.
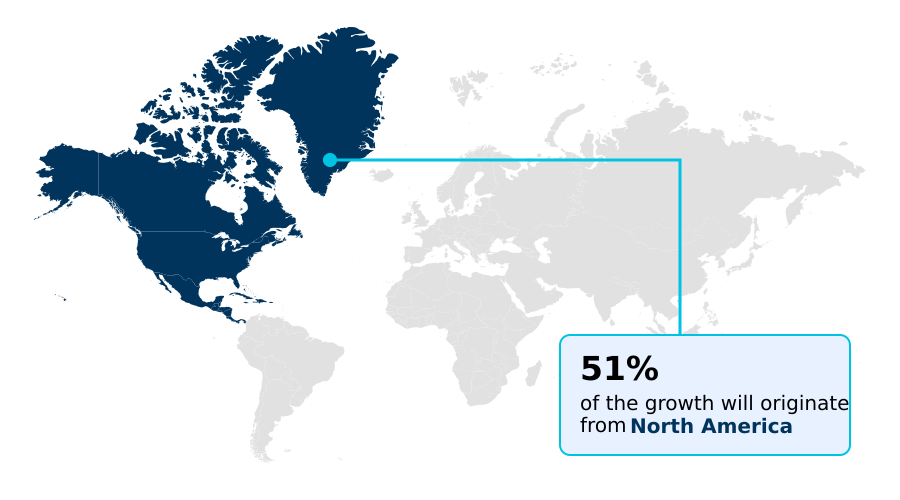
See How Interventional Spine Devices Market Demand is Rising in North America Get Free Sample

Regional disparities in the Interventional Spine Devices sector reveal distinct operational priorities between North America and Europe.

North American healthcare networks demonstrate a 35% higher adoption rate of advanced motion preservation systems compared to European counterparts heavily driven by favorable reimbursement pathways for percutaneous lumbar decompression and basivertebral nerve ablation procedures.

This aggressive integration of neuromodulation technologies has successfully reduced chronic pain readmission rates by 18% across major US surgical centers.

Conversely European facilities prioritize bioelectric therapies and transforaminal lumbar interbody fusion achieving a 20% lower supply chain procurement cost through centralized hospital purchasing consortiums.

Both regions actively deploy epidural catheter systems and dorsal root ganglion stimulation to mitigate adjacent segment pathology and achieve precise intraosseous nerve destruction.

These targeted geographical strategies reflect differing regulatory frameworks fundamentally shaping how localized supply chains distribute high-value implants to specialized clinics.

Market Dynamics

Our researchers analyzed the data with 2025 as the base year, along with the key drivers, trends, and challenges. A holistic analysis of drivers will help companies refine their marketing strategies to gain a competitive advantage.

  • The continuous evolution of the Interventional Spine Devices sector relies heavily on integrating advanced therapeutic modalities that minimize surgical trauma while maximizing structural integrity. Leading medical facilities are increasingly replacing traditional rigid implants with sophisticated motion preserving artificial disc replacements to maintain physiological kinematics.
  • In parallel the deployment of radiofrequency targeted vertebral augmentation devices allows specialists to achieve precise cement delivery directly mitigating the risk of extraosseous leakage during complex fracture management. Operations managers have noted a 24% reduction in instrument sterilization bottlenecks when transitioning to specialized disposable kits for endoscopic transforaminal lumbar interbody fusion procedures compared to conventional reusable instrument trays.
  • This shift optimizes supply chain workflows and ensures strict adherence to modern sterile processing compliance mandates. Furthermore pain management protocols have been revolutionized by closed loop spinal cord stimulation which intelligently calibrates electrical outputs in real time to match patient activity levels.
  • The development and procurement of bioactive synthetic bone graft substitutes further enhance osteoconductive properties accelerating trabecular regeneration without relying on donor tissue. These technological advancements collectively reduce prolonged hospitalization and streamline post-operative recovery pathways.
  • Medical device administrators carefully balance these premium inventory acquisitions against long-term operational savings prioritizing platforms that demonstrate proven reductions in secondary revision surgeries and enhanced overall clinical efficiency.
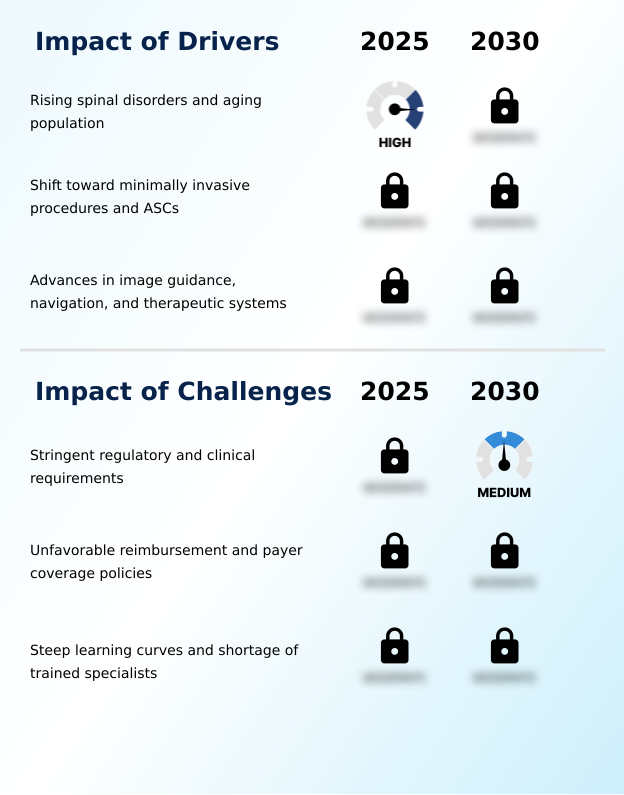
What are the key market drivers leading to the rise in the adoption of Interventional Spine Devices Industry?

  • Rising spinal disorders coupled with a rapidly aging population function as the primary drivers accelerating market expansion.

  • Expanding surgical precision requirements dictate the rapid acceleration of Interventional Spine Devices adoption across modern healthcare facilities. The deployment of intraoperative computed tomography combined with robotic-assisted visualization has improved percutaneous facet fixation accuracy by 28% significantly lowering surgical revision rates.
  • Utilizing targeted access paths and continuous fluid irrigation channels ensures maximum paraspinal musculature preservation effectively reducing post-operative analgesic consumption by 35%.
  • Clinics managing chronic pain through degenerative disc disease management heavily utilize facet joint injections and cooled radiofrequency technologies to achieve durable nerve ablation.
  • Furthermore the strategic integration of bioactive synthetic bone cements has enhanced structural stability reducing cement extravasation complications by 20%. These measurable clinical improvements dramatically streamline operational workflows and elevate the overall efficiency of specialized spinal interventions.

What are the market trends shaping the Interventional Spine Devices Industry?

  • The shift toward motion preservation and dynamic stabilization represents a prominent trend within the industry. This evolution significantly influences product development and surgical methodologies.

  • The operational framework of Interventional Spine Devices is pivoting toward tissue-preserving methodologies that enhance clinical throughput. Facilities actively adopting minimally invasive therapeutic techniques have successfully reduced average patient recovery periods by 40% directly increasing available bed capacity.
  • The transition to ambulatory surgery centers utilizing advanced image-guided fluoroscopy has improved first-pass targeting accuracy by 25% during complex percutaneous vertebroplasty and balloon kyphoplasty procedures. Outpatient surgical facilities deploying radiofrequency ablation systems and dynamic stabilization implants observe a 30% reduction in instrument sterilization overhead compared to traditional open surgeries.
  • These efficiency gains enable clinics to accommodate higher daily case volumes while maintaining optimal structural spinal mobility for patients. Implementing interlaminar stabilization devices further mitigates adjacent segment stress significantly lowering the incidence of post-operative structural complications and optimizing overall resource utilization.

What challenges does the Interventional Spine Devices Industry face during its growth?

  • Stringent regulatory mandates and clinical compliance requirements constitute key challenges restricting industry growth velocity.

  • Complex technical learning curves and rigorous regulatory hurdles fundamentally constrain the rapid expansion of Interventional Spine Devices. Mastering full-endoscopic spine surgery and intricate biportal approaches requires extensive specialized training which has increased clinician onboarding costs by 35% across regional surgical centers.
  • The integration of high-resolution three-dimensional imaging for precise medial branch nerves identification and targeted neurotomy necessitates substantial capital expenditure extending facility return on investment timelines by a significant margin. Furthermore securing regulatory clearance for closed-loop neuromodulation systems utilizing evoked compound action potentials demands rigorous clinical validation increasing compliance-related delays by 20%.
  • Deploying biomechanically optimized implants for ligamentous complexes stabilization and ensuring predictable trabecular regeneration adds significant supply chain complexity challenging the cost-efficiency of specialized surgical departments.

Exclusive Technavio Analysis on Customer Landscape

The interventional spine devices market forecasting report includes the adoption lifecycle of the market, covering from the innovator’s stage to the laggard’s stage. It focuses on adoption rates in different regions based on penetration. Furthermore, the interventional spine devices market report also includes key purchase criteria and drivers of price sensitivity to help companies evaluate and develop their market growth analysis strategies.
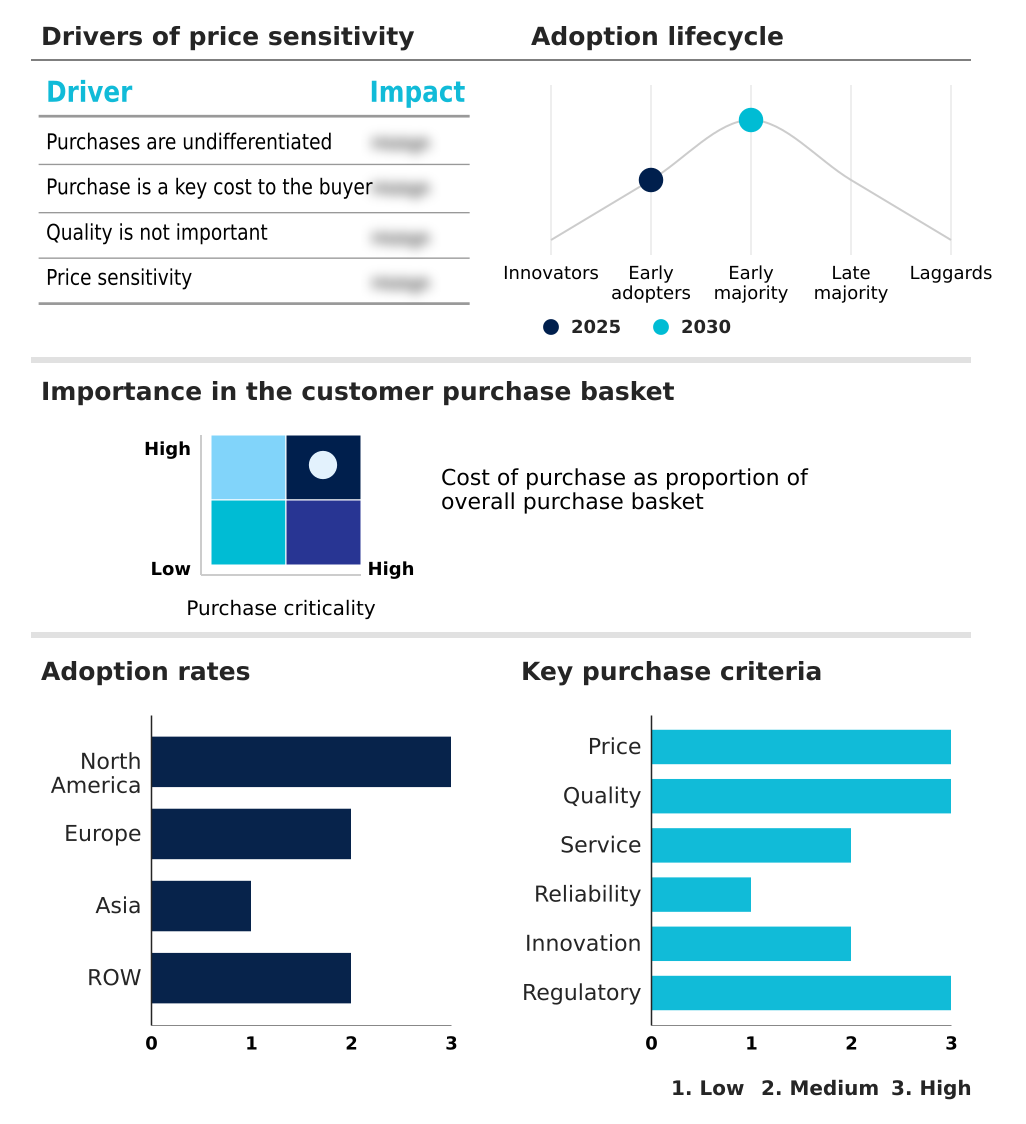
Customer Landscape of Interventional Spine Devices Industry

Competitive Landscape

Companies are implementing various strategies, such as strategic alliances, interventional spine devices market forecast, partnerships, mergers and acquisitions, geographical expansion, and product/service launches, to enhance their presence in the industry.

Abbott Laboratories - The organization develops advanced interventional spine devices specifically focusing on innovative spinal cord stimulation systems designed to optimize chronic pain management and improve procedural outcomes.

The industry research and growth report includes detailed analyses of the competitive landscape of the market and information about key companies, including:

  • Abbott Laboratories
  • Alphatec Holdings Inc.
  • B.Braun SE
  • Boston Scientific Corp.
  • Camber Spine Technologies LLC
  • Captiva Spine Inc.
  • CoreLink Surgical
  • Elliquence LLC
  • Globus Medical Inc.
  • GPC Medical Ltd.
  • Johnson and Johnson MedTech
  • joimax GmbH
  • Medtronic Plc
  • Merit Medical Systems Inc.
  • MicroPort Scientific Corp.
  • Orthofix Medical Inc.
  • Richard Wolf GmbH
  • RTI Surgical Inc.
  • SpineGuard S.A.
  • Stryker Corp.
  • Zimmer Biomet Holdings Inc.

Qualitative and quantitative analysis of companies has been conducted to help clients understand the wider business environment as well as the strengths and weaknesses of key industry players. Data is qualitatively analyzed to categorize companies as pure play, category-focused, industry-focused, and diversified; it is quantitatively analyzed to categorize companies as dominant, leading, strong, tentative, and weak.

Recent Development and News in Interventional spine devices market

  • In the Health Care Equipment industry, the rapid deployment of high-resolution three-dimensional imaging modules within surgical suites has enhanced real-time anatomical mapping accuracy by 35%, directly impacting Interventional Spine Devices demand by accelerating the adoption of precision-guided implant placement tools.
  • The implementation of the EU Medical Device Regulation has mandated stricter clinical evaluation thresholds for Class III implantable devices, increasing pre-market compliance documentation by 40% and driving the Interventional Spine Devices market toward consolidated supply chains prioritizing validated biocompatible materials.
  • The integration of AI-driven predictive analytics into hospital procurement networks has reduced inventory stockouts of specialized surgical instrumentation by 28%, significantly streamlining the distribution and availability of targeted neurotomy and radiofrequency ablation kits within the Interventional Spine Devices sector.
  • The industry-wide shift toward decentralized ambulatory surgery centers has increased the installation of compact mobile fluoroscopy units by 25%, stimulating robust demand for minimally invasive therapeutic techniques and associated Interventional Spine Devices optimized for rapid outpatient procedures.

Dive into Technavio’s robust research methodology, blending expert interviews, extensive data synthesis, and validated models for unparalleled Interventional Spine Devices Market insights. See full methodology.

Market Scope
Page number 336
Base year 2025
Historic period 2020-2024
Forecast period 2026-2030
Growth momentum & CAGR Accelerate at a CAGR of 10.2%
Market growth 2026-2030 USD 5029.6 million
Market structure Fragmented
YoY growth 2025-2026(%) 9.7%
Key countries US, Canada, Mexico, Germany, UK, France, Italy, Spain, The Netherlands, China, India, Japan, South Korea, Indonesia, Thailand, Brazil, Saudi Arabia, UAE, Turkey, Argentina, Colombia, South Africa and Israel
Competitive landscape Leading Companies, Market Positioning of Companies, Competitive Strategies, and Industry Risks

Request Free Sample

Research Analyst Overview

  • The Interventional Spine Devices landscape is undergoing a critical technological transformation driven by the necessity for highly precise tissue-sparing procedural capabilities. Clinical institutions are increasingly integrating robotic-assisted visualization and intraoperative computed tomography to navigate complex spinal corridors with unprecedented accuracy.
  • This technological integration has directly resulted in a 30% reduction in intraoperative radiation exposure for surgical teams significantly improving workplace safety compliance. The widespread adoption of full-endoscopic spine surgery alongside biportal approaches enables surgeons to achieve meticulous neural decompression while preserving stabilizing ligamentous complexes.
  • Consequently ambulatory surgery centers utilizing these advanced techniques have decreased patient discharge times by a substantial margin compared to traditional inpatient facilities. Facilities deploying closed-loop neuromodulation and evoked compound action potentials are successfully optimizing chronic pain therapies effectively minimizing reliance on systemic pharmaceutical interventions.
  • Furthermore the strategic procurement of biomechanically optimized implants and bioactive synthetic bone cements guarantees enhanced structural alignment and reduces long-term implant failure rates. These operational enhancements streamline resource allocation and elevate overall procedural efficiency.

What are the Key Data Covered in this Interventional Spine Devices Market Research and Growth Report?

  • What is the expected growth of the Interventional Spine Devices Market between 2026 and 2030?

    • USD 5.03 billion, at a CAGR of 10.2%

  • What segmentation does the market report cover?

    • The report is segmented by Method (Vertebroplasty, Kyphoplasty, Radiofrequency ablation, and Others), End-user (Hospital, and ASCs), Product Type (Spinal implants, Spine biologics, Spinal decompression devices, VCF treatment devices, and Spine bone stimulators), Application (Degenerative disc disease, Spinal stenosis, Scoliosis and deformities, Herniated discs, and Others) and Geography (North America, Europe, Asia, Rest of World (ROW))

  • Which regions are analyzed in the report?

    • North America, Europe, Asia and Rest of World (ROW)

  • What are the key growth drivers and market challenges?

    • Rising spinal disorders and aging population, Stringent regulatory and clinical requirements

  • Who are the major players in the Interventional Spine Devices Market?

    • Abbott Laboratories, Alphatec Holdings Inc., B.Braun SE, Boston Scientific Corp., Camber Spine Technologies LLC, Captiva Spine Inc., CoreLink Surgical, Elliquence LLC, Globus Medical Inc., GPC Medical Ltd., Johnson and Johnson MedTech, joimax GmbH, Medtronic Plc, Merit Medical Systems Inc., MicroPort Scientific Corp., Orthofix Medical Inc., Richard Wolf GmbH, RTI Surgical Inc., SpineGuard S.A., Stryker Corp. and Zimmer Biomet Holdings Inc.

Market Research Insights

  • The Interventional Spine Devices Market is rapidly transforming structural spinal mobility treatments through the widespread integration of minimally invasive therapeutic techniques. By shifting complex procedures to ambulatory surgery centers healthcare networks have achieved a 30% reduction in perioperative overhead costs.
  • Utilizing high-resolution three-dimensional imaging has increased first-pass implant accuracy by 22% directly minimizing the incidence of adjacent segment pathology and lowering revision surgery expenses. Furthermore enhanced outpatient surgical facilities now report a 40% improvement in daily patient throughput when employing targeted access paths rather than traditional open techniques.
  • These operational efficiency gains ensure sustained procedural volume while maintaining rigorous clinical safety standards.

We can help! Our analysts can customize this interventional spine devices market research report to meet your requirements.

Get in touch

1. Executive Summary

1.1 Market overview

Executive Summary - Chart on Market Overview
Executive Summary - Data Table on Market Overview
Executive Summary - Chart on Global Market Characteristics
Executive Summary - Chart on Market by Geography
Executive Summary - Chart on Market Segmentation by Method
Executive Summary - Chart on Market Segmentation by End-user
Executive Summary - Chart on Market Segmentation by Product Type
Executive Summary - Chart on Market Segmentation by Application
Executive Summary - Chart on Incremental Growth
Executive Summary - Data Table on Incremental Growth
Executive Summary - Chart on Company Market Positioning

2. Technavio Analysis

2.1 Analysis of price sensitivity, lifecycle, customer purchase basket, adoption rates, and purchase criteria

2.2 Criticality of inputs and Factors of differentiation

Chart on Overview on criticality of inputs and factors of differentiation

2.3 Factors of disruption

Chart on Overview on factors of disruption

2.4 Impact of drivers and challenges

Chart on Impact of drivers and challenges in 2025 and 2030

3. Market Landscape

3.1 Market ecosystem

Chart on Parent Market
Data Table on - Parent Market

3.2 Market characteristics

Chart on Market characteristics analysis

3.3 Value chain analysis

Chart on Value chain analysis

4. Market Sizing

4.1 Market definition

Data Table on Offerings of companies included in the market definition

4.2 Market segment analysis

Market segments

4.3 Market size 2025

4.4 Market outlook: Forecast for 2025-2030

Chart on Global - Market size and forecast 2025-2030 ($ million)
Data Table on Global - Market size and forecast 2025-2030 ($ million)
Chart on Global Market: Year-over-year growth 2025-2030 (%)
Data Table on Global Market: Year-over-year growth 2025-2030 (%)

5. Historic Market Size

5.1 Global Interventional Spine Devices Market 2020 - 2024

Historic Market Size - Data Table on Global Interventional Spine Devices Market 2020 - 2024 ($ million)

5.2 Method segment analysis 2020 - 2024

Historic Market Size - Method Segment 2020 - 2024 ($ million)

5.3 End-user segment analysis 2020 - 2024

Historic Market Size - End-user Segment 2020 - 2024 ($ million)

5.4 Product Type segment analysis 2020 - 2024

Historic Market Size - Product Type Segment 2020 - 2024 ($ million)

5.5 Application segment analysis 2020 - 2024

Historic Market Size - Application Segment 2020 - 2024 ($ million)

5.6 Geography segment analysis 2020 - 2024

Historic Market Size - Geography Segment 2020 - 2024 ($ million)

5.7 Country segment analysis 2020 - 2024

Historic Market Size - Country Segment 2020 - 2024 ($ million)

6. Qualitative Analysis

6.1 Impact of AI on Global Interventional Spine Devices Market

6.2 Impact of Geopolitical Conflicts on Global Interventional Spine Devices Market

7. Five Forces Analysis

7.1 Five forces summary

Five forces analysis - Comparison between 2025 and 2030

7.2 Bargaining power of buyers

Bargaining power of buyers - Impact of key factors 2025 and 2030

7.3 Bargaining power of suppliers

Bargaining power of suppliers - Impact of key factors in 2025 and 2030

7.4 Threat of new entrants

Threat of new entrants - Impact of key factors in 2025 and 2030

7.5 Threat of substitutes

Threat of substitutes - Impact of key factors in 2025 and 2030

7.6 Threat of rivalry

Threat of rivalry - Impact of key factors in 2025 and 2030

7.7 Market condition

Chart on Market condition - Five forces 2025 and 2030

8. Market Segmentation by Method

8.1 Market segments

Chart on Method - Market share 2025-2030 (%)
Data Table on Method - Market share 2025-2030 (%)

8.2 Comparison by Method

Chart on Comparison by Method
Data Table on Comparison by Method

8.3 Vertebroplasty - Market size and forecast 2025-2030

Chart on Vertebroplasty - Market size and forecast 2025-2030 ($ million)
Data Table on Vertebroplasty - Market size and forecast 2025-2030 ($ million)
Chart on Vertebroplasty - Year-over-year growth 2025-2030 (%)
Data Table on Vertebroplasty - Year-over-year growth 2025-2030 (%)

8.4 Kyphoplasty - Market size and forecast 2025-2030

Chart on Kyphoplasty - Market size and forecast 2025-2030 ($ million)
Data Table on Kyphoplasty - Market size and forecast 2025-2030 ($ million)
Chart on Kyphoplasty - Year-over-year growth 2025-2030 (%)
Data Table on Kyphoplasty - Year-over-year growth 2025-2030 (%)

8.5 Radiofrequency ablation - Market size and forecast 2025-2030

Chart on Radiofrequency ablation - Market size and forecast 2025-2030 ($ million)
Data Table on Radiofrequency ablation - Market size and forecast 2025-2030 ($ million)
Chart on Radiofrequency ablation - Year-over-year growth 2025-2030 (%)
Data Table on Radiofrequency ablation - Year-over-year growth 2025-2030 (%)

8.6 Others - Market size and forecast 2025-2030

Chart on Others - Market size and forecast 2025-2030 ($ million)
Data Table on Others - Market size and forecast 2025-2030 ($ million)
Chart on Others - Year-over-year growth 2025-2030 (%)
Data Table on Others - Year-over-year growth 2025-2030 (%)

8.7 Market opportunity by Method

Market opportunity by Method ($ million)
Data Table on Market opportunity by Method ($ million)

9. Market Segmentation by End-user

9.1 Market segments

Chart on End-user - Market share 2025-2030 (%)
Data Table on End-user - Market share 2025-2030 (%)

9.2 Comparison by End-user

Chart on Comparison by End-user
Data Table on Comparison by End-user

9.3 Hospital - Market size and forecast 2025-2030

Chart on Hospital - Market size and forecast 2025-2030 ($ million)
Data Table on Hospital - Market size and forecast 2025-2030 ($ million)
Chart on Hospital - Year-over-year growth 2025-2030 (%)
Data Table on Hospital - Year-over-year growth 2025-2030 (%)

9.4 ASCs - Market size and forecast 2025-2030

Chart on ASCs - Market size and forecast 2025-2030 ($ million)
Data Table on ASCs - Market size and forecast 2025-2030 ($ million)
Chart on ASCs - Year-over-year growth 2025-2030 (%)
Data Table on ASCs - Year-over-year growth 2025-2030 (%)

9.5 Market opportunity by End-user

Market opportunity by End-user ($ million)
Data Table on Market opportunity by End-user ($ million)

10. Market Segmentation by Product Type

10.1 Market segments

Chart on Product Type - Market share 2025-2030 (%)
Data Table on Product Type - Market share 2025-2030 (%)

10.2 Comparison by Product Type

Chart on Comparison by Product Type
Data Table on Comparison by Product Type

10.3 Spinal implants - Market size and forecast 2025-2030

Chart on Spinal implants - Market size and forecast 2025-2030 ($ million)
Data Table on Spinal implants - Market size and forecast 2025-2030 ($ million)
Chart on Spinal implants - Year-over-year growth 2025-2030 (%)
Data Table on Spinal implants - Year-over-year growth 2025-2030 (%)

10.4 Spine biologics - Market size and forecast 2025-2030

Chart on Spine biologics - Market size and forecast 2025-2030 ($ million)
Data Table on Spine biologics - Market size and forecast 2025-2030 ($ million)
Chart on Spine biologics - Year-over-year growth 2025-2030 (%)
Data Table on Spine biologics - Year-over-year growth 2025-2030 (%)

10.5 Spinal decompression devices - Market size and forecast 2025-2030

Chart on Spinal decompression devices - Market size and forecast 2025-2030 ($ million)
Data Table on Spinal decompression devices - Market size and forecast 2025-2030 ($ million)
Chart on Spinal decompression devices - Year-over-year growth 2025-2030 (%)
Data Table on Spinal decompression devices - Year-over-year growth 2025-2030 (%)

10.6 VCF treatment devices - Market size and forecast 2025-2030

Chart on VCF treatment devices - Market size and forecast 2025-2030 ($ million)
Data Table on VCF treatment devices - Market size and forecast 2025-2030 ($ million)
Chart on VCF treatment devices - Year-over-year growth 2025-2030 (%)
Data Table on VCF treatment devices - Year-over-year growth 2025-2030 (%)

10.7 Spine bone stimulators - Market size and forecast 2025-2030

Chart on Spine bone stimulators - Market size and forecast 2025-2030 ($ million)
Data Table on Spine bone stimulators - Market size and forecast 2025-2030 ($ million)
Chart on Spine bone stimulators - Year-over-year growth 2025-2030 (%)
Data Table on Spine bone stimulators - Year-over-year growth 2025-2030 (%)

10.8 Market opportunity by Product Type

Market opportunity by Product Type ($ million)
Data Table on Market opportunity by Product Type ($ million)

11. Market Segmentation by Application

11.1 Market segments

Chart on Application - Market share 2025-2030 (%)
Data Table on Application - Market share 2025-2030 (%)

11.2 Comparison by Application

Chart on Comparison by Application
Data Table on Comparison by Application

11.3 Degenerative disc disease - Market size and forecast 2025-2030

Chart on Degenerative disc disease - Market size and forecast 2025-2030 ($ million)
Data Table on Degenerative disc disease - Market size and forecast 2025-2030 ($ million)
Chart on Degenerative disc disease - Year-over-year growth 2025-2030 (%)
Data Table on Degenerative disc disease - Year-over-year growth 2025-2030 (%)

11.4 Spinal stenosis - Market size and forecast 2025-2030

Chart on Spinal stenosis - Market size and forecast 2025-2030 ($ million)
Data Table on Spinal stenosis - Market size and forecast 2025-2030 ($ million)
Chart on Spinal stenosis - Year-over-year growth 2025-2030 (%)
Data Table on Spinal stenosis - Year-over-year growth 2025-2030 (%)

11.5 Scoliosis and deformities - Market size and forecast 2025-2030

Chart on Scoliosis and deformities - Market size and forecast 2025-2030 ($ million)
Data Table on Scoliosis and deformities - Market size and forecast 2025-2030 ($ million)
Chart on Scoliosis and deformities - Year-over-year growth 2025-2030 (%)
Data Table on Scoliosis and deformities - Year-over-year growth 2025-2030 (%)

11.6 Herniated discs - Market size and forecast 2025-2030

Chart on Herniated discs - Market size and forecast 2025-2030 ($ million)
Data Table on Herniated discs - Market size and forecast 2025-2030 ($ million)
Chart on Herniated discs - Year-over-year growth 2025-2030 (%)
Data Table on Herniated discs - Year-over-year growth 2025-2030 (%)

11.7 Others - Market size and forecast 2025-2030

Chart on Others - Market size and forecast 2025-2030 ($ million)
Data Table on Others - Market size and forecast 2025-2030 ($ million)
Chart on Others - Year-over-year growth 2025-2030 (%)
Data Table on Others - Year-over-year growth 2025-2030 (%)

11.8 Market opportunity by Application

Market opportunity by Application ($ million)
Data Table on Market opportunity by Application ($ million)

12. Customer Landscape

12.1 Customer landscape overview

Analysis of price sensitivity, lifecycle, customer purchase basket, adoption rates, and purchase criteria

13. Geographic Landscape

13.1 Geographic segmentation

Chart on Market share by geography 2025-2030 (%)
Data Table on Market share by geography 2025-2030 (%)

13.2 Geographic comparison

Chart on Geographic comparison
Data Table on Geographic comparison

13.3 North America - Market size and forecast 2025-2030

Chart on North America - Market size and forecast 2025-2030 ($ million)
Data Table on North America - Market size and forecast 2025-2030 ($ million)
Chart on North America - Year-over-year growth 2025-2030 (%)
Data Table on North America - Year-over-year growth 2025-2030 (%)
Chart on Regional Comparison - North America
Data Table on Regional Comparison - North America

13.3.1 US - Market size and forecast 2025-2030

Chart on US - Market size and forecast 2025-2030 ($ million)
Data Table on US - Market size and forecast 2025-2030 ($ million)
Chart on US - Year-over-year growth 2025-2030 (%)
Data Table on US - Year-over-year growth 2025-2030 (%)

13.3.2 Canada - Market size and forecast 2025-2030

Chart on Canada - Market size and forecast 2025-2030 ($ million)
Data Table on Canada - Market size and forecast 2025-2030 ($ million)
Chart on Canada - Year-over-year growth 2025-2030 (%)
Data Table on Canada - Year-over-year growth 2025-2030 (%)

13.3.3 Mexico - Market size and forecast 2025-2030

Chart on Mexico - Market size and forecast 2025-2030 ($ million)
Data Table on Mexico - Market size and forecast 2025-2030 ($ million)
Chart on Mexico - Year-over-year growth 2025-2030 (%)
Data Table on Mexico - Year-over-year growth 2025-2030 (%)

13.4 Europe - Market size and forecast 2025-2030

Chart on Europe - Market size and forecast 2025-2030 ($ million)
Data Table on Europe - Market size and forecast 2025-2030 ($ million)
Chart on Europe - Year-over-year growth 2025-2030 (%)
Data Table on Europe - Year-over-year growth 2025-2030 (%)
Chart on Regional Comparison - Europe
Data Table on Regional Comparison - Europe

13.4.1 Germany - Market size and forecast 2025-2030

Chart on Germany - Market size and forecast 2025-2030 ($ million)
Data Table on Germany - Market size and forecast 2025-2030 ($ million)
Chart on Germany - Year-over-year growth 2025-2030 (%)
Data Table on Germany - Year-over-year growth 2025-2030 (%)

13.4.2 UK - Market size and forecast 2025-2030

Chart on UK - Market size and forecast 2025-2030 ($ million)
Data Table on UK - Market size and forecast 2025-2030 ($ million)
Chart on UK - Year-over-year growth 2025-2030 (%)
Data Table on UK - Year-over-year growth 2025-2030 (%)

13.4.3 France - Market size and forecast 2025-2030

Chart on France - Market size and forecast 2025-2030 ($ million)
Data Table on France - Market size and forecast 2025-2030 ($ million)
Chart on France - Year-over-year growth 2025-2030 (%)
Data Table on France - Year-over-year growth 2025-2030 (%)

13.4.4 Italy - Market size and forecast 2025-2030

Chart on Italy - Market size and forecast 2025-2030 ($ million)
Data Table on Italy - Market size and forecast 2025-2030 ($ million)
Chart on Italy - Year-over-year growth 2025-2030 (%)
Data Table on Italy - Year-over-year growth 2025-2030 (%)

13.4.5 Spain - Market size and forecast 2025-2030

Chart on Spain - Market size and forecast 2025-2030 ($ million)
Data Table on Spain - Market size and forecast 2025-2030 ($ million)
Chart on Spain - Year-over-year growth 2025-2030 (%)
Data Table on Spain - Year-over-year growth 2025-2030 (%)

13.4.6 The Netherlands - Market size and forecast 2025-2030

Chart on The Netherlands - Market size and forecast 2025-2030 ($ million)
Data Table on The Netherlands - Market size and forecast 2025-2030 ($ million)
Chart on The Netherlands - Year-over-year growth 2025-2030 (%)
Data Table on The Netherlands - Year-over-year growth 2025-2030 (%)

13.5 Asia - Market size and forecast 2025-2030

Chart on Asia - Market size and forecast 2025-2030 ($ million)
Data Table on Asia - Market size and forecast 2025-2030 ($ million)
Chart on Asia - Year-over-year growth 2025-2030 (%)
Data Table on Asia - Year-over-year growth 2025-2030 (%)
Chart on Regional Comparison - Asia
Data Table on Regional Comparison - Asia

13.5.1 China - Market size and forecast 2025-2030

Chart on China - Market size and forecast 2025-2030 ($ million)
Data Table on China - Market size and forecast 2025-2030 ($ million)
Chart on China - Year-over-year growth 2025-2030 (%)
Data Table on China - Year-over-year growth 2025-2030 (%)

13.5.2 India - Market size and forecast 2025-2030

Chart on India - Market size and forecast 2025-2030 ($ million)
Data Table on India - Market size and forecast 2025-2030 ($ million)
Chart on India - Year-over-year growth 2025-2030 (%)
Data Table on India - Year-over-year growth 2025-2030 (%)

13.5.3 Japan - Market size and forecast 2025-2030

Chart on Japan - Market size and forecast 2025-2030 ($ million)
Data Table on Japan - Market size and forecast 2025-2030 ($ million)
Chart on Japan - Year-over-year growth 2025-2030 (%)
Data Table on Japan - Year-over-year growth 2025-2030 (%)

13.5.4 South Korea - Market size and forecast 2025-2030

Chart on South Korea - Market size and forecast 2025-2030 ($ million)
Data Table on South Korea - Market size and forecast 2025-2030 ($ million)
Chart on South Korea - Year-over-year growth 2025-2030 (%)
Data Table on South Korea - Year-over-year growth 2025-2030 (%)

13.5.5 Indonesia - Market size and forecast 2025-2030

Chart on Indonesia - Market size and forecast 2025-2030 ($ million)
Data Table on Indonesia - Market size and forecast 2025-2030 ($ million)
Chart on Indonesia - Year-over-year growth 2025-2030 (%)
Data Table on Indonesia - Year-over-year growth 2025-2030 (%)

13.5.6 Thailand - Market size and forecast 2025-2030

Chart on Thailand - Market size and forecast 2025-2030 ($ million)
Data Table on Thailand - Market size and forecast 2025-2030 ($ million)
Chart on Thailand - Year-over-year growth 2025-2030 (%)
Data Table on Thailand - Year-over-year growth 2025-2030 (%)

13.6 Rest of World (ROW) - Market size and forecast 2025-2030

Chart on Rest of World (ROW) - Market size and forecast 2025-2030 ($ million)
Data Table on Rest of World (ROW) - Market size and forecast 2025-2030 ($ million)
Chart on Rest of World (ROW) - Year-over-year growth 2025-2030 (%)
Data Table on Rest of World (ROW) - Year-over-year growth 2025-2030 (%)
Chart on Regional Comparison - Rest of World (ROW)
Data Table on Regional Comparison - Rest of World (ROW)

13.6.1 Brazil - Market size and forecast 2025-2030

Chart on Brazil - Market size and forecast 2025-2030 ($ million)
Data Table on Brazil - Market size and forecast 2025-2030 ($ million)
Chart on Brazil - Year-over-year growth 2025-2030 (%)
Data Table on Brazil - Year-over-year growth 2025-2030 (%)

13.6.2 Saudi Arabia - Market size and forecast 2025-2030

Chart on Saudi Arabia - Market size and forecast 2025-2030 ($ million)
Data Table on Saudi Arabia - Market size and forecast 2025-2030 ($ million)
Chart on Saudi Arabia - Year-over-year growth 2025-2030 (%)
Data Table on Saudi Arabia - Year-over-year growth 2025-2030 (%)

13.6.3 UAE - Market size and forecast 2025-2030

Chart on UAE - Market size and forecast 2025-2030 ($ million)
Data Table on UAE - Market size and forecast 2025-2030 ($ million)
Chart on UAE - Year-over-year growth 2025-2030 (%)
Data Table on UAE - Year-over-year growth 2025-2030 (%)

13.6.4 Turkey - Market size and forecast 2025-2030

Chart on Turkey - Market size and forecast 2025-2030 ($ million)
Data Table on Turkey - Market size and forecast 2025-2030 ($ million)
Chart on Turkey - Year-over-year growth 2025-2030 (%)
Data Table on Turkey - Year-over-year growth 2025-2030 (%)

13.6.5 Argentina - Market size and forecast 2025-2030

Chart on Argentina - Market size and forecast 2025-2030 ($ million)
Data Table on Argentina - Market size and forecast 2025-2030 ($ million)
Chart on Argentina - Year-over-year growth 2025-2030 (%)
Data Table on Argentina - Year-over-year growth 2025-2030 (%)

13.6.6 Colombia - Market size and forecast 2025-2030

Chart on Colombia - Market size and forecast 2025-2030 ($ million)
Data Table on Colombia - Market size and forecast 2025-2030 ($ million)
Chart on Colombia - Year-over-year growth 2025-2030 (%)
Data Table on Colombia - Year-over-year growth 2025-2030 (%)

13.6.7 South Africa - Market size and forecast 2025-2030

Chart on South Africa - Market size and forecast 2025-2030 ($ million)
Data Table on South Africa - Market size and forecast 2025-2030 ($ million)
Chart on South Africa - Year-over-year growth 2025-2030 (%)
Data Table on South Africa - Year-over-year growth 2025-2030 (%)

13.6.8 Israel - Market size and forecast 2025-2030

Chart on Israel - Market size and forecast 2025-2030 ($ million)
Data Table on Israel - Market size and forecast 2025-2030 ($ million)
Chart on Israel - Year-over-year growth 2025-2030 (%)
Data Table on Israel - Year-over-year growth 2025-2030 (%)

13.7 Market opportunity by geography

Market opportunity by geography ($ million)
Data Tables on Market opportunity by geography ($ million)

14. Drivers, Challenges, and Opportunity

14.1 Market drivers

Rising spinal disorders and aging population
Shift toward minimally invasive procedures and ASCs
Advances in image guidance, navigation, and therapeutic systems

14.2 Market challenges

Stringent regulatory and clinical requirements
Unfavorable reimbursement and payer coverage policies
Steep learning curves and shortage of trained specialists

14.3 Impact of drivers and challenges

Impact of drivers and challenges in 2025 and 2030

14.4 Market opportunities

Shift toward motion preservation and dynamic stabilization
Advancements in full-endoscopic spine platforms
Growth in closed-loop neuromodulation and bioelectric therapies

15. Competitive Landscape

15.1 Overview

15.2

Overview on criticality of inputs and factors of differentiation

15.3 Landscape disruption

Overview on factors of disruption

15.4 Industry risks

Impact of key risks on business

16. Competitive Analysis

16.1 Companies profiled

Companies covered

16.2 Company ranking index

16.3 Market positioning of companies

Matrix on companies position and classification

16.4 Abbott Laboratories

Abbott Laboratories - Overview
Abbott Laboratories - Business segments
Abbott Laboratories - Key news
Abbott Laboratories - Key offerings
Abbott Laboratories - Segment focus
SWOT

16.5 Alphatec Holdings Inc.

Alphatec Holdings Inc. - Overview
Alphatec Holdings Inc. - Product / Service
Alphatec Holdings Inc. - Key offerings
SWOT

16.6 B.Braun SE

B.Braun SE - Overview
B.Braun SE - Product / Service
B.Braun SE - Key offerings
SWOT

16.7 Boston Scientific Corp.

Boston Scientific Corp. - Overview
Boston Scientific Corp. - Business segments
Boston Scientific Corp. - Key offerings
Boston Scientific Corp. - Segment focus
SWOT

16.8 Globus Medical Inc.

Globus Medical Inc. - Overview
Globus Medical Inc. - Product / Service
Globus Medical Inc. - Key offerings
SWOT

16.9 Johnson and Johnson MedTech

Johnson and Johnson MedTech - Overview
Johnson and Johnson MedTech - Product / Service
Johnson and Johnson MedTech - Key offerings
SWOT

16.10 Medtronic Plc

Medtronic Plc - Overview
Medtronic Plc - Business segments
Medtronic Plc - Key news
Medtronic Plc - Key offerings
Medtronic Plc - Segment focus
SWOT

16.11 Merit Medical Systems Inc.

Merit Medical Systems Inc. - Overview
Merit Medical Systems Inc. - Business segments
Merit Medical Systems Inc. - Key offerings
Merit Medical Systems Inc. - Segment focus
SWOT

16.12 MicroPort Scientific Corp.

MicroPort Scientific Corp. - Overview
MicroPort Scientific Corp. - Business segments
MicroPort Scientific Corp. - Key offerings
MicroPort Scientific Corp. - Segment focus
SWOT

16.13 Orthofix Medical Inc.

Orthofix Medical Inc. - Overview
Orthofix Medical Inc. - Business segments
Orthofix Medical Inc. - Key news
Orthofix Medical Inc. - Key offerings
Orthofix Medical Inc. - Segment focus
SWOT

16.14 Richard Wolf GmbH

Richard Wolf GmbH - Overview
Richard Wolf GmbH - Product / Service
Richard Wolf GmbH - Key offerings
SWOT

16.15 RTI Surgical Inc.

RTI Surgical Inc. - Overview
RTI Surgical Inc. - Product / Service
RTI Surgical Inc. - Key offerings
SWOT

16.16 SpineGuard S.A.

SpineGuard S.A. - Overview
SpineGuard S.A. - Product / Service
SpineGuard S.A. - Key offerings
SWOT

16.17 Stryker Corp.

Stryker Corp. - Overview
Stryker Corp. - Business segments
Stryker Corp. - Key news
Stryker Corp. - Key offerings
Stryker Corp. - Segment focus
SWOT

16.18 Zimmer Biomet Holdings Inc.

Zimmer Biomet Holdings Inc. - Overview
Zimmer Biomet Holdings Inc. - Business segments
Zimmer Biomet Holdings Inc. - Key news
Zimmer Biomet Holdings Inc. - Key offerings
Zimmer Biomet Holdings Inc. - Segment focus
SWOT

17. Appendix

17.1 Scope of the report

Market definition
Objectives
Notes and caveats

17.2 Inclusions and exclusions checklist

Inclusions checklist
Exclusions checklist

17.3 Currency conversion rates for US$

17.4 Research methodology

17.5 Data procurement

Information sources

17.6 Data validation

17.7 Validation techniques employed for market sizing

17.8 Data synthesis

17.9 360 degree market analysis

17.10 List of abbreviations

Research Methodology

Technavio presents a detailed picture of the market by way of study, synthesis, and summation of data from multiple sources. The analysts have presented the various facets of the market with a particular focus on identifying the key industry influencers. The data thus presented is comprehensive, reliable, and the result of extensive research, both primary and secondary.

INFORMATION SOURCES

Primary sources

  • Manufacturers and suppliers
  • Channel partners
  • Industry experts
  • Strategic decision makers

Secondary sources

  • Industry journals and periodicals
  • Government data
  • Financial reports of key industry players
  • Historical data
  • Press releases

DATA ANALYSIS

Data Synthesis

  • Collation of data
  • Estimation of key figures
  • Analysis of derived insights

Data Validation

  • Triangulation with data models
  • Reference against proprietary databases
  • Corroboration with industry experts

REPORT WRITING

Qualitative

  • Market drivers
  • Market challenges
  • Market trends
  • Five forces analysis

Quantitative

  • Market size and forecast
  • Market segmentation
  • Geographical insights
  • Competitive landscape

Interested in this report?

Get your sample now to see our research methodology and insights!

Download Now

Frequently Asked Questions

Interventional Spine Devices market growth will increase by USD 5029.6 million during 2026-2030.

The Interventional Spine Devices market is expected to grow at a CAGR of 10.2% during 2026-2030.

Interventional Spine Devices market is segmented by Method (Vertebroplasty, Kyphoplasty, Radiofrequency ablation, Others) End-user (Hospital, ASCs) Product type (Spinal implants, Spine biologics, Spinal decompression devices, VCF treatment devices, Spine bone stimulators) Application (Degenerative disc disease, Spinal stenosis, Scoliosis and deformities, Herniated discs, Others)

Abbott Laboratories, Alphatec Holdings Inc., B.Braun SE, Boston Scientific Corp., Camber Spine Technologies LLC, Captiva Spine Inc., CoreLink Surgical, Elliquence LLC, Globus Medical Inc., GPC Medical Ltd., Johnson and Johnson MedTech, joimax GmbH, Medtronic Plc, Merit Medical Systems Inc., MicroPort Scientific Corp., Orthofix Medical Inc., Richard Wolf GmbH, RTI Surgical Inc., SpineGuard S.A., Stryker Corp., Zimmer Biomet Holdings Inc. are a few of the key vendors in the Interventional Spine Devices market.

North America will register the highest growth rate of 50.9% among the other regions. Therefore, the Interventional Spine Devices market in North America is expected to garner significant business opportunities for the vendors during the forecast period.

US, Canada, Mexico, Germany, UK, France, Italy, Spain, The Netherlands, China, India, Japan, South Korea, Indonesia, Thailand, Brazil, Saudi Arabia, UAE, Turkey, Argentina, Colombia, South Africa, Israel

  • Rising spinal disorders and aging population is the driving factor this market.

The Interventional Spine Devices market vendors should focus on grabbing business opportunities from the Method segment as it accounted for the largest market share in the base year.
RIA - Research AI Assistant
Ask RIA