Integrated Circuits Market Analysis, Size, and Forecast 2026-2030: APAC (China, South Korea, and India), North America (US, Canada, and Mexico), Europe (Germany, France, and UK), South America (Brazil and Argentina), Middle East and Africa (Saudi Arabia, UAE, and South Africa), and Rest of World (ROW)

Integrated Circuits Market Analysis, Size, and Forecast 2026-2030:
APAC (China, South Korea, and India), North America (US, Canada, and Mexico), Europe (Germany, France, and UK), South America (Brazil and Argentina), Middle East and Africa (Saudi Arabia, UAE, and South Africa), and Rest of World (ROW)

Published: May 2026 315 Pages SKU: IRTNTR81471

Market Overview at a Glance

$242.10 B
Market Opportunity
7.7%
CAGR 2025 - 2030
62.1%
APAC Growth
$307.80 B
General-purpose ICs segment 2024

Integrated Circuits Market Size 2026-2030

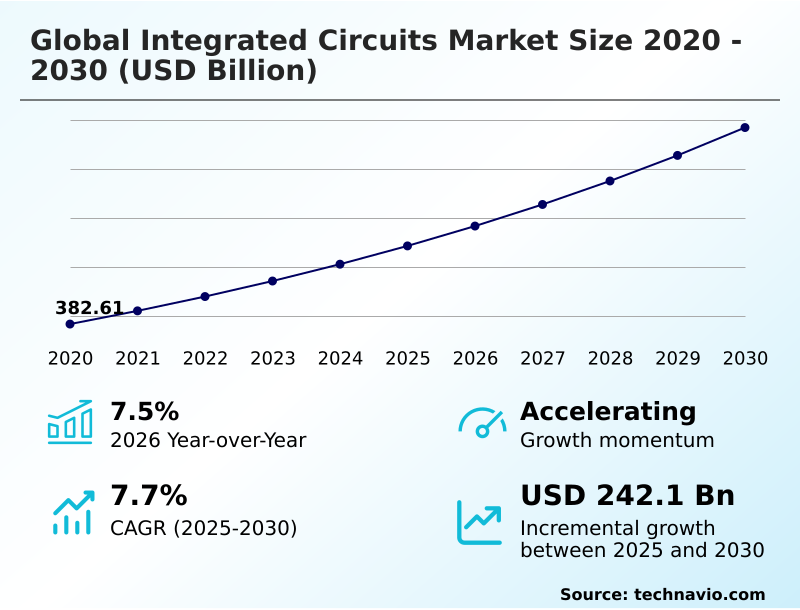
The integrated circuits market size is valued to increase by USD 242.10 billion, at a CAGR of 7.7% from 2025 to 2030. Proliferation of generative AI and large language models will drive the integrated circuits market.

Major Market Trends & Insights

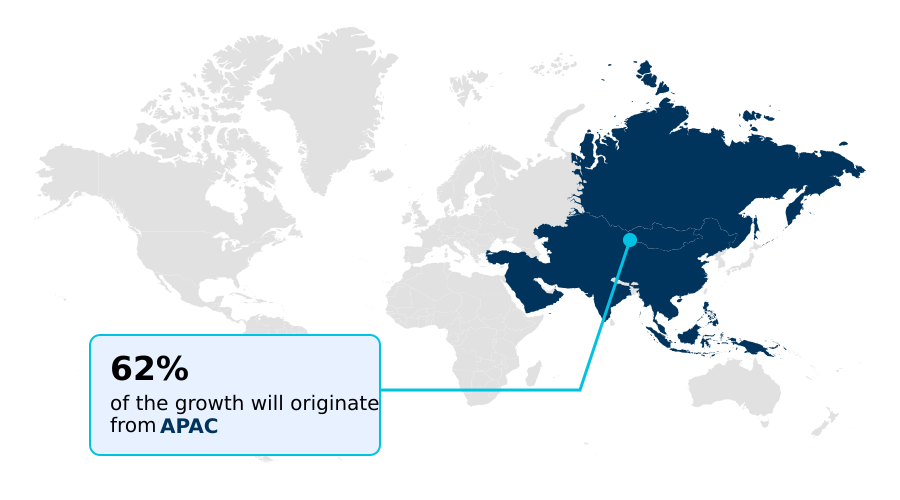
  • APAC dominated the market and accounted for a 62.1% growth during the forecast period.
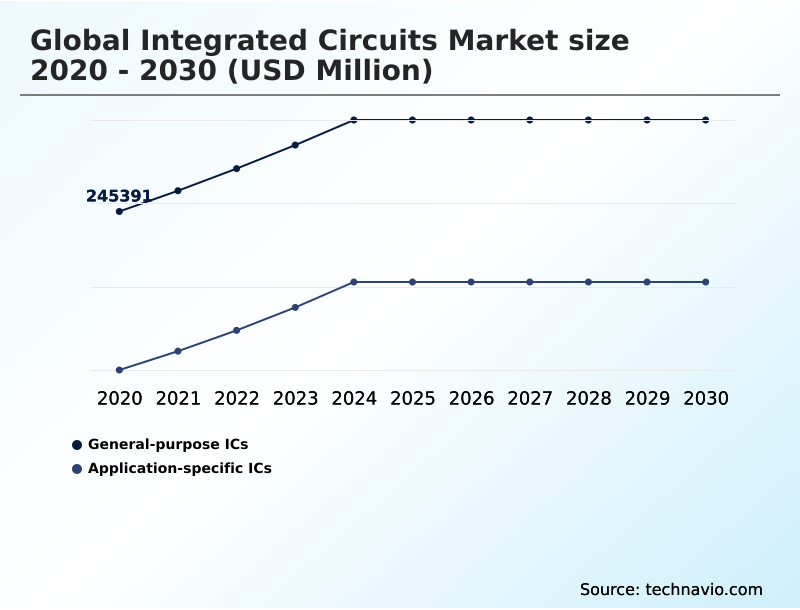
  • By Type - General-purpose ICs segment was valued at USD 307.80 billion in 2024
  • By Product - Logic ICs segment accounted for the largest market revenue share in 2024

Market Size & Forecast

  • Market Opportunities: USD 401.95 billion
  • Market Future Opportunities: USD 242.10 billion
  • CAGR from 2025 to 2030 : 7.7%

Market Summary

  • The integrated circuits market is the bedrock of the digital economy, defined by the relentless pursuit of greater computational power and efficiency. This sector is propelled by the explosive growth of generative AI and the increasing semiconductor content in modern vehicles.
  • The industry is currently navigating a pivotal shift from monolithic scaling toward heterogeneous integration, where advanced packaging and chiplet architectures are becoming standard for high-performance applications. For example, an automotive OEM might develop a custom application-specific integrated circuit to manage sensor fusion in its autonomous driving systems, achieving real-time processing with significantly lower latency than general-purpose chips.
  • However, the benefits of such custom silicon development are tempered by the challenges of geopolitical fragmentation, which disrupts established supply chains and complicates long-term capital investments in wafer fabrication.
  • As a result, companies are re-evaluating their manufacturing footprints to ensure resilience, balancing the efficiencies of a globalized system with the need for secure, localized production of critical logic devices and memory units. This dynamic environment requires a strategic approach to semiconductor design and sourcing.

What will be the Size of the Integrated Circuits Market during the forecast period?

Get Key Insights on Market Forecast (PDF) Get Free Sample

How is the Integrated Circuits Market Segmented?

The integrated circuits industry research report provides comprehensive data (region-wise segment analysis), with forecasts and estimates in "USD million" for the period 2026-2030, as well as historical data from 2020-2024 for the following segments.

  • Type
    • General-purpose ICs
    • Application-specific ICs
  • Product
    • Logic ICs
    • Memory ICs
    • Analog ICs
    • Micro components
    • Mixed-signal ICs
  • End-user
    • Consumer electronics
    • Data centers
    • Automotive
    • Industrial
    • Others
  • Geography
    • APAC
      • China
      • South Korea
      • India
    • North America
      • US
      • Canada
      • Mexico
    • Europe
      • Germany
      • France
      • UK
    • South America
      • Brazil
      • Argentina
    • Middle East and Africa
      • Saudi Arabia
      • UAE
      • South Africa
    • Rest of World (ROW)

By Type Insights

The general-purpose ics segment is estimated to witness significant growth during the forecast period.

General-purpose integrated circuits are foundational components in the electronics industry, designed for broad applicability across numerous end-user sectors. These standardized products, including power management ics and low-power microcontrollers, are crucial for both industrial control systems and consumer electronics.

The value proposition is rooted in cost-effectiveness and wide availability, enabling their use in everything from industrial sensors to home appliances. Manufacturers are focusing on advanced process technology to improve performance and supply chain resilience.

For instance, leveraging advanced photolithography for a digital signal controller can enable a 30% increase in processing speed for predictive maintenance applications.

This evolution reflects an industry-wide trend of stabilizing the supply of general-purpose silicon through diversified fabrication and foundry services to meet global demand.

Get Free Sample

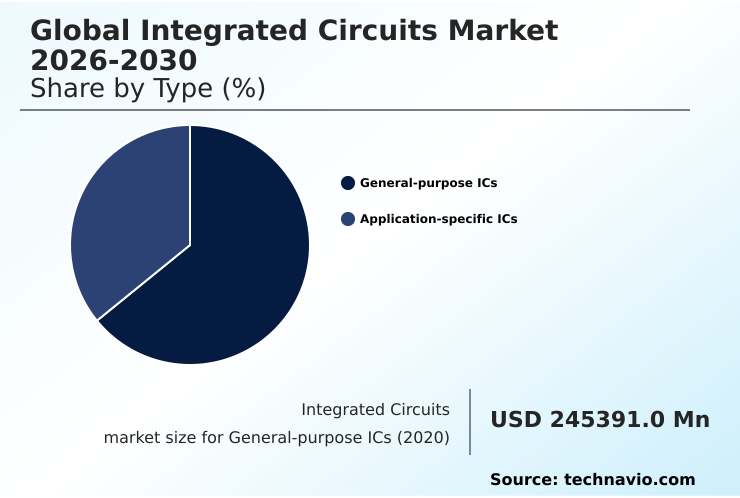
The General-purpose ICs segment was valued at USD 307.80 billion in 2024 and showed a gradual increase during the forecast period.

Get Free Sample

Regional Analysis

APAC is estimated to contribute 62.1% to the growth of the global market during the forecast period.Technavio’s analysts have elaborately explained the regional trends and drivers that shape the market during the forecast period.

See How Integrated Circuits Market Demand is Rising in APAC Get Free Sample

The geographic landscape is dominated by the APAC region, which accounts for over 62% of the market's incremental growth, driven by its massive concentration of advanced semiconductor foundry services.

In contrast, North America, while growing at a slightly slower pace, remains the epicenter of fabless semiconductor design and intellectual property protection.

The European market is heavily influenced by its strong industrial automation and automotive sectors, creating robust demand for specialized microelectromechanical systems and power semiconductors.

Recent investments in regional wafer fabrication facilities have improved wafer yield efficiency by up to 15%, reducing dependence on external suppliers.

This regionalization is a direct response to supply chain vulnerabilities, creating a more distributed but complex global network for components like radio frequency components and analog-to-digital converters.

Market Dynamics

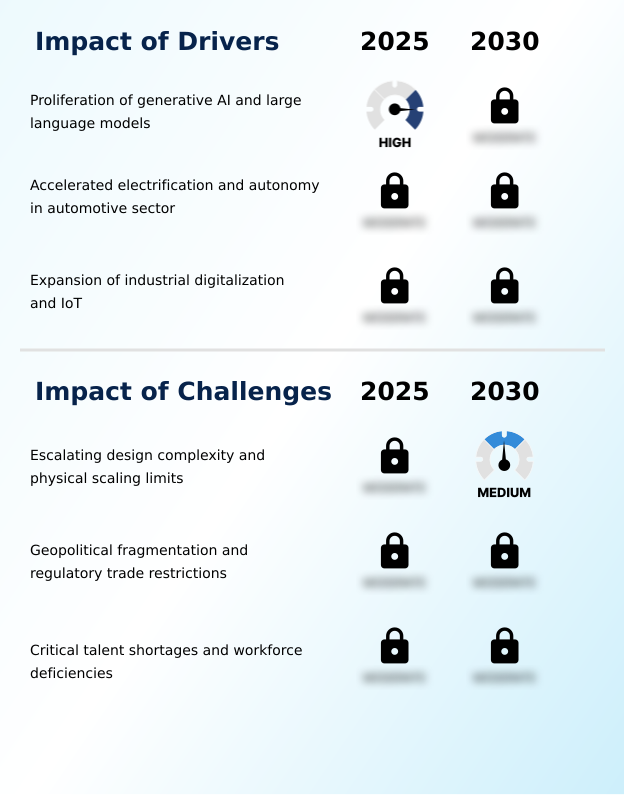
Our researchers analyzed the data with 2025 as the base year, along with the key drivers, trends, and challenges. A holistic analysis of drivers will help companies refine their marketing strategies to gain a competitive advantage.

  • The global integrated circuits market 2026-2030 is undergoing a profound transformation where long-term strategy must address multiple interconnected factors. The Global Integrated Circuits Market 2026-2030 generative AI impact is reshaping hardware requirements, demanding unprecedented computational power and pushing the adoption of Global Integrated Circuits Market 2026-2030 high bandwidth memory role.
  • Simultaneously, the Global Integrated Circuits Market 2026-2030 automotive sector integration is accelerating, driven by the rising Global Integrated Circuits Market 2026-2030 electric vehicle semiconductor content, which is nearly double that of conventional vehicles. This trend, along with Global Integrated Circuits Market 2026-2030 industrial digitalization trends, necessitates new approaches to chip design and manufacturing.
  • However, Global Integrated Circuits Market 2026-2030 escalating design complexity and the challenges of Global Integrated Circuits Market 2026-2030 angstrom era fabrication challenges remain significant hurdles. These technical issues are compounded by Global Integrated Circuits Market 2026-2030 geopolitical trade restrictions, compelling companies to focus on Global Integrated Circuits Market 2026-2030 supply chain resilience strategies.
  • Mitigating these risks requires investment in both Global Integrated Circuits Market 2026-2030 advanced packaging innovations and diversifying manufacturing locations. Firms that proactively manage Global Integrated Circuits Market 2026-2030 talent shortage mitigation and embrace Global Integrated Circuits Market 2026-2030 sustainable manufacturing practices are better positioned for sustained growth in this complex environment.

What are the key market drivers leading to the rise in the adoption of Integrated Circuits Industry?

  • The proliferation of generative AI and large language models serves as the primary driver for the integrated circuits market.

  • Growth is primarily fueled by the computational demands of generative AI and large language models, which necessitate a massive build-out of data center infrastructure equipped with specialized hardware.
  • The automotive industry's rapid transition to electric vehicles and advanced driver-assistance systems is another major driver, with the semiconductor content in a modern EV being more than double that of a traditional internal combustion engine vehicle.
  • This has created a surge in demand for power management ICs and secure connectivity chips. Furthermore, the ongoing digitalization of industries, or Industry 4.0, is leading to the deployment of billions of internet of things devices.
  • This expansion of edge computing and the rollout of 5G network expansion require a vast array of low-power microcontrollers, sensors, and wireless communication chips to enable real-time data processing and industrial automation.

What are the market trends shaping the Integrated Circuits Industry?

  • The dominance of heterogeneous integration and advanced packaging architectures is a significant upcoming trend. It is reshaping the industry by enabling more powerful and efficient system-on-chip designs.

  • Key market trends are centered on overcoming the physical limits of traditional semiconductor scaling. The move toward heterogeneous integration is paramount, with chiplet architectures enabling yield improvements of over 15% compared to large monolithic designs. This modular approach, supported by advanced packaging techniques like wafer-level packaging, allows for the combination of different process technologies in a single system-on-chip.
  • Concurrently, the rise of domain-specific architectures is driven by the need for optimized hardware; custom silicon development for AI applications can achieve up to 50% greater power efficiency than general-purpose processors. This trend is facilitated by open-source instruction sets and advanced electronic design automation tools.
  • A third major trend is the focus on sustainable manufacturing, pushing the industry to adopt circular economy principles and reduce its environmental footprint through energy-efficient designs and responsible semiconductor materials sourcing.

What challenges does the Integrated Circuits Industry face during its growth?

  • Escalating design complexity and approaching physical scaling limits present a key challenge affecting industry growth.

  • The industry faces significant challenges, led by the escalating design complexity and cost of angstrom-era fabrication, where designing a single advanced chip can cost ten times more than a decade ago. Physical scaling limits are forcing a move to complex structures like gate-all-around transistors, which require immense capital expenditure.
  • A second major challenge is the increasing geopolitical fragmentation of the semiconductor supply chain. Trade restrictions and national security concerns are disrupting the efficient global flow of semiconductor materials and equipment, forcing costly duplication of infrastructure. Finally, a critical semiconductor talent shortage persists across the entire value chain.
  • In some regions, open engineering roles outnumber qualified graduates by a ratio of nearly 3-to-1, threatening to slow the pace of innovation in vital areas like analog design and advanced wafer fabrication.

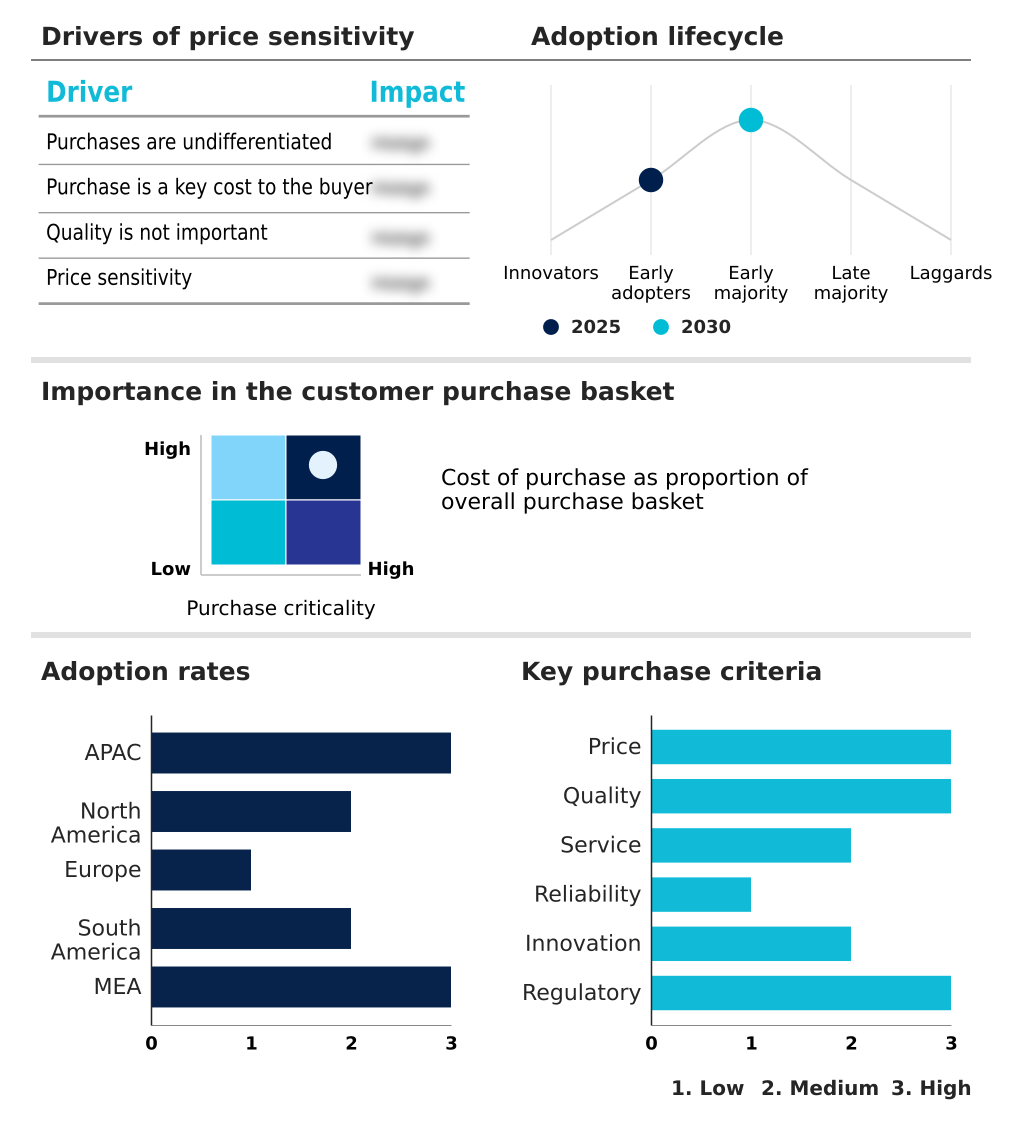
Exclusive Technavio Analysis on Customer Landscape

The integrated circuits market forecasting report includes the adoption lifecycle of the market, covering from the innovator’s stage to the laggard’s stage. It focuses on adoption rates in different regions based on penetration. Furthermore, the integrated circuits market report also includes key purchase criteria and drivers of price sensitivity to help companies evaluate and develop their market growth analysis strategies.

Customer Landscape of Integrated Circuits Industry

Competitive Landscape

Companies are implementing various strategies, such as strategic alliances, integrated circuits market forecast, partnerships, mergers and acquisitions, geographical expansion, and product/service launches, to enhance their presence in the industry.

Advanced Micro Devices Inc. - Specialized integrated circuits, including AI accelerators and microprocessors, address critical computing, automotive, and communication needs, showcasing focused innovation in high-demand sectors.

The industry research and growth report includes detailed analyses of the competitive landscape of the market and information about key companies, including:

  • Advanced Micro Devices Inc.
  • Analog Devices Inc.
  • Broadcom Inc.
  • GlobalFoundaries Inc.
  • Infineon Technologies AG
  • Intel Corp.
  • Marvell Technology Inc.
  • MediaTek Inc.
  • Microchip Technology Inc.
  • Micron Technology Inc.
  • NVIDIA Corp.
  • NXP Semiconductors NV
  • ON Semiconductor Corp.
  • Qualcomm Inc.
  • Renesas Electronics Corp.
  • Samsung Electronics Co. Ltd.
  • STMicroelectronics NV
  • Taiwan Semiconductor Co. Ltd.
  • Texas Instruments Inc.
  • Tower Semiconductor Ltd.

Qualitative and quantitative analysis of companies has been conducted to help clients understand the wider business environment as well as the strengths and weaknesses of key industry players. Data is qualitatively analyzed to categorize companies as pure play, category-focused, industry-focused, and diversified; it is quantitatively analyzed to categorize companies as dominant, leading, strong, tentative, and weak.

Recent Development and News in Integrated circuits market

  • In May, 2025, Intel Corp. announced the successful high-volume production of its next-generation 14A process node, integrating PowerVia backside power delivery to enhance AI performance-per-watt by over 20%.
  • In March, 2025, NVIDIA Corp. and Google Cloud entered a multi-billion dollar strategic partnership to develop a new generation of custom AI inference accelerators, aiming to reduce the total cost of ownership for large language models.
  • In January, 2025, The European Commission announced the first round of funding under the European Chips Act, allocating EUR 5 billion to support the construction of two new leading-edge semiconductor foundries in Germany and France.
  • In September, 2024, Texas Instruments Inc. completed its acquisition of a specialized silicon carbide (SiC) wafer manufacturer for USD 2.5 billion, securing a critical part of its supply chain for electric vehicle power electronics.

Dive into Technavio’s robust research methodology, blending expert interviews, extensive data synthesis, and validated models for unparalleled Integrated Circuits Market insights. See full methodology.

Market Scope
Page number 315
Base year 2025
Historic period 2020-2024
Forecast period 2026-2030
Growth momentum & CAGR Accelerate at a CAGR of 7.7%
Market growth 2026-2030 USD 242099.4 million
Market structure Fragmented
YoY growth 2025-2026(%) 7.5%
Key countries China, South Korea, Taiwan, India, Australia, Singapore, US, Canada, Mexico, Germany, France, UK, Italy, The Netherlands, Spain, Brazil, Argentina, Chile, Saudi Arabia, UAE, South Africa, Israel and Turkey
Competitive landscape Leading Companies, Market Positioning of Companies, Competitive Strategies, and Industry Risks

Request Free Sample

Research Analyst Overview

  • The integrated circuits market remains the fundamental engine of technological progress, currently undergoing a architectural revolution driven by the demands of artificial intelligence and high-performance computing. The industry is moving decisively away from monolithic scaling, embracing heterogeneous integration and advanced packaging as the primary path to performance gains.
  • This shift toward chiplet architectures and 2.5D and 3D stacking is a critical boardroom-level consideration, directly impacting capex strategies and long-term technology roadmaps. Developments in angstrom-era fabrication, including the adoption of gate-all-around transistors and backside power delivery, are enabling new levels of computational density.
  • The proliferation of wide-bandgap semiconductors like silicon carbide and gallium nitride is transforming power electronics in automotive and industrial sectors. At the same time, the reliance on extreme ultraviolet lithography and the complexity of photolithography for these advanced nodes underscore the market's high barriers to entry.
  • The entire ecosystem, from semiconductor foundry services to the design of a digital signal controller, is being reshaped by these powerful trends, reflecting a market that is both highly innovative and strategically indispensable.

What are the Key Data Covered in this Integrated Circuits Market Research and Growth Report?

  • What is the expected growth of the Integrated Circuits Market between 2026 and 2030?

    • USD 242.10 billion, at a CAGR of 7.7%

  • What segmentation does the market report cover?

    • The report is segmented by Type (General-purpose ICs, and Application-specific ICs), Product (Logic ICs, Memory ICs, Analog ICs, Micro components, and Mixed-signal ICs), End-user (Consumer electronics, Data centers, Automotive, Industrial, and Others) and Geography (APAC, North America, Europe, South America, Middle East and Africa)

  • Which regions are analyzed in the report?

    • APAC, North America, Europe, South America and Middle East and Africa

  • What are the key growth drivers and market challenges?

    • Proliferation of generative AI and large language models, Escalating design complexity and physical scaling limits

  • Who are the major players in the Integrated Circuits Market?

    • Advanced Micro Devices Inc., Analog Devices Inc., Broadcom Inc., GlobalFoundaries Inc., Infineon Technologies AG, Intel Corp., Marvell Technology Inc., MediaTek Inc., Microchip Technology Inc., Micron Technology Inc., NVIDIA Corp., NXP Semiconductors NV, ON Semiconductor Corp., Qualcomm Inc., Renesas Electronics Corp., Samsung Electronics Co. Ltd., STMicroelectronics NV, Taiwan Semiconductor Co. Ltd., Texas Instruments Inc. and Tower Semiconductor Ltd.

Market Research Insights

  • Market dynamics are increasingly shaped by the intense demand from data center infrastructure and automotive electronics, where performance and efficiency are paramount. The adoption of application-specific integrated circuits has become standard for companies seeking competitive advantages, with custom silicon development delivering performance gains of over 30% for specific workloads compared to general-purpose hardware.
  • This has spurred a surge in demand for high bandwidth memory and advanced system on chip solutions. The result has been a significant market acceleration, with monthly sales in some segments showing a 79% increase year-over-year.
  • Geographically, growth is not uniform; while North America remains a hub for semiconductor design, the APAC region is expanding its manufacturing lead at a comparatively faster rate, creating a complex and evolving global landscape for all market participants.

We can help! Our analysts can customize this integrated circuits market research report to meet your requirements.

Get in touch

1. Executive Summary

1.1 Market overview

Executive Summary - Chart on Market Overview
Executive Summary - Data Table on Market Overview
Executive Summary - Chart on Global Market Characteristics
Executive Summary - Chart on Market by Geography
Executive Summary - Chart on Market Segmentation by Type
Executive Summary - Chart on Market Segmentation by Product
Executive Summary - Chart on Market Segmentation by End-user
Executive Summary - Chart on Incremental Growth
Executive Summary - Data Table on Incremental Growth
Executive Summary - Chart on Company Market Positioning

2. Technavio Analysis

2.1 Analysis of price sensitivity, lifecycle, customer purchase basket, adoption rates, and purchase criteria

2.2 Criticality of inputs and Factors of differentiation

Chart on Overview on criticality of inputs and factors of differentiation

2.3 Factors of disruption

Chart on Overview on factors of disruption

2.4 Impact of drivers and challenges

Chart on Impact of drivers and challenges in 2025 and 2030

3. Market Landscape

3.1 Market ecosystem

Chart on Parent Market
Data Table on - Parent Market

3.2 Market characteristics

Chart on Market characteristics analysis

3.3 Value chain analysis

Chart on Value chain analysis

4. Market Sizing

4.1 Market definition

Data Table on Offerings of companies included in the market definition

4.2 Market segment analysis

Market segments

4.3 Market size 2025

4.4 Market outlook: Forecast for 2025-2030

Chart on Global - Market size and forecast 2025-2030 ($ million)
Data Table on Global - Market size and forecast 2025-2030 ($ million)
Chart on Global Market: Year-over-year growth 2025-2030 (%)
Data Table on Global Market: Year-over-year growth 2025-2030 (%)

5. Historic Market Size

5.1 Global Integrated Circuits Market 2020 - 2024

Historic Market Size - Data Table on Global Integrated Circuits Market 2020 - 2024 ($ million)

5.2 Type segment analysis 2020 - 2024

Historic Market Size - Type Segment 2020 - 2024 ($ million)

5.3 Product segment analysis 2020 - 2024

Historic Market Size - Product Segment 2020 - 2024 ($ million)

5.4 End-user segment analysis 2020 - 2024

Historic Market Size - End-user Segment 2020 - 2024 ($ million)

5.5 Geography segment analysis 2020 - 2024

Historic Market Size - Geography Segment 2020 - 2024 ($ million)

5.6 Country segment analysis 2020 - 2024

Historic Market Size - Country Segment 2020 - 2024 ($ million)

6. Qualitative Analysis

6.1 Impact of AI on global integrated circuits market

6.2 Impact of geopolitical conflicts on global integrated circuits market

7. Five Forces Analysis

7.1 Five forces summary

Five forces analysis - Comparison between 2025 and 2030

7.2 Bargaining power of buyers

Bargaining power of buyers - Impact of key factors 2025 and 2030

7.3 Bargaining power of suppliers

Bargaining power of suppliers - Impact of key factors in 2025 and 2030

7.4 Threat of new entrants

Threat of new entrants - Impact of key factors in 2025 and 2030

7.5 Threat of substitutes

Threat of substitutes - Impact of key factors in 2025 and 2030

7.6 Threat of rivalry

Threat of rivalry - Impact of key factors in 2025 and 2030

7.7 Market condition

Chart on Market condition - Five forces 2025 and 2030

8. Market Segmentation by Type

8.1 Market segments

Chart on Type - Market share 2025-2030 (%)
Data Table on Type - Market share 2025-2030 (%)

8.2 Comparison by Type

Chart on Comparison by Type
Data Table on Comparison by Type

8.3 General-purpose ICs - Market size and forecast 2025-2030

Chart on General-purpose ICs - Market size and forecast 2025-2030 ($ million)
Data Table on General-purpose ICs - Market size and forecast 2025-2030 ($ million)
Chart on General-purpose ICs - Year-over-year growth 2025-2030 (%)
Data Table on General-purpose ICs - Year-over-year growth 2025-2030 (%)

8.4 Application-specific ICs - Market size and forecast 2025-2030

Chart on Application-specific ICs - Market size and forecast 2025-2030 ($ million)
Data Table on Application-specific ICs - Market size and forecast 2025-2030 ($ million)
Chart on Application-specific ICs - Year-over-year growth 2025-2030 (%)
Data Table on Application-specific ICs - Year-over-year growth 2025-2030 (%)

8.5 Market opportunity by Type

Market opportunity by Type ($ million)
Data Table on Market opportunity by Type ($ million)

9. Market Segmentation by Product

9.1 Market segments

Chart on Product - Market share 2025-2030 (%)
Data Table on Product - Market share 2025-2030 (%)

9.2 Comparison by Product

Chart on Comparison by Product
Data Table on Comparison by Product

9.3 Logic ICs - Market size and forecast 2025-2030

Chart on Logic ICs - Market size and forecast 2025-2030 ($ million)
Data Table on Logic ICs - Market size and forecast 2025-2030 ($ million)
Chart on Logic ICs - Year-over-year growth 2025-2030 (%)
Data Table on Logic ICs - Year-over-year growth 2025-2030 (%)

9.4 Memory ICs - Market size and forecast 2025-2030

Chart on Memory ICs - Market size and forecast 2025-2030 ($ million)
Data Table on Memory ICs - Market size and forecast 2025-2030 ($ million)
Chart on Memory ICs - Year-over-year growth 2025-2030 (%)
Data Table on Memory ICs - Year-over-year growth 2025-2030 (%)

9.5 Analog ICs - Market size and forecast 2025-2030

Chart on Analog ICs - Market size and forecast 2025-2030 ($ million)
Data Table on Analog ICs - Market size and forecast 2025-2030 ($ million)
Chart on Analog ICs - Year-over-year growth 2025-2030 (%)
Data Table on Analog ICs - Year-over-year growth 2025-2030 (%)

9.6 Micro components - Market size and forecast 2025-2030

Chart on Micro components - Market size and forecast 2025-2030 ($ million)
Data Table on Micro components - Market size and forecast 2025-2030 ($ million)
Chart on Micro components - Year-over-year growth 2025-2030 (%)
Data Table on Micro components - Year-over-year growth 2025-2030 (%)

9.7 Mixed-signal ICs - Market size and forecast 2025-2030

Chart on Mixed-signal ICs - Market size and forecast 2025-2030 ($ million)
Data Table on Mixed-signal ICs - Market size and forecast 2025-2030 ($ million)
Chart on Mixed-signal ICs - Year-over-year growth 2025-2030 (%)
Data Table on Mixed-signal ICs - Year-over-year growth 2025-2030 (%)

9.8 Market opportunity by Product

Market opportunity by Product ($ million)
Data Table on Market opportunity by Product ($ million)

10. Market Segmentation by End-user

10.1 Market segments

Chart on End-user - Market share 2025-2030 (%)
Data Table on End-user - Market share 2025-2030 (%)

10.2 Comparison by End-user

Chart on Comparison by End-user
Data Table on Comparison by End-user

10.3 Consumer electronics - Market size and forecast 2025-2030

Chart on Consumer electronics - Market size and forecast 2025-2030 ($ million)
Data Table on Consumer electronics - Market size and forecast 2025-2030 ($ million)
Chart on Consumer electronics - Year-over-year growth 2025-2030 (%)
Data Table on Consumer electronics - Year-over-year growth 2025-2030 (%)

10.4 Data centers - Market size and forecast 2025-2030

Chart on Data centers - Market size and forecast 2025-2030 ($ million)
Data Table on Data centers - Market size and forecast 2025-2030 ($ million)
Chart on Data centers - Year-over-year growth 2025-2030 (%)
Data Table on Data centers - Year-over-year growth 2025-2030 (%)

10.5 Automotive - Market size and forecast 2025-2030

Chart on Automotive - Market size and forecast 2025-2030 ($ million)
Data Table on Automotive - Market size and forecast 2025-2030 ($ million)
Chart on Automotive - Year-over-year growth 2025-2030 (%)
Data Table on Automotive - Year-over-year growth 2025-2030 (%)

10.6 Industrial - Market size and forecast 2025-2030

Chart on Industrial - Market size and forecast 2025-2030 ($ million)
Data Table on Industrial - Market size and forecast 2025-2030 ($ million)
Chart on Industrial - Year-over-year growth 2025-2030 (%)
Data Table on Industrial - Year-over-year growth 2025-2030 (%)

10.7 Others - Market size and forecast 2025-2030

Chart on Others - Market size and forecast 2025-2030 ($ million)
Data Table on Others - Market size and forecast 2025-2030 ($ million)
Chart on Others - Year-over-year growth 2025-2030 (%)
Data Table on Others - Year-over-year growth 2025-2030 (%)

10.8 Market opportunity by End-user

Market opportunity by End-user ($ million)
Data Table on Market opportunity by End-user ($ million)

11. Customer Landscape

11.1 Customer landscape overview

Analysis of price sensitivity, lifecycle, customer purchase basket, adoption rates, and purchase criteria

12. Geographic Landscape

12.1 Geographic segmentation

Chart on Market share by geography 2025-2030 (%)
Data Table on Market share by geography 2025-2030 (%)

12.2 Geographic comparison

Chart on Geographic comparison
Data Table on Geographic comparison

12.3 APAC - Market size and forecast 2025-2030

Chart on APAC - Market size and forecast 2025-2030 ($ million)
Data Table on APAC - Market size and forecast 2025-2030 ($ million)
Chart on APAC - Year-over-year growth 2025-2030 (%)
Data Table on APAC - Year-over-year growth 2025-2030 (%)
Chart on Regional Comparison - APAC
Data Table on Regional Comparison - APAC

12.3.1 China - Market size and forecast 2025-2030

Chart on China - Market size and forecast 2025-2030 ($ million)
Data Table on China - Market size and forecast 2025-2030 ($ million)
Chart on China - Year-over-year growth 2025-2030 (%)
Data Table on China - Year-over-year growth 2025-2030 (%)

12.3.2 South Korea - Market size and forecast 2025-2030

Chart on South Korea - Market size and forecast 2025-2030 ($ million)
Data Table on South Korea - Market size and forecast 2025-2030 ($ million)
Chart on South Korea - Year-over-year growth 2025-2030 (%)
Data Table on South Korea - Year-over-year growth 2025-2030 (%)

12.3.3 Taiwan - Market size and forecast 2025-2030

Chart on Taiwan - Market size and forecast 2025-2030 ($ million)
Data Table on Taiwan - Market size and forecast 2025-2030 ($ million)
Chart on Taiwan - Year-over-year growth 2025-2030 (%)
Data Table on Taiwan - Year-over-year growth 2025-2030 (%)

12.3.4 India - Market size and forecast 2025-2030

Chart on India - Market size and forecast 2025-2030 ($ million)
Data Table on India - Market size and forecast 2025-2030 ($ million)
Chart on India - Year-over-year growth 2025-2030 (%)
Data Table on India - Year-over-year growth 2025-2030 (%)

12.3.5 Australia - Market size and forecast 2025-2030

Chart on Australia - Market size and forecast 2025-2030 ($ million)
Data Table on Australia - Market size and forecast 2025-2030 ($ million)
Chart on Australia - Year-over-year growth 2025-2030 (%)
Data Table on Australia - Year-over-year growth 2025-2030 (%)

12.3.6 Singapore - Market size and forecast 2025-2030

Chart on Singapore - Market size and forecast 2025-2030 ($ million)
Data Table on Singapore - Market size and forecast 2025-2030 ($ million)
Chart on Singapore - Year-over-year growth 2025-2030 (%)
Data Table on Singapore - Year-over-year growth 2025-2030 (%)

12.4 North America - Market size and forecast 2025-2030

Chart on North America - Market size and forecast 2025-2030 ($ million)
Data Table on North America - Market size and forecast 2025-2030 ($ million)
Chart on North America - Year-over-year growth 2025-2030 (%)
Data Table on North America - Year-over-year growth 2025-2030 (%)
Chart on Regional Comparison - North America
Data Table on Regional Comparison - North America

12.4.1 US - Market size and forecast 2025-2030

Chart on US - Market size and forecast 2025-2030 ($ million)
Data Table on US - Market size and forecast 2025-2030 ($ million)
Chart on US - Year-over-year growth 2025-2030 (%)
Data Table on US - Year-over-year growth 2025-2030 (%)

12.4.2 Canada - Market size and forecast 2025-2030

Chart on Canada - Market size and forecast 2025-2030 ($ million)
Data Table on Canada - Market size and forecast 2025-2030 ($ million)
Chart on Canada - Year-over-year growth 2025-2030 (%)
Data Table on Canada - Year-over-year growth 2025-2030 (%)

12.4.3 Mexico - Market size and forecast 2025-2030

Chart on Mexico - Market size and forecast 2025-2030 ($ million)
Data Table on Mexico - Market size and forecast 2025-2030 ($ million)
Chart on Mexico - Year-over-year growth 2025-2030 (%)
Data Table on Mexico - Year-over-year growth 2025-2030 (%)

12.5 Europe - Market size and forecast 2025-2030

Chart on Europe - Market size and forecast 2025-2030 ($ million)
Data Table on Europe - Market size and forecast 2025-2030 ($ million)
Chart on Europe - Year-over-year growth 2025-2030 (%)
Data Table on Europe - Year-over-year growth 2025-2030 (%)
Chart on Regional Comparison - Europe
Data Table on Regional Comparison - Europe

12.5.1 Germany - Market size and forecast 2025-2030

Chart on Germany - Market size and forecast 2025-2030 ($ million)
Data Table on Germany - Market size and forecast 2025-2030 ($ million)
Chart on Germany - Year-over-year growth 2025-2030 (%)
Data Table on Germany - Year-over-year growth 2025-2030 (%)

12.5.2 France - Market size and forecast 2025-2030

Chart on France - Market size and forecast 2025-2030 ($ million)
Data Table on France - Market size and forecast 2025-2030 ($ million)
Chart on France - Year-over-year growth 2025-2030 (%)
Data Table on France - Year-over-year growth 2025-2030 (%)

12.5.3 UK - Market size and forecast 2025-2030

Chart on UK - Market size and forecast 2025-2030 ($ million)
Data Table on UK - Market size and forecast 2025-2030 ($ million)
Chart on UK - Year-over-year growth 2025-2030 (%)
Data Table on UK - Year-over-year growth 2025-2030 (%)

12.5.4 Italy - Market size and forecast 2025-2030

Chart on Italy - Market size and forecast 2025-2030 ($ million)
Data Table on Italy - Market size and forecast 2025-2030 ($ million)
Chart on Italy - Year-over-year growth 2025-2030 (%)
Data Table on Italy - Year-over-year growth 2025-2030 (%)

12.5.5 The Netherlands - Market size and forecast 2025-2030

Chart on The Netherlands - Market size and forecast 2025-2030 ($ million)
Data Table on The Netherlands - Market size and forecast 2025-2030 ($ million)
Chart on The Netherlands - Year-over-year growth 2025-2030 (%)
Data Table on The Netherlands - Year-over-year growth 2025-2030 (%)

12.5.6 Spain - Market size and forecast 2025-2030

Chart on Spain - Market size and forecast 2025-2030 ($ million)
Data Table on Spain - Market size and forecast 2025-2030 ($ million)
Chart on Spain - Year-over-year growth 2025-2030 (%)
Data Table on Spain - Year-over-year growth 2025-2030 (%)

12.6 South America - Market size and forecast 2025-2030

Chart on South America - Market size and forecast 2025-2030 ($ million)
Data Table on South America - Market size and forecast 2025-2030 ($ million)
Chart on South America - Year-over-year growth 2025-2030 (%)
Data Table on South America - Year-over-year growth 2025-2030 (%)
Chart on Regional Comparison - South America
Data Table on Regional Comparison - South America

12.6.1 Brazil - Market size and forecast 2025-2030

Chart on Brazil - Market size and forecast 2025-2030 ($ million)
Data Table on Brazil - Market size and forecast 2025-2030 ($ million)
Chart on Brazil - Year-over-year growth 2025-2030 (%)
Data Table on Brazil - Year-over-year growth 2025-2030 (%)

12.6.2 Argentina - Market size and forecast 2025-2030

Chart on Argentina - Market size and forecast 2025-2030 ($ million)
Data Table on Argentina - Market size and forecast 2025-2030 ($ million)
Chart on Argentina - Year-over-year growth 2025-2030 (%)
Data Table on Argentina - Year-over-year growth 2025-2030 (%)

12.6.3 Chile - Market size and forecast 2025-2030

Chart on Chile - Market size and forecast 2025-2030 ($ million)
Data Table on Chile - Market size and forecast 2025-2030 ($ million)
Chart on Chile - Year-over-year growth 2025-2030 (%)
Data Table on Chile - Year-over-year growth 2025-2030 (%)

12.7 Middle East and Africa - Market size and forecast 2025-2030

Chart on Middle East and Africa - Market size and forecast 2025-2030 ($ million)
Data Table on Middle East and Africa - Market size and forecast 2025-2030 ($ million)
Chart on Middle East and Africa - Year-over-year growth 2025-2030 (%)
Data Table on Middle East and Africa - Year-over-year growth 2025-2030 (%)
Chart on Regional Comparison - Middle East and Africa
Data Table on Regional Comparison - Middle East and Africa

12.7.1 Saudi Arabia - Market size and forecast 2025-2030

Chart on Saudi Arabia - Market size and forecast 2025-2030 ($ million)
Data Table on Saudi Arabia - Market size and forecast 2025-2030 ($ million)
Chart on Saudi Arabia - Year-over-year growth 2025-2030 (%)
Data Table on Saudi Arabia - Year-over-year growth 2025-2030 (%)

12.7.2 UAE - Market size and forecast 2025-2030

Chart on UAE - Market size and forecast 2025-2030 ($ million)
Data Table on UAE - Market size and forecast 2025-2030 ($ million)
Chart on UAE - Year-over-year growth 2025-2030 (%)
Data Table on UAE - Year-over-year growth 2025-2030 (%)

12.7.3 South Africa - Market size and forecast 2025-2030

Chart on South Africa - Market size and forecast 2025-2030 ($ million)
Data Table on South Africa - Market size and forecast 2025-2030 ($ million)
Chart on South Africa - Year-over-year growth 2025-2030 (%)
Data Table on South Africa - Year-over-year growth 2025-2030 (%)

12.7.4 Israel - Market size and forecast 2025-2030

Chart on Israel - Market size and forecast 2025-2030 ($ million)
Data Table on Israel - Market size and forecast 2025-2030 ($ million)
Chart on Israel - Year-over-year growth 2025-2030 (%)
Data Table on Israel - Year-over-year growth 2025-2030 (%)

12.7.5 Turkey - Market size and forecast 2025-2030

Chart on Turkey - Market size and forecast 2025-2030 ($ million)
Data Table on Turkey - Market size and forecast 2025-2030 ($ million)
Chart on Turkey - Year-over-year growth 2025-2030 (%)
Data Table on Turkey - Year-over-year growth 2025-2030 (%)

12.8 Market opportunity by geography

Market opportunity by geography ($ million)
Data Tables on Market opportunity by geography ($ million)

13. Drivers, Challenges, and Opportunity

13.1 Market drivers

Proliferation of generative AI and large language models
Accelerated electrification and autonomy in automotive sector
Expansion of industrial digitalization and IoT

13.2 Market challenges

Escalating design complexity and physical scaling limits
Geopolitical fragmentation and regulatory trade restrictions
Critical talent shortages and workforce deficiencies

13.3 Impact of drivers and challenges

Impact of drivers and challenges in 2025 and 2030

13.4 Market opportunities

Dominance of heterogeneous integration and advanced packaging architectures
Rise of domain specific architectures and custom silicon development
Implementation of sustainable manufacturing and circular economy principles

14. Competitive Landscape

14.1 Overview

14.2

Overview on criticality of inputs and factors of differentiation

14.3 Landscape disruption

Overview on factors of disruption

14.4 Industry risks

Impact of key risks on business

15. Competitive Analysis

15.1 Companies profiled

Companies covered

15.2 Company ranking index

15.3 Market positioning of companies

Matrix on companies position and classification

15.4 Advanced Micro Devices Inc.

Advanced Micro Devices Inc. - Overview
Advanced Micro Devices Inc. - Business segments
Advanced Micro Devices Inc. - Key news
Advanced Micro Devices Inc. - Key offerings
Advanced Micro Devices Inc. - Segment focus
SWOT

15.5 Analog Devices Inc.

Analog Devices Inc. - Overview
Analog Devices Inc. - Business segments
Analog Devices Inc. - Key offerings
Analog Devices Inc. - Segment focus
SWOT

15.6 Broadcom Inc.

Broadcom Inc. - Overview
Broadcom Inc. - Business segments
Broadcom Inc. - Key offerings
Broadcom Inc. - Segment focus
SWOT

15.7 Infineon Technologies AG

Infineon Technologies AG - Overview
Infineon Technologies AG - Business segments
Infineon Technologies AG - Key news
Infineon Technologies AG - Key offerings
Infineon Technologies AG - Segment focus
SWOT

15.8 Intel Corp.

Intel Corp. - Overview
Intel Corp. - Business segments
Intel Corp. - Key news
Intel Corp. - Key offerings
Intel Corp. - Segment focus
SWOT

15.9 Marvell Technology Inc.

Marvell Technology Inc. - Overview
Marvell Technology Inc. - Product / Service
Marvell Technology Inc. - Key news
Marvell Technology Inc. - Key offerings
SWOT

15.10 MediaTek Inc.

MediaTek Inc. - Overview
MediaTek Inc. - Business segments
MediaTek Inc. - Key news
MediaTek Inc. - Key offerings
MediaTek Inc. - Segment focus
SWOT

15.11 Micron Technology Inc.

Micron Technology Inc. - Overview
Micron Technology Inc. - Business segments
Micron Technology Inc. - Key news
Micron Technology Inc. - Key offerings
Micron Technology Inc. - Segment focus
SWOT

15.12 NVIDIA Corp.

NVIDIA Corp. - Overview
NVIDIA Corp. - Business segments
NVIDIA Corp. - Key news
NVIDIA Corp. - Key offerings
NVIDIA Corp. - Segment focus
SWOT

15.13 NXP Semiconductors NV

NXP Semiconductors NV - Overview
NXP Semiconductors NV - Business segments
NXP Semiconductors NV - Key news
NXP Semiconductors NV - Key offerings
NXP Semiconductors NV - Segment focus
SWOT

15.14 Qualcomm Inc.

Qualcomm Inc. - Overview
Qualcomm Inc. - Business segments
Qualcomm Inc. - Key news
Qualcomm Inc. - Key offerings
Qualcomm Inc. - Segment focus
SWOT

15.15 Samsung Electronics Co. Ltd.

Samsung Electronics Co. Ltd. - Overview
Samsung Electronics Co. Ltd. - Business segments
Samsung Electronics Co. Ltd. - Key news
Samsung Electronics Co. Ltd. - Key offerings
Samsung Electronics Co. Ltd. - Segment focus
SWOT

15.16 STMicroelectronics NV

STMicroelectronics NV - Overview
STMicroelectronics NV - Business segments
STMicroelectronics NV - Key offerings
STMicroelectronics NV - Segment focus
SWOT

15.17 Taiwan Semiconductor Co. Ltd.

Taiwan Semiconductor Co. Ltd. - Overview
Taiwan Semiconductor Co. Ltd. - Product / Service
Taiwan Semiconductor Co. Ltd. - Key news
Taiwan Semiconductor Co. Ltd. - Key offerings
SWOT

15.18 Texas Instruments Inc.

Texas Instruments Inc. - Overview
Texas Instruments Inc. - Business segments
Texas Instruments Inc. - Key offerings
Texas Instruments Inc. - Segment focus
SWOT

16. Appendix

16.1 Scope of the report

Market definition
Objectives
Notes and caveats

16.2 Inclusions and exclusions checklist

Inclusions checklist
Exclusions checklist

16.3 Currency conversion rates for US$

16.4 Research methodology

16.5 Data procurement

Information sources

16.6 Data validation

16.7 Validation techniques employed for market sizing

16.8 Data synthesis

16.9 360 degree market analysis

16.10 List of abbreviations

Research Methodology

Technavio presents a detailed picture of the market by way of study, synthesis, and summation of data from multiple sources. The analysts have presented the various facets of the market with a particular focus on identifying the key industry influencers. The data thus presented is comprehensive, reliable, and the result of extensive research, both primary and secondary.

INFORMATION SOURCES

Primary sources

  • Manufacturers and suppliers
  • Channel partners
  • Industry experts
  • Strategic decision makers

Secondary sources

  • Industry journals and periodicals
  • Government data
  • Financial reports of key industry players
  • Historical data
  • Press releases

DATA ANALYSIS

Data Synthesis

  • Collation of data
  • Estimation of key figures
  • Analysis of derived insights

Data Validation

  • Triangulation with data models
  • Reference against proprietary databases
  • Corroboration with industry experts

REPORT WRITING

Qualitative

  • Market drivers
  • Market challenges
  • Market trends
  • Five forces analysis

Quantitative

  • Market size and forecast
  • Market segmentation
  • Geographical insights
  • Competitive landscape

Interested in this report?

Get your sample now to see our research methodology and insights!

Download Now

Frequently Asked Questions

Integrated Circuits market growth will increase by USD 242099.4 million during 2026-2030.

The Integrated Circuits market is expected to grow at a CAGR of 7.7% during 2026-2030.

Integrated Circuits market is segmented by Type (General-purpose ICs, Application-specific ICs) Product (Logic ICs, Memory ICs, Analog ICs, Micro components, Mixed-signal ICs) End-user (Consumer electronics, Data centers, Automotive, Industrial, Others)

Advanced Micro Devices Inc., Analog Devices Inc., Broadcom Inc., GlobalFoundaries Inc., Infineon Technologies AG, Intel Corp., Marvell Technology Inc., MediaTek Inc., Microchip Technology Inc., Micron Technology Inc., NVIDIA Corp., NXP Semiconductors NV, ON Semiconductor Corp., Qualcomm Inc., Renesas Electronics Corp., Samsung Electronics Co. Ltd., STMicroelectronics NV, Taiwan Semiconductor Co. Ltd., Texas Instruments Inc., Tower Semiconductor Ltd. are a few of the key vendors in the Integrated Circuits market.

APAC will register the highest growth rate of 62.1% among the other regions. Therefore, the Integrated Circuits market in APAC is expected to garner significant business opportunities for the vendors during the forecast period.

China, South Korea, Taiwan, India, Australia, Singapore, US, Canada, Mexico, Germany, France, UK, Italy, The Netherlands, Spain, Brazil, Argentina, Chile, Saudi Arabia, UAE, South Africa, Israel, Turkey

  • Proliferation of generative AI and large language models is the driving factor this market.

The Integrated Circuits market vendors should focus on grabbing business opportunities from the Type segment as it accounted for the largest market share in the base year.
RIA - Research AI Assistant
Ask RIA