Home Services Market Analysis, Size, and Forecast 2026-2030: North America (US, Canada, and Mexico), Europe (Germany, UK, and France), APAC (China, Japan, and India), South America (Brazil and Argentina), Middle East and Africa (Saudi Arabia, UAE, and South Africa), and Rest of World (ROW)

Home Services Market Analysis, Size, and Forecast 2026-2030:
North America (US, Canada, and Mexico), Europe (Germany, UK, and France), APAC (China, Japan, and India), South America (Brazil and Argentina), Middle East and Africa (Saudi Arabia, UAE, and South Africa), and Rest of World (ROW)

Published: May 2026 290 Pages SKU: IRTNTR73805

Market Overview at a Glance

$1230.1 B
Market Opportunity
11.3%
CAGR 2025 - 2030
45.7%
North America Growth
$953.1 B
Home care and design segment 2024

Home Services Market Size 2026-2030

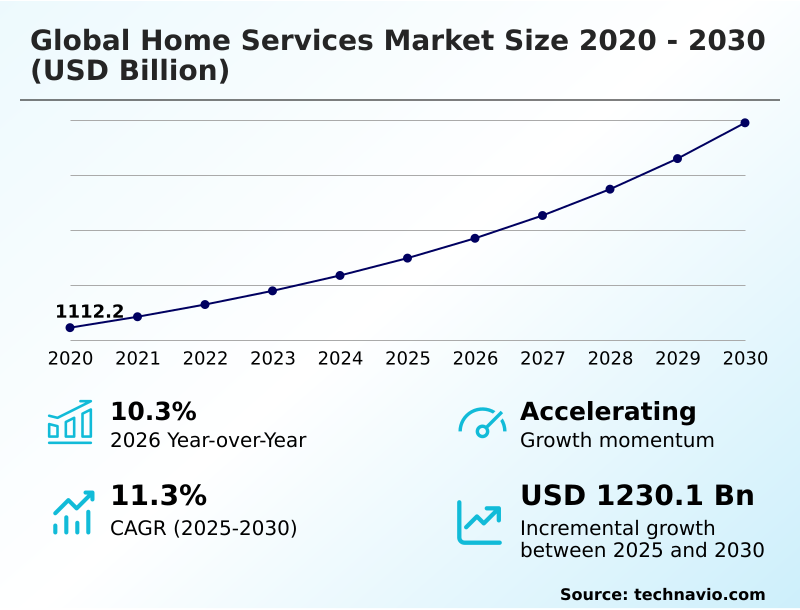
The home services market size is valued to increase by USD 1230.1 billion, at a CAGR of 11.3% from 2025 to 2030. Accelerated adoption of artificial intelligence and agentic matchmaking will drive the home services market.

Major Market Trends & Insights

  • North America dominated the market and accounted for a 45.7% growth during the forecast period.
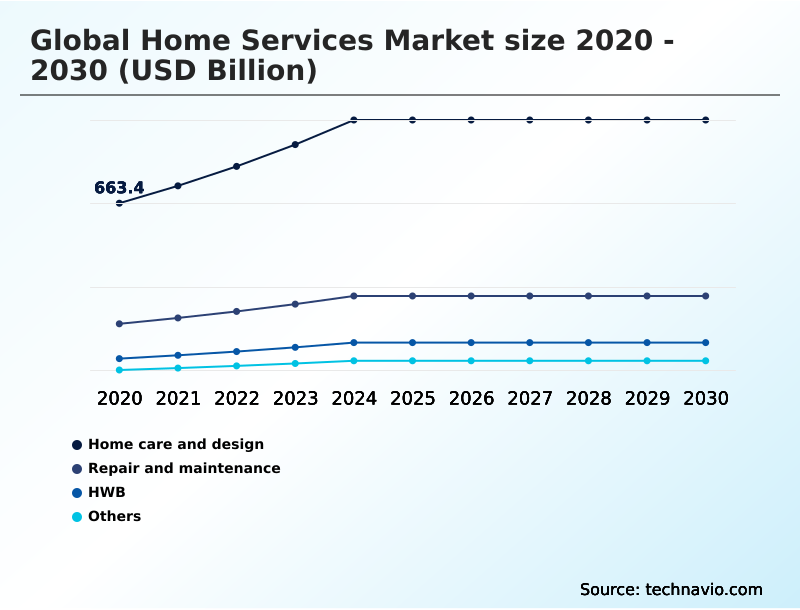
  • By Type - Home care and design segment was valued at USD 953.1 billion in 2024
  • By Deployment - Offline segment accounted for the largest market revenue share in 2024

Market Size & Forecast

  • Market Opportunities: USD 1862.3 billion
  • Market Future Opportunities: USD 1230.1 billion
  • CAGR from 2025 to 2030 : 11.3%

Market Summary

  • The home services market is undergoing a significant transformation, driven by technological integration and shifting consumer expectations for on-demand service platforms. A primary trend is the adoption of AI-guided diagnostics and agentic matchmaking algorithms, which are moving the industry beyond simple service directories to sophisticated, solution-oriented marketplaces.
  • This allows for more efficient automated technician dispatch and real-time service tracking, enhancing the seamless digital experience for homeowners. A major driver is the move toward subscription-based service models, offering providers stable recurring revenue models while giving consumers predictable preventive maintenance scheduling for critical systems like HVAC and plumbing.
  • For instance, a property management firm can leverage an integrated property maintenance software to oversee HVAC maintenance contracts across hundreds of units, utilizing IoT-enabled predictive maintenance to reduce emergency call-outs and operational costs. However, the sector faces challenges from skilled trade workforce development deficits and the complexity of managing a franchise-based service network.
  • The need for robust digital payment gateways and effective customer review management systems further complicates the operational landscape for both emerging and established players.

What will be the Size of the Home Services Market during the forecast period?

Get Key Insights on Market Forecast (PDF) Get Free Sample

How is the Home Services Market Segmented?

The home services industry research report provides comprehensive data (region-wise segment analysis), with forecasts and estimates in "USD billion" for the period 2026-2030, as well as historical data from 2020-2024 for the following segments.

  • Type
    • Home care and design
    • Repair and maintenance
    • HWB
    • Others
  • Deployment
    • Offline
    • Online
  • Platform
    • Web
    • Mobile
  • Geography
    • North America
      • US
      • Canada
      • Mexico
    • Europe
      • Germany
      • UK
      • France
    • APAC
      • China
      • Japan
      • India
    • South America
      • Brazil
      • Argentina
    • Middle East and Africa
      • Saudi Arabia
      • UAE
      • South Africa
    • Rest of World (ROW)

By Type Insights

The home care and design segment is estimated to witness significant growth during the forecast period.

The home care and design segment is evolving beyond traditional aesthetics to incorporate functional living solutions. A key driver is the growing demand for aging-in-place home modifications, merging environmental modification services with high-end interior design and renovation.

This trend is supported by smart home system installation, which allows for seamless integration of remote monitoring and accessibility features.

Providers are leveraging property maintenance software and end-to-end project management to coordinate complex jobs involving both aesthetic upgrades and specialized health-related installations.

The market's shift is reflected in how firms utilize automated bidding software, with adoption rates now exceeding 40% for projects that blend design with functional care, indicating a move towards data-driven service quality assurance.

Get Free Sample

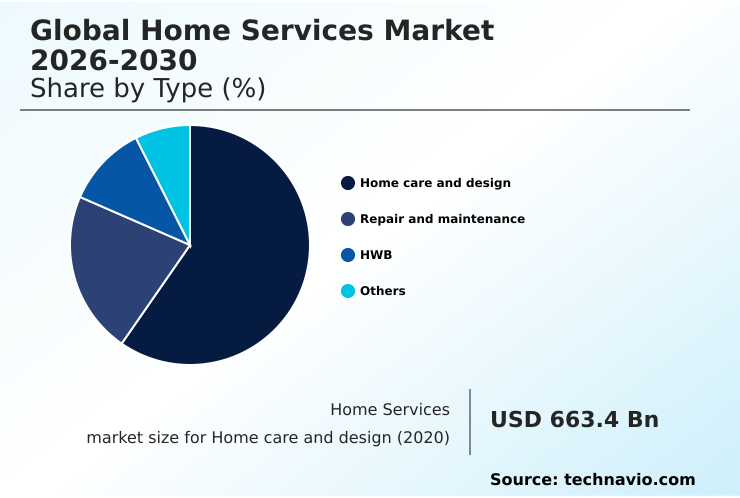
The Home care and design segment was valued at USD 953.1 billion in 2024 and showed a gradual increase during the forecast period.

Get Free Sample

Regional Analysis

North America is estimated to contribute 45.7% to the growth of the global market during the forecast period.Technavio’s analysts have elaborately explained the regional trends and drivers that shape the market during the forecast period.

See How Home Services Market Demand is Rising in North America Get Free Sample

The geographic landscape of the market is characterized by varying rates of digital adoption and service specialization.

In North America, which accounts for over 45% of the incremental growth, the demand for high-ticket home improvement and smart home ecosystem support is pronounced.

This region sees high utilization of mobile-first service procurement for everything from lawn care to specialized appliance repair.

Europe, contributing approximately 25% to market growth, exhibits strong demand for services aligned with sustainability, such as energy-efficient home retrofits and eco-friendly cleaning solutions. Here, digital credentialing systems are critical for verifying trade professionals.

In APAC, the fastest-growing region, the focus is on scaling on-demand service platforms to meet the needs of a rapidly urbanizing population, driving demand for outsourced domestic responsibilities and basic residential property management.

This region's digital marketplaces are achieving user adoption rates that are nearly double those seen in more mature markets five years prior.

Market Dynamics

Our researchers analyzed the data with 2025 as the base year, along with the key drivers, trends, and challenges. A holistic analysis of drivers will help companies refine their marketing strategies to gain a competitive advantage.

  • A strategic analysis of the home services market reveals a significant shift towards technology-driven solutions and specialized service models. The use of AI for diagnosing household repair issues is becoming a key differentiator, allowing platforms to move beyond simple listings. Concurrently, subscription models for preventative HVAC care are gaining traction, providing stable revenue and improving customer loyalty.
  • The industry continues to grapple with the impact of labor shortages on plumbing costs, which is accelerating the need for more efficient training programs for skilled trade professionals.
  • The growth of digital platforms for booking cleaning services has democratized access but also intensified competition, making online reputation management for local contractors and effective marketing strategies for local pest control more critical than ever. There is a rising demand for aging-in-place renovation services, creating a specialized, high-value segment.
  • The benefits of predictive maintenance for appliances, driven by using IoT for remote home system monitoring, are clear; firms adopting this technology report a 20% reduction in emergency dispatch calls compared to those using reactive models. This highlights the importance of technology for real-time technician tracking in optimizing logistics for on-demand junk removal and other services.
  • However, success also depends on addressing challenges in residential supply chain management and developing fair pricing strategies for competitive repair markets. The integration of smart home tech with security systems, the use of software for automating project bidding processes, and the growth of franchise models for electrical repair businesses all point to a more sophisticated and professionalized future.
  • Success will hinge on mastering both digital tools and on-the-ground operations, from ensuring customer retention in subscription-based cleaning to preparing for restoration services for extreme weather events.

What are the key market drivers leading to the rise in the adoption of Home Services Industry?

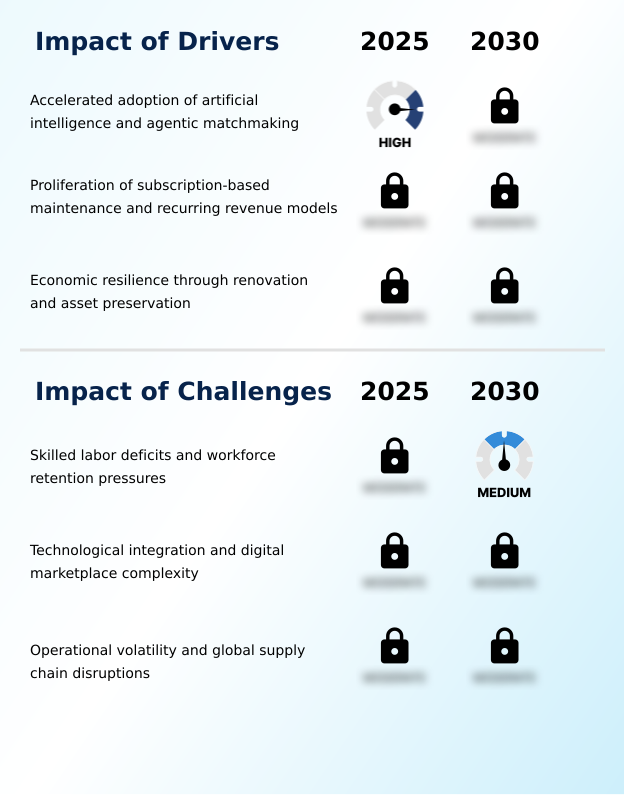
  • The accelerated adoption of artificial intelligence and agentic matchmaking is a key driver propelling market growth.

  • A primary driver is the shift toward recurring revenue models, which stabilize cash flow for providers and offer predictability to consumers. Companies implementing subscription plans for preventative home maintenance have seen customer repeat rates improve by over 10% year-over-year.
  • This is complemented by the economic resilience of asset preservation investment, as homeowners are choosing to renovate rather than relocate. This trend has boosted demand for energy-efficient home retrofits and aging-in-place home modifications.
  • Consequently, the market for high-ticket home improvement projects has expanded.
  • The ability of on-demand service platforms to facilitate this through mobile-first service procurement and offer a seamless digital experience is critical, with platforms reporting a 20% higher user engagement rate compared to traditional booking methods.

What are the market trends shaping the Home Services Industry?

  • The proliferation of AI and process automation is emerging as a key market trend. This is fundamentally enhancing service logistics and operational efficiency.

  • A key trend reshaping the market is the integration of AI and automation to enhance service logistics and project execution. The adoption of automated bidding software is streamlining the quoting process, with early adopters reporting a 40% reduction in time spent on administrative tasks.
  • Furthermore, the use of AI-guided diagnostics on consumer-facing platforms has improved job-to-professional matching accuracy by over 25%, minimizing rework and enhancing service quality assurance. This technological shift supports the rising demand for preventive maintenance scheduling and subscription-based service models.
  • As platforms incorporate real-time service tracking and on-site payment processing, the focus is on creating a frictionless end-to-end project management experience for homeowners seeking services from background-checked professionals for high-ticket home improvement projects.

What challenges does the Home Services Industry face during its growth?

  • Skilled labor deficits and workforce retention pressures present a key challenge affecting industry growth.

  • The most significant challenge facing the market is the persistent shortage of skilled labor, with industry reports indicating a shortfall of nearly 500,000 positions in skilled trades. This scarcity elevates operational costs and extends project timelines. Compounding this issue is digital marketplace complexity, where providers must invest heavily in technology and online reputation management to remain competitive.
  • The volatility of global supply chain disruptions further strains operations; unexpected material cost increases have eroded profit margins by as much as 15% on fixed-price contracts in recent quarters. Navigating these pressures requires robust workforce retention strategies, strategic investment in vocational training programs, and sophisticated supply chain risk mitigation to maintain service delivery standards and profitability in a demanding environment.

Exclusive Technavio Analysis on Customer Landscape

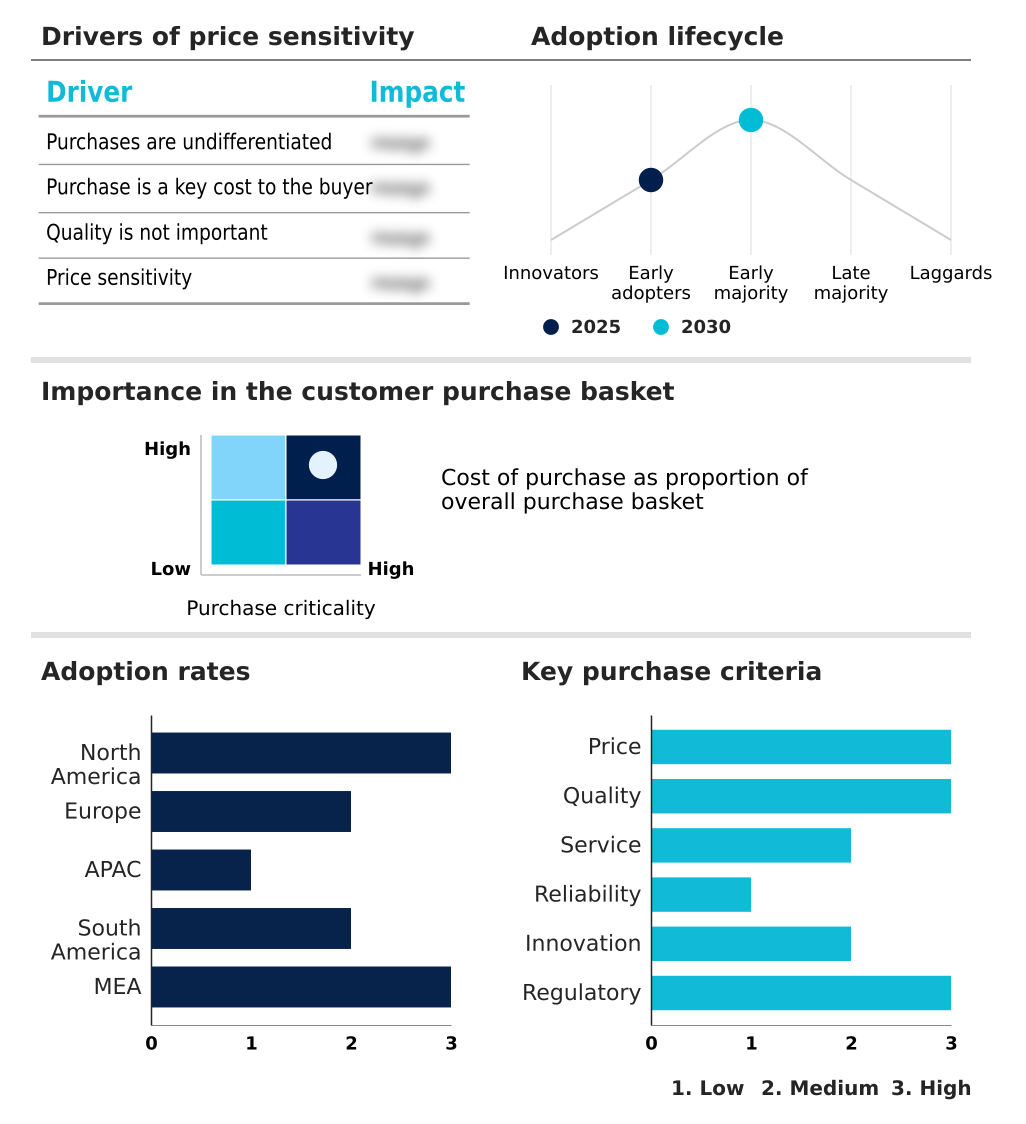
The home services market forecasting report includes the adoption lifecycle of the market, covering from the innovator’s stage to the laggard’s stage. It focuses on adoption rates in different regions based on penetration. Furthermore, the home services market report also includes key purchase criteria and drivers of price sensitivity to help companies evaluate and develop their market growth analysis strategies.

Customer Landscape of Home Services Industry

Competitive Landscape

Companies are implementing various strategies, such as strategic alliances, home services market forecast, partnerships, mergers and acquisitions, geographical expansion, and product/service launches, to enhance their presence in the industry.

ADT Inc. - Key offerings center on integrated security installations, continuous monitoring services, and advanced smart home protection solutions for residential properties.

The industry research and growth report includes detailed analyses of the competitive landscape of the market and information about key companies, including:

  • ADT Inc.
  • American Residential Services
  • Anticimex International AB
  • BELFOR Holdings Inc.
  • BrightView Holdings Inc.
  • Coit Services Inc.
  • Culligan International Co.
  • D.B.A 1 800 GOT JUNK
  • HomeServe Ltd
  • Lawn Doctor Inc.
  • Merry Maids
  • Neighborly
  • Orkin LLC
  • PuroClean
  • Rentokil Initial plc
  • Servpro Industries LLC
  • Stanley Steemer International
  • The Maids International Inc.
  • TruGreen L.P.
  • Vivint Smart Home Inc.

Qualitative and quantitative analysis of companies has been conducted to help clients understand the wider business environment as well as the strengths and weaknesses of key industry players. Data is qualitatively analyzed to categorize companies as pure play, category-focused, industry-focused, and diversified; it is quantitatively analyzed to categorize companies as dominant, leading, strong, tentative, and weak.

Recent Development and News in Home services market

  • In May, 2025, GreenPal expanded its on-demand service platform to Laredo, Texas, to meet rising demand for vetted landscaping professionals.
  • In April, 2025, GetNinjas reported a record increase in certified electrician and plumber registrations after implementing a new digital credentialing system in Brazil.
  • In March, 2025, ZTE Corporation launched a new range of high-performance home network and AI-media products at MWC Barcelona to support complex smart home infrastructures.
  • In February, 2025, Justlife, a Dubai-based service platform, introduced an AI-powered diagnostic tool for residential HVAC systems to enable predictive maintenance alerts.

Dive into Technavio’s robust research methodology, blending expert interviews, extensive data synthesis, and validated models for unparalleled Home Services Market insights. See full methodology.

Market Scope
Page number 290
Base year 2025
Historic period 2020-2024
Forecast period 2026-2030
Growth momentum & CAGR Accelerate at a CAGR of 11.3%
Market growth 2026-2030 USD 1230.1 billion
Market structure Fragmented
YoY growth 2025-2026(%) 10.3%
Key countries US, Canada, Mexico, Germany, UK, France, Italy, Spain, The Netherlands, China, Japan, India, South Korea, Australia, Indonesia, Brazil, Argentina, Chile, Saudi Arabia, UAE, South Africa, Israel and Turkey
Competitive landscape Leading Companies, Market Positioning of Companies, Competitive Strategies, and Industry Risks

Request Free Sample

Research Analyst Overview

  • The home services market is rapidly professionalizing through the adoption of integrated technology stacks. The deployment of on-demand service platforms is now standard, with differentiation shifting to the quality of the underlying agentic matchmaking algorithms and the efficiency of automated technician dispatch.
  • Leading firms are implementing IoT-enabled predictive maintenance and AI-guided diagnostics, which has led to a documented 30% reduction in unnecessary service appointments. This operational efficiency is critical for managing HVAC maintenance contracts, plumbing repair services, and electrical system upgrades. Boardroom decisions are increasingly focused on investing in property maintenance software that supports subscription-based service models and dynamic pricing models.
  • This strategy addresses both customer demand for predictability and internal pressures from skilled trade workforce development shortages. The scope of services is also broadening to include aging-in-place home modifications, home wellness services, and eco-friendly cleaning solutions, all managed through sophisticated online booking and scheduling systems.
  • Success depends on mastering everything from digital marketplace integration and franchise-based service networks to emergency repair dispatch and specialized appliance repair, supported by secure digital payment gateways and robust customer review management systems.

What are the Key Data Covered in this Home Services Market Research and Growth Report?

  • What is the expected growth of the Home Services Market between 2026 and 2030?

    • USD 1230.1 billion, at a CAGR of 11.3%

  • What segmentation does the market report cover?

    • The report is segmented by Type (Home care and design, Repair and maintenance, HWB, and Others), Deployment (Offline, and Online), Platform (Web, and Mobile) and Geography (North America, Europe, APAC, South America, Middle East and Africa)

  • Which regions are analyzed in the report?

    • North America, Europe, APAC, South America and Middle East and Africa

  • What are the key growth drivers and market challenges?

    • Accelerated adoption of artificial intelligence and agentic matchmaking, Skilled labor deficits and workforce retention pressures

  • Who are the major players in the Home Services Market?

    • ADT Inc., American Residential Services, Anticimex International AB, BELFOR Holdings Inc., BrightView Holdings Inc., Coit Services Inc., Culligan International Co., D.B.A 1 800 GOT JUNK, HomeServe Ltd, Lawn Doctor Inc., Merry Maids, Neighborly, Orkin LLC, PuroClean, Rentokil Initial plc, Servpro Industries LLC, Stanley Steemer International, The Maids International Inc., TruGreen L.P. and Vivint Smart Home Inc.

Market Research Insights

  • The market's dynamics are increasingly shaped by the pursuit of operational efficiency and customer relationship management. Providers are adopting recurring revenue models, which have been shown to improve customer repeat rates by over 10% compared to transactional models.
  • The focus on a seamless digital experience is critical, as platforms using advanced matchmaking algorithms report a 15% higher conversion rate on service requests. This drive for efficiency is also seen in back-office operations, where automated bidding software can reduce quote generation time by up to 50%, allowing for better real-time pricing adjustments.
  • The successful implementation of these technologies for hyper-local service delivery and end-to-end project management is becoming a key differentiator in a competitive landscape, directly impacting profitability and market positioning through superior service quality assurance.

We can help! Our analysts can customize this home services market research report to meet your requirements.

Get in touch

1. Executive Summary

1.1 Market overview

Executive Summary - Chart on Market Overview
Executive Summary - Data Table on Market Overview
Executive Summary - Chart on Global Market Characteristics
Executive Summary - Chart on Market by Geography
Executive Summary - Chart on Market Segmentation by Type
Executive Summary - Chart on Market Segmentation by Deployment
Executive Summary - Chart on Market Segmentation by Platform
Executive Summary - Chart on Incremental Growth
Executive Summary - Data Table on Incremental Growth
Executive Summary - Chart on Company Market Positioning

2. Technavio Analysis

2.1 Analysis of price sensitivity, lifecycle, customer purchase basket, adoption rates, and purchase criteria

2.2 Criticality of inputs and Factors of differentiation

Chart on Overview on criticality of inputs and factors of differentiation

2.3 Factors of disruption

Chart on Overview on factors of disruption

2.4 Impact of drivers and challenges

Chart on Impact of drivers and challenges in 2025 and 2030

3. Market Landscape

3.1 Market ecosystem

Chart on Parent Market
Data Table on - Parent Market

3.2 Market characteristics

Chart on Market characteristics analysis

3.3 Value chain analysis

Chart on Value chain analysis

4. Market Sizing

4.1 Market definition

Data Table on Offerings of companies included in the market definition

4.2 Market segment analysis

Market segments

4.3 Market size 2025

4.4 Market outlook: Forecast for 2025-2030

Chart on Global - Market size and forecast 2025-2030 ($ billion)
Data Table on Global - Market size and forecast 2025-2030 ($ billion)
Chart on Global Market: Year-over-year growth 2025-2030 (%)
Data Table on Global Market: Year-over-year growth 2025-2030 (%)

5. Historic Market Size

5.1 Global Home Services Market 2020 - 2024

Historic Market Size - Data Table on Global Home Services Market 2020 - 2024 ($ billion)

5.2 Type segment analysis 2020 - 2024

Historic Market Size - Type Segment 2020 - 2024 ($ billion)

5.3 Deployment segment analysis 2020 - 2024

Historic Market Size - Deployment Segment 2020 - 2024 ($ billion)

5.4 Platform segment analysis 2020 - 2024

Historic Market Size - Platform Segment 2020 - 2024 ($ billion)

5.5 Geography segment analysis 2020 - 2024

Historic Market Size - Geography Segment 2020 - 2024 ($ billion)

5.6 Country segment analysis 2020 - 2024

Historic Market Size - Country Segment 2020 - 2024 ($ billion)

6. Qualitative Analysis

6.1 Impact of AI on global home services market

6.2 Impact of geopolitical conflict on global home services market

7. Five Forces Analysis

7.1 Five forces summary

Five forces analysis - Comparison between 2025 and 2030

7.2 Bargaining power of buyers

Bargaining power of buyers - Impact of key factors 2025 and 2030

7.3 Bargaining power of suppliers

Bargaining power of suppliers - Impact of key factors in 2025 and 2030

7.4 Threat of new entrants

Threat of new entrants - Impact of key factors in 2025 and 2030

7.5 Threat of substitutes

Threat of substitutes - Impact of key factors in 2025 and 2030

7.6 Threat of rivalry

Threat of rivalry - Impact of key factors in 2025 and 2030

7.7 Market condition

Chart on Market condition - Five forces 2025 and 2030

8. Market Segmentation by Type

8.1 Market segments

Chart on Type - Market share 2025-2030 (%)
Data Table on Type - Market share 2025-2030 (%)

8.2 Comparison by Type

Chart on Comparison by Type
Data Table on Comparison by Type

8.3 Home care and design - Market size and forecast 2025-2030

Chart on Home care and design - Market size and forecast 2025-2030 ($ billion)
Data Table on Home care and design - Market size and forecast 2025-2030 ($ billion)
Chart on Home care and design - Year-over-year growth 2025-2030 (%)
Data Table on Home care and design - Year-over-year growth 2025-2030 (%)

8.4 Repair and maintenance - Market size and forecast 2025-2030

Chart on Repair and maintenance - Market size and forecast 2025-2030 ($ billion)
Data Table on Repair and maintenance - Market size and forecast 2025-2030 ($ billion)
Chart on Repair and maintenance - Year-over-year growth 2025-2030 (%)
Data Table on Repair and maintenance - Year-over-year growth 2025-2030 (%)

8.5 HWB - Market size and forecast 2025-2030

Chart on HWB - Market size and forecast 2025-2030 ($ billion)
Data Table on HWB - Market size and forecast 2025-2030 ($ billion)
Chart on HWB - Year-over-year growth 2025-2030 (%)
Data Table on HWB - Year-over-year growth 2025-2030 (%)

8.6 Others - Market size and forecast 2025-2030

Chart on Others - Market size and forecast 2025-2030 ($ billion)
Data Table on Others - Market size and forecast 2025-2030 ($ billion)
Chart on Others - Year-over-year growth 2025-2030 (%)
Data Table on Others - Year-over-year growth 2025-2030 (%)

8.7 Market opportunity by Type

Market opportunity by Type ($ billion)
Data Table on Market opportunity by Type ($ billion)

9. Market Segmentation by Deployment

9.1 Market segments

Chart on Deployment - Market share 2025-2030 (%)
Data Table on Deployment - Market share 2025-2030 (%)

9.2 Comparison by Deployment

Chart on Comparison by Deployment
Data Table on Comparison by Deployment

9.3 Offline - Market size and forecast 2025-2030

Chart on Offline - Market size and forecast 2025-2030 ($ billion)
Data Table on Offline - Market size and forecast 2025-2030 ($ billion)
Chart on Offline - Year-over-year growth 2025-2030 (%)
Data Table on Offline - Year-over-year growth 2025-2030 (%)

9.4 Online - Market size and forecast 2025-2030

Chart on Online - Market size and forecast 2025-2030 ($ billion)
Data Table on Online - Market size and forecast 2025-2030 ($ billion)
Chart on Online - Year-over-year growth 2025-2030 (%)
Data Table on Online - Year-over-year growth 2025-2030 (%)

9.5 Market opportunity by Deployment

Market opportunity by Deployment ($ billion)
Data Table on Market opportunity by Deployment ($ billion)

10. Market Segmentation by Platform

10.1 Market segments

Chart on Platform - Market share 2025-2030 (%)
Data Table on Platform - Market share 2025-2030 (%)

10.2 Comparison by Platform

Chart on Comparison by Platform
Data Table on Comparison by Platform

10.3 Web - Market size and forecast 2025-2030

Chart on Web - Market size and forecast 2025-2030 ($ billion)
Data Table on Web - Market size and forecast 2025-2030 ($ billion)
Chart on Web - Year-over-year growth 2025-2030 (%)
Data Table on Web - Year-over-year growth 2025-2030 (%)

10.4 Mobile - Market size and forecast 2025-2030

Chart on Mobile - Market size and forecast 2025-2030 ($ billion)
Data Table on Mobile - Market size and forecast 2025-2030 ($ billion)
Chart on Mobile - Year-over-year growth 2025-2030 (%)
Data Table on Mobile - Year-over-year growth 2025-2030 (%)

10.5 Market opportunity by Platform

Market opportunity by Platform ($ billion)
Data Table on Market opportunity by Platform ($ billion)

11. Customer Landscape

11.1 Customer landscape overview

Analysis of price sensitivity, lifecycle, customer purchase basket, adoption rates, and purchase criteria

12. Geographic Landscape

12.1 Geographic segmentation

Chart on Market share by geography 2025-2030 (%)
Data Table on Market share by geography 2025-2030 (%)

12.2 Geographic comparison

Chart on Geographic comparison
Data Table on Geographic comparison

12.3 North America - Market size and forecast 2025-2030

Chart on North America - Market size and forecast 2025-2030 ($ billion)
Data Table on North America - Market size and forecast 2025-2030 ($ billion)
Chart on North America - Year-over-year growth 2025-2030 (%)
Data Table on North America - Year-over-year growth 2025-2030 (%)
Chart on Regional Comparison - North America
Data Table on Regional Comparison - North America

12.3.1 US - Market size and forecast 2025-2030

Chart on US - Market size and forecast 2025-2030 ($ billion)
Data Table on US - Market size and forecast 2025-2030 ($ billion)
Chart on US - Year-over-year growth 2025-2030 (%)
Data Table on US - Year-over-year growth 2025-2030 (%)

12.3.2 Canada - Market size and forecast 2025-2030

Chart on Canada - Market size and forecast 2025-2030 ($ billion)
Data Table on Canada - Market size and forecast 2025-2030 ($ billion)
Chart on Canada - Year-over-year growth 2025-2030 (%)
Data Table on Canada - Year-over-year growth 2025-2030 (%)

12.3.3 Mexico - Market size and forecast 2025-2030

Chart on Mexico - Market size and forecast 2025-2030 ($ billion)
Data Table on Mexico - Market size and forecast 2025-2030 ($ billion)
Chart on Mexico - Year-over-year growth 2025-2030 (%)
Data Table on Mexico - Year-over-year growth 2025-2030 (%)

12.4 Europe - Market size and forecast 2025-2030

Chart on Europe - Market size and forecast 2025-2030 ($ billion)
Data Table on Europe - Market size and forecast 2025-2030 ($ billion)
Chart on Europe - Year-over-year growth 2025-2030 (%)
Data Table on Europe - Year-over-year growth 2025-2030 (%)
Chart on Regional Comparison - Europe
Data Table on Regional Comparison - Europe

12.4.1 Germany - Market size and forecast 2025-2030

Chart on Germany - Market size and forecast 2025-2030 ($ billion)
Data Table on Germany - Market size and forecast 2025-2030 ($ billion)
Chart on Germany - Year-over-year growth 2025-2030 (%)
Data Table on Germany - Year-over-year growth 2025-2030 (%)

12.4.2 UK - Market size and forecast 2025-2030

Chart on UK - Market size and forecast 2025-2030 ($ billion)
Data Table on UK - Market size and forecast 2025-2030 ($ billion)
Chart on UK - Year-over-year growth 2025-2030 (%)
Data Table on UK - Year-over-year growth 2025-2030 (%)

12.4.3 France - Market size and forecast 2025-2030

Chart on France - Market size and forecast 2025-2030 ($ billion)
Data Table on France - Market size and forecast 2025-2030 ($ billion)
Chart on France - Year-over-year growth 2025-2030 (%)
Data Table on France - Year-over-year growth 2025-2030 (%)

12.4.4 Italy - Market size and forecast 2025-2030

Chart on Italy - Market size and forecast 2025-2030 ($ billion)
Data Table on Italy - Market size and forecast 2025-2030 ($ billion)
Chart on Italy - Year-over-year growth 2025-2030 (%)
Data Table on Italy - Year-over-year growth 2025-2030 (%)

12.4.5 Spain - Market size and forecast 2025-2030

Chart on Spain - Market size and forecast 2025-2030 ($ billion)
Data Table on Spain - Market size and forecast 2025-2030 ($ billion)
Chart on Spain - Year-over-year growth 2025-2030 (%)
Data Table on Spain - Year-over-year growth 2025-2030 (%)

12.4.6 The Netherlands - Market size and forecast 2025-2030

Chart on The Netherlands - Market size and forecast 2025-2030 ($ billion)
Data Table on The Netherlands - Market size and forecast 2025-2030 ($ billion)
Chart on The Netherlands - Year-over-year growth 2025-2030 (%)
Data Table on The Netherlands - Year-over-year growth 2025-2030 (%)

12.5 APAC - Market size and forecast 2025-2030

Chart on APAC - Market size and forecast 2025-2030 ($ billion)
Data Table on APAC - Market size and forecast 2025-2030 ($ billion)
Chart on APAC - Year-over-year growth 2025-2030 (%)
Data Table on APAC - Year-over-year growth 2025-2030 (%)
Chart on Regional Comparison - APAC
Data Table on Regional Comparison - APAC

12.5.1 China - Market size and forecast 2025-2030

Chart on China - Market size and forecast 2025-2030 ($ billion)
Data Table on China - Market size and forecast 2025-2030 ($ billion)
Chart on China - Year-over-year growth 2025-2030 (%)
Data Table on China - Year-over-year growth 2025-2030 (%)

12.5.2 Japan - Market size and forecast 2025-2030

Chart on Japan - Market size and forecast 2025-2030 ($ billion)
Data Table on Japan - Market size and forecast 2025-2030 ($ billion)
Chart on Japan - Year-over-year growth 2025-2030 (%)
Data Table on Japan - Year-over-year growth 2025-2030 (%)

12.5.3 India - Market size and forecast 2025-2030

Chart on India - Market size and forecast 2025-2030 ($ billion)
Data Table on India - Market size and forecast 2025-2030 ($ billion)
Chart on India - Year-over-year growth 2025-2030 (%)
Data Table on India - Year-over-year growth 2025-2030 (%)

12.5.4 South Korea - Market size and forecast 2025-2030

Chart on South Korea - Market size and forecast 2025-2030 ($ billion)
Data Table on South Korea - Market size and forecast 2025-2030 ($ billion)
Chart on South Korea - Year-over-year growth 2025-2030 (%)
Data Table on South Korea - Year-over-year growth 2025-2030 (%)

12.5.5 Australia - Market size and forecast 2025-2030

Chart on Australia - Market size and forecast 2025-2030 ($ billion)
Data Table on Australia - Market size and forecast 2025-2030 ($ billion)
Chart on Australia - Year-over-year growth 2025-2030 (%)
Data Table on Australia - Year-over-year growth 2025-2030 (%)

12.5.6 Indonesia - Market size and forecast 2025-2030

Chart on Indonesia - Market size and forecast 2025-2030 ($ billion)
Data Table on Indonesia - Market size and forecast 2025-2030 ($ billion)
Chart on Indonesia - Year-over-year growth 2025-2030 (%)
Data Table on Indonesia - Year-over-year growth 2025-2030 (%)

12.6 South America - Market size and forecast 2025-2030

Chart on South America - Market size and forecast 2025-2030 ($ billion)
Data Table on South America - Market size and forecast 2025-2030 ($ billion)
Chart on South America - Year-over-year growth 2025-2030 (%)
Data Table on South America - Year-over-year growth 2025-2030 (%)
Chart on Regional Comparison - South America
Data Table on Regional Comparison - South America

12.6.1 Brazil - Market size and forecast 2025-2030

Chart on Brazil - Market size and forecast 2025-2030 ($ billion)
Data Table on Brazil - Market size and forecast 2025-2030 ($ billion)
Chart on Brazil - Year-over-year growth 2025-2030 (%)
Data Table on Brazil - Year-over-year growth 2025-2030 (%)

12.6.2 Argentina - Market size and forecast 2025-2030

Chart on Argentina - Market size and forecast 2025-2030 ($ billion)
Data Table on Argentina - Market size and forecast 2025-2030 ($ billion)
Chart on Argentina - Year-over-year growth 2025-2030 (%)
Data Table on Argentina - Year-over-year growth 2025-2030 (%)

12.6.3 Chile - Market size and forecast 2025-2030

Chart on Chile - Market size and forecast 2025-2030 ($ billion)
Data Table on Chile - Market size and forecast 2025-2030 ($ billion)
Chart on Chile - Year-over-year growth 2025-2030 (%)
Data Table on Chile - Year-over-year growth 2025-2030 (%)

12.7 Middle East and Africa - Market size and forecast 2025-2030

Chart on Middle East and Africa - Market size and forecast 2025-2030 ($ billion)
Data Table on Middle East and Africa - Market size and forecast 2025-2030 ($ billion)
Chart on Middle East and Africa - Year-over-year growth 2025-2030 (%)
Data Table on Middle East and Africa - Year-over-year growth 2025-2030 (%)
Chart on Regional Comparison - Middle East and Africa
Data Table on Regional Comparison - Middle East and Africa

12.7.1 Saudi Arabia - Market size and forecast 2025-2030

Chart on Saudi Arabia - Market size and forecast 2025-2030 ($ billion)
Data Table on Saudi Arabia - Market size and forecast 2025-2030 ($ billion)
Chart on Saudi Arabia - Year-over-year growth 2025-2030 (%)
Data Table on Saudi Arabia - Year-over-year growth 2025-2030 (%)

12.7.2 UAE - Market size and forecast 2025-2030

Chart on UAE - Market size and forecast 2025-2030 ($ billion)
Data Table on UAE - Market size and forecast 2025-2030 ($ billion)
Chart on UAE - Year-over-year growth 2025-2030 (%)
Data Table on UAE - Year-over-year growth 2025-2030 (%)

12.7.3 South Africa - Market size and forecast 2025-2030

Chart on South Africa - Market size and forecast 2025-2030 ($ billion)
Data Table on South Africa - Market size and forecast 2025-2030 ($ billion)
Chart on South Africa - Year-over-year growth 2025-2030 (%)
Data Table on South Africa - Year-over-year growth 2025-2030 (%)

12.7.4 Israel - Market size and forecast 2025-2030

Chart on Israel - Market size and forecast 2025-2030 ($ billion)
Data Table on Israel - Market size and forecast 2025-2030 ($ billion)
Chart on Israel - Year-over-year growth 2025-2030 (%)
Data Table on Israel - Year-over-year growth 2025-2030 (%)

12.7.5 Turkey - Market size and forecast 2025-2030

Chart on Turkey - Market size and forecast 2025-2030 ($ billion)
Data Table on Turkey - Market size and forecast 2025-2030 ($ billion)
Chart on Turkey - Year-over-year growth 2025-2030 (%)
Data Table on Turkey - Year-over-year growth 2025-2030 (%)

12.8 Market opportunity by geography

Market opportunity by geography ($ billion)
Data Tables on Market opportunity by geography ($ billion)

13. Drivers, Challenges, and Opportunity

13.1 Market drivers

Accelerated adoption of artificial intelligence and agentic matchmaking
Proliferation of subscription-based maintenance and recurring revenue models
Economic resilience through renovation and asset preservation

13.2 Market challenges

Skilled labor deficits and workforce retention pressures
Technological integration and digital marketplace complexity
Operational volatility and global supply chain disruptions

13.3 Impact of drivers and challenges

Impact of drivers and challenges in 2025 and 2030

13.4 Market opportunities

Proliferation of AI and process automation for enhanced service logistics
Rising demand for integrated smart home maintenance and sustainability solutions
Demographic shifts and rise of dual-income household outsourcing

14. Competitive Landscape

14.1 Overview

14.2

Overview on criticality of inputs and factors of differentiation

14.3 Landscape disruption

Overview on factors of disruption

14.4 Industry risks

Impact of key risks on business

15. Competitive Analysis

15.1 Companies profiled

Companies covered

15.2 Company ranking index

15.3 Market positioning of companies

Matrix on companies position and classification

15.4 ADT Inc.

ADT Inc. - Overview
ADT Inc. - Business segments
ADT Inc. - Key offerings
ADT Inc. - Segment focus
SWOT

15.5 American Residential Services

American Residential Services - Overview
American Residential Services - Product / Service
American Residential Services - Key offerings
SWOT

15.6 Anticimex International AB

Anticimex International AB - Overview
Anticimex International AB - Product / Service
Anticimex International AB - Key offerings
SWOT

15.7 BELFOR Holdings Inc.

BELFOR Holdings Inc. - Overview
BELFOR Holdings Inc. - Product / Service
BELFOR Holdings Inc. - Key offerings
SWOT

15.8 BrightView Holdings Inc.

BrightView Holdings Inc. - Overview
BrightView Holdings Inc. - Business segments
BrightView Holdings Inc. - Key offerings
BrightView Holdings Inc. - Segment focus
SWOT

15.9 Coit Services Inc.

Coit Services Inc. - Overview
Coit Services Inc. - Product / Service
Coit Services Inc. - Key offerings
SWOT

15.10 D.B.A 1 800 GOT JUNK

D.B.A 1 800 GOT JUNK - Overview
D.B.A 1 800 GOT JUNK - Product / Service
D.B.A 1 800 GOT JUNK - Key offerings
SWOT

15.11 HomeServe Ltd

HomeServe Ltd - Overview
HomeServe Ltd - Product / Service
HomeServe Ltd - Key offerings
SWOT

15.12 Lawn Doctor Inc.

Lawn Doctor Inc. - Overview
Lawn Doctor Inc. - Product / Service
Lawn Doctor Inc. - Key offerings
SWOT

15.13 Orkin LLC

Orkin LLC - Overview
Orkin LLC - Product / Service
Orkin LLC - Key offerings
SWOT

15.14 Rentokil Initial plc

Rentokil Initial plc - Overview
Rentokil Initial plc - Product / Service
Rentokil Initial plc - Key offerings
SWOT

15.15 Servpro Industries LLC

Servpro Industries LLC - Overview
Servpro Industries LLC - Product / Service
Servpro Industries LLC - Key offerings
SWOT

15.16 Stanley Steemer International

Stanley Steemer International - Overview
Stanley Steemer International - Product / Service
Stanley Steemer International - Key offerings
SWOT

15.17 The Maids International Inc.

The Maids International Inc. - Overview
The Maids International Inc. - Product / Service
The Maids International Inc. - Key offerings
SWOT

15.18 Vivint Smart Home Inc.

Vivint Smart Home Inc. - Overview
Vivint Smart Home Inc. - Product / Service
Vivint Smart Home Inc. - Key offerings
SWOT

16. Appendix

16.1 Scope of the report

Market definition
Objectives
Notes and caveats

16.2 Inclusions and exclusions checklist

Inclusions checklist
Exclusions checklist

16.3 Currency conversion rates for US$

16.4 Research methodology

16.5 Data procurement

Information sources

16.6 Data validation

16.7 Validation techniques employed for market sizing

16.8 Data synthesis

16.9 360 degree market analysis

16.10 List of abbreviations

Research Methodology

Technavio presents a detailed picture of the market by way of study, synthesis, and summation of data from multiple sources. The analysts have presented the various facets of the market with a particular focus on identifying the key industry influencers. The data thus presented is comprehensive, reliable, and the result of extensive research, both primary and secondary.

INFORMATION SOURCES

Primary sources

  • Manufacturers and suppliers
  • Channel partners
  • Industry experts
  • Strategic decision makers

Secondary sources

  • Industry journals and periodicals
  • Government data
  • Financial reports of key industry players
  • Historical data
  • Press releases

DATA ANALYSIS

Data Synthesis

  • Collation of data
  • Estimation of key figures
  • Analysis of derived insights

Data Validation

  • Triangulation with data models
  • Reference against proprietary databases
  • Corroboration with industry experts

REPORT WRITING

Qualitative

  • Market drivers
  • Market challenges
  • Market trends
  • Five forces analysis

Quantitative

  • Market size and forecast
  • Market segmentation
  • Geographical insights
  • Competitive landscape

Interested in this report?

Get your sample now to see our research methodology and insights!

Download Now

Frequently Asked Questions

Home Services market growth will increase by USD 1230.1 billion during 2026-2030.

The Home Services market is expected to grow at a CAGR of 11.3% during 2026-2030.

Home Services market is segmented by Type (Home care and design, Repair and maintenance, HWB, Others) Deployment (Offline, Online) Platform (Web, Mobile)

ADT Inc., American Residential Services, Anticimex International AB, BELFOR Holdings Inc., BrightView Holdings Inc., Coit Services Inc., Culligan International Co., D.B.A 1 800 GOT JUNK, HomeServe Ltd, Lawn Doctor Inc., Merry Maids, Neighborly, Orkin LLC, PuroClean, Rentokil Initial plc, Servpro Industries LLC, Stanley Steemer International, The Maids International Inc., TruGreen L.P., Vivint Smart Home Inc. are a few of the key vendors in the Home Services market.

North America will register the highest growth rate of 45.7% among the other regions. Therefore, the Home Services market in North America is expected to garner significant business opportunities for the vendors during the forecast period.

US, Canada, Mexico, Germany, UK, France, Italy, Spain, The Netherlands, China, Japan, India, South Korea, Australia, Indonesia, Brazil, Argentina, Chile, Saudi Arabia, UAE, South Africa, Israel, Turkey

  • Accelerated adoption of artificial intelligence and agentic matchmaking is the driving factor this market.

The Home Services market vendors should focus on grabbing business opportunities from the Type segment as it accounted for the largest market share in the base year.
RIA - Research AI Assistant
Ask RIA