Heat-not-burn Tobacco Products Market Analysis, Size, and Forecast 2026-2030: APAC (Japan, South Korea, and China), Europe (Italy, Germany, and UK), North America (US, Canada, and Mexico), Middle East and Africa (Saudi Arabia, UAE, and South Africa), South America (Brazil, Argentina, and Colombia), and Rest of World (ROW)

Heat-not-burn Tobacco Products Market Analysis, Size, and Forecast 2026-2030:
APAC (Japan, South Korea, and China), Europe (Italy, Germany, and UK), North America (US, Canada, and Mexico), Middle East and Africa (Saudi Arabia, UAE, and South Africa), South America (Brazil, Argentina, and Colombia), and Rest of World (ROW)

Published: May 2026 310 Pages SKU: IRTNTR40530

Market Overview at a Glance

$214.69 B
Market Opportunity
45.2%
CAGR 2025 - 2030
49.9%
APAC Growth
$25.43 B
Devices segment 2024

Heat-not-burn Tobacco Products Market Size 2026-2030

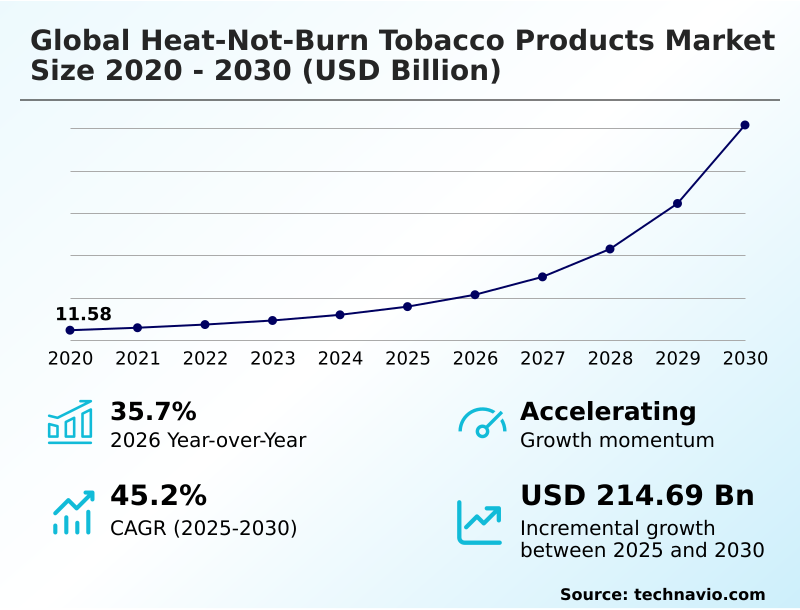
The heat-not-burn tobacco products market size is valued to increase by USD 214.69 billion, at a CAGR of 45.2% from 2025 to 2030. Increasing consumer demand for reduced-risk nicotine delivery systems will drive the heat-not-burn tobacco products market.

Major Market Trends & Insights

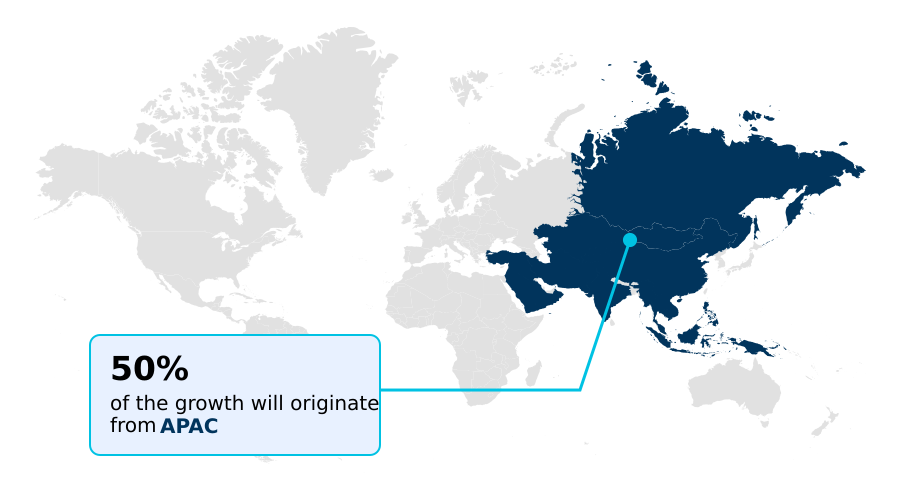
  • APAC dominated the market and accounted for a 49.9% growth during the forecast period.
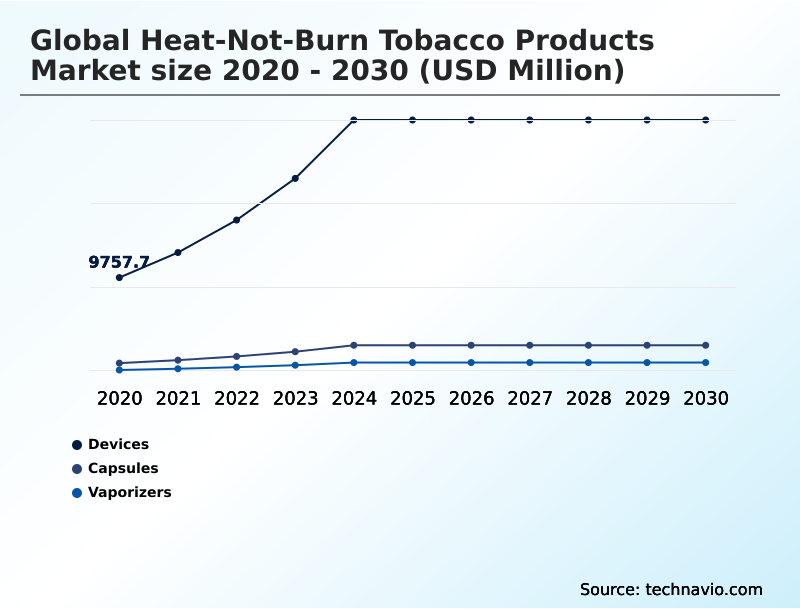
  • By Product - Devices segment was valued at USD 25.43 billion in 2024
  • By Distribution Channel - Offline segment accounted for the largest market revenue share in 2024

Market Size & Forecast

  • Market Opportunities: USD 242.54 billion
  • Market Future Opportunities: USD 214.69 billion
  • CAGR from 2025 to 2030 : 45.2%

Market Summary

  • The heat-not-burn tobacco products market is undergoing a significant transformation, driven by a consumer shift toward reduced-risk alternatives. These systems utilize advanced technology, including induction heating systems and sophisticated thermal management systems, to generate a nicotine-containing aerosol without combustion, thereby reducing exposure to harmful chemicals. This appeals to a wellness-prioritizing demographic seeking a familiar sensory experience.
  • The market dynamics are shaped by key trends such as premiumization, with a focus on artisanal flavor profiles and high-end lifestyle accessories. A critical business scenario involves navigating the complex and fragmented regulatory landscape, where companies must adapt their portfolios to varying regional rules on characterizing flavors and marketing.
  • For instance, a firm planning to launch a new device with Bluetooth connectivity and companion mobile applications must ensure compliance with data privacy and tobacco advertising laws, which can differ substantially between markets like Europe and APAC. Success depends on balancing innovation, such as developing biodegradable consumables, with the strategic management of these regulatory and fiscal hurdles.

What will be the Size of the Heat-not-burn Tobacco Products Market during the forecast period?

Get Key Insights on Market Forecast (PDF) Get Free Sample

How is the Heat-not-burn Tobacco Products Market Segmented?

The heat-not-burn tobacco products industry research report provides comprehensive data (region-wise segment analysis), with forecasts and estimates in "USD million" for the period 2026-2030, as well as historical data from 2020-2024 for the following segments.

  • Product
    • Devices
    • Capsules
    • Vaporizers
  • Distribution channel
    • Offline
    • Online
  • Flavor
    • Traditional tobacco
    • Mint
    • Fruit
  • End-user
    • Individuals
    • Commercial
  • Geography
    • APAC
      • Japan
      • South Korea
      • China
    • Europe
      • Italy
      • Germany
      • UK
    • North America
      • US
      • Canada
      • Mexico
    • Middle East and Africa
      • Saudi Arabia
      • UAE
      • South Africa
    • South America
      • Brazil
      • Argentina
      • Colombia
    • Rest of World (ROW)

By Product Insights

The devices segment is estimated to witness significant growth during the forecast period.

The devices segment is foundational, representing the electronic hardware that facilitates tobacco heating. These units are engineered with high-precision electronic heating elements and advanced temperature regulation to maintain a consistent thermal environment.

Modern designs leverage Bluetooth connectivity and companion mobile applications for a personalized user experience. The market is also seeing a shift towards more sustainable solutions, including the use of biodegradable consumables to improve the overall environmental footprint.

These technological leaps reinforce market dominance, as evidenced by a 38% growth in volumes for certain advanced systems, even in markets with fiscal hurdles like tax adjustments that can increase consumer costs by up to 95%.

This focus on a robust hardware ecosystem is crucial for recurring revenue from compatible capsules.

Get Free Sample

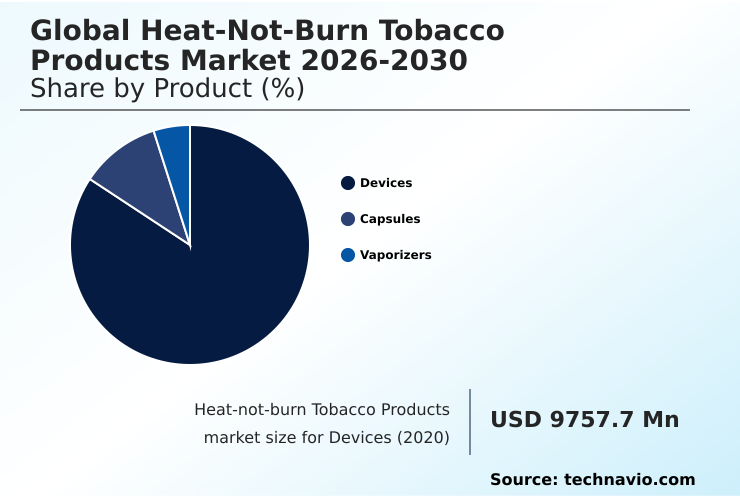
The Devices segment was valued at USD 25.43 billion in 2024 and showed a gradual increase during the forecast period.

Get Free Sample

Regional Analysis

APAC is estimated to contribute 49.9% to the growth of the global market during the forecast period.Technavio’s analysts have elaborately explained the regional trends and drivers that shape the market during the forecast period.

See How Heat-not-burn Tobacco Products Market Demand is Rising in APAC Get Free Sample

The geographic landscape of the market is predominantly led by the APAC region, which is projected to contribute 49.9% of the total incremental growth.

This dominance is driven by early adoption and strong cultural acceptance in countries like Japan, where some systems have already achieved a 14.4% market share.

The region benefits from a large population of adult smokers and an openness to new technology, supported by a robust manufacturing sector for both hardware and consumables.

In Europe, growth is propelled by high excise taxes on traditional cigarettes and a favorable regulatory outlook in key countries.

North America is characterized by a sophisticated regulatory process, while the Middle East and Africa show strong demand for premium products. These regional differences create a complex but opportunity-rich environment for market participants.

Market Dynamics

Our researchers analyzed the data with 2025 as the base year, along with the key drivers, trends, and challenges. A holistic analysis of drivers will help companies refine their marketing strategies to gain a competitive advantage.

  • The global heat-not-burn tobacco products market is navigating a complex interplay of technological innovation and regulatory pressures. A key focus is the impact of induction heating on flavor consistency, which represents a significant leap from older technologies. This is complemented by advancements in aerosol delivery optimization and leveraging AI for thermal management optimization to enhance performance.
  • The role of companion mobile applications in user tracking has become central to user experience enhancement via smart connectivity. However, companies face significant challenges in managing fragmented regulatory landscapes, particularly concerning compliance challenges with the Tobacco Products Directive and the impact of flavor bans on consumer conversion.
  • Strategically, firms are exploring cross-industry collaboration in aroma release technology and developing sustainability trends in heat-not-burn packaging. On the operational front, balancing hardware costs and consumer affordability is crucial, as is developing strategies for overcoming high initial capital expenditure. The competitive landscape is defined by technological competition from next-generation alternatives and the risk of market cannibalization from nicotine pouch products.
  • For continued growth, differentiating heat-not-burn from e-vapor systems through superior experience and clear communication is essential, supported by robust e-commerce strategies for online sales channels and efficient supply chain logistics for offline distribution, especially in a market where consumable volumes have shown the potential to increase by over 38% in a single year.

What are the key market drivers leading to the rise in the adoption of Heat-not-burn Tobacco Products Industry?

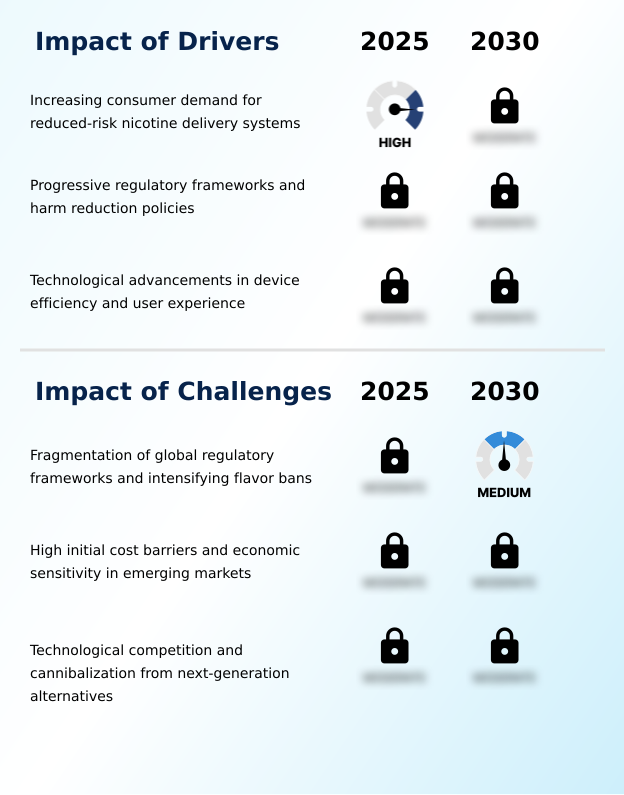
  • A primary market driver is the increasing consumer demand for reduced-risk nicotine delivery systems.

  • The primary market driver is a profound consumer shift toward reduced-risk alternatives, driven by a wellness-prioritizing demographic.
  • Heat-not-burn technology appeals to this group by generating a nicotine-containing aerosol at temperatures below 350 degrees Celsius, avoiding the combustion process and its associated chemicals.
  • This harm reduction approach is increasingly supported by risk-proportionate regulatory frameworks, which encourage the transition to a smoke-free future. Technological advancements, such as improved thermal management systems and cross-industry collaboration on hardware, further propel the market.
  • The perception of these products as being less harmful is a decisive factor for more than half of the current user base, highlighting the importance of scientific validation and clear consumer communication in driving adoption.

What are the market trends shaping the Heat-not-burn Tobacco Products Industry?

  • The market is witnessing a significant trend toward the integration of advanced induction heating technology, coupled with the incorporation of smart connectivity features in next-generation devices.

  • Key trends are reshaping the market, with a strong focus on advanced induction heating systems that ensure a more uniform temperature for a consistent sensory experience. This technological shift is part of a broader premiumization trend, where devices are positioned as lifestyle accessories with high-end finishes.
  • As companies pivot toward circular economy models, the development of biodegradable consumables and the reduction of the environmental footprint have become strategic priorities. These initiatives are crucial for gaining a competitive edge, especially in markets where sustainability influences purchasing decisions.
  • In some regions, advanced systems have already captured a 14.4% market share, while new product launches have demonstrated the ability to increase consumable volumes by over 38%, underscoring the impact of continuous innovation on consumer adoption.

What challenges does the Heat-not-burn Tobacco Products Industry face during its growth?

  • A key challenge affecting industry growth is the fragmentation of global regulatory frameworks and the concurrent intensification of flavor bans.

  • The market faces significant headwinds from a fragmented regulatory landscape and intensifying bans on characterizing flavors. This creates logistical and compliance challenges for global firms, forcing them to tailor product portfolios to a patchwork of local laws. For instance, abrupt fiscal and legislative hurdles, such as a tax rate of 95% on the sales price, can stifle market penetration.
  • Another challenge is the high initial capital expenditure for consumers, which is a deterrent in price-sensitive regions. This economic tension is exacerbated by competition from other next-generation nicotine delivery systems, leading to risks of market cannibalization.
  • Without continuous innovation to offset these challenges, long-term growth could be constrained, as user attrition can be high if devices are perceived as too complex.

Exclusive Technavio Analysis on Customer Landscape

The heat-not-burn tobacco products market forecasting report includes the adoption lifecycle of the market, covering from the innovator’s stage to the laggard’s stage. It focuses on adoption rates in different regions based on penetration. Furthermore, the heat-not-burn tobacco products market report also includes key purchase criteria and drivers of price sensitivity to help companies evaluate and develop their market growth analysis strategies.

Customer Landscape of Heat-not-burn Tobacco Products Industry

Competitive Landscape

Companies are implementing various strategies, such as strategic alliances, heat-not-burn tobacco products market forecast, partnerships, mergers and acquisitions, geographical expansion, and product/service launches, to enhance their presence in the industry.

ALD Group Ltd - Key offerings include advanced heating technology devices, OEM solutions, and comprehensive vape systems designed for the evolving non-combustible product landscape.

The industry research and growth report includes detailed analyses of the competitive landscape of the market and information about key companies, including:

  • ALD Group Ltd
  • British American Tobacco Plc
  • Buddy Technology Development
  • CFU Group
  • HiTaste Technology Co Ltd
  • Imperial Brands Plc
  • ISMODJO Technology Co Ltd
  • Japan Tobacco Inc.
  • Joecig Technology Co Ltd
  • Kamry Technology Co Ltd
  • KT and G Corp.
  • Lambda Smoke Inc
  • Mysmok Electronic Technology
  • Philip Morris International
  • Pluscig Technology Co Ltd
  • Shenzhen Kanger Technology
  • SMISS Technology Co. Ltd.
  • SMOORE International Holdings
  • Xomok Technology Co Ltd

Qualitative and quantitative analysis of companies has been conducted to help clients understand the wider business environment as well as the strengths and weaknesses of key industry players. Data is qualitatively analyzed to categorize companies as pure play, category-focused, industry-focused, and diversified; it is quantitatively analyzed to categorize companies as dominant, leading, strong, tentative, and weak.

Recent Development and News in Heat-not-burn tobacco products market

  • In August 2024, the United States Food and Drug Administration (FDA) issued updated final rules regarding the prohibition of the sale of tobacco products to persons younger than 21.
  • In September 2024, The Biden Administration announced an indefinite delay in finalizing the Food and Drug Administration rule that sought to prohibit menthol cigarettes.
  • In May 2025, Japan Tobacco International (JTI) acquired a controlling stake in Flavour Warehouse, a leading independent vape company with a strong e-commerce infrastructure.
  • In May 2025, British American Tobacco Plc launched glo Hilo, a new premium heated tobacco device in Japan featuring TurboStart technology and connectivity with the myglo app.

Dive into Technavio’s robust research methodology, blending expert interviews, extensive data synthesis, and validated models for unparalleled Heat-not-burn Tobacco Products Market insights. See full methodology.

Market Scope
Page number 310
Base year 2025
Historic period 2020-2024
Forecast period 2026-2030
Growth momentum & CAGR Accelerate at a CAGR of 45.2%
Market growth 2026-2030 USD 214688.6 million
Market structure Fragmented
YoY growth 2025-2026(%) 35.7%
Key countries Japan, South Korea, China, Indonesia, Philippines, Malaysia, Italy, Russia, Germany, UK, Poland, France, US, Canada, Mexico, Saudi Arabia, UAE, South Africa, Turkey, Egypt, Brazil, Argentina and Colombia
Competitive landscape Leading Companies, Market Positioning of Companies, Competitive Strategies, and Industry Risks

Request Free Sample

Research Analyst Overview

  • The heat-not-burn tobacco products market is defined by rapid technological advancement and a complex competitive ecosystem. At the core are induction heating systems, which have largely replaced older resistive heating elements to provide a more uniform temperature and consistent nicotine-containing aerosol.
  • Boardroom decisions are increasingly focused on the transition to sustainable materials, such as biodegradable filters and advanced cellulose acetate filters, to address regulatory pressures and consumer expectations. Hardware innovation is paramount, with a focus on high-capacity lithium-ion batteries, durable electronic heating elements, and precise temperature regulation.
  • Smart features like Bluetooth connectivity and companion mobile applications that use biometrically secured device data allow for enhanced heat management and aerosol delivery. The development of a new matrix-based fragrance carrier for stable aroma release from flavored tobacco sticks showcases the level of sophistication.
  • The competitive edge is maintained through a combination of proprietary reconstituted tobacco sheets, single-origin tobacco sticks, and unique flavor-release capsules embedded with menthol-infused thread. Future growth hinges on navigating the Premarket Tobacco Product Application process to secure modified risk claims, a factor that has enabled some platforms to achieve a 14.4% share in key markets.

What are the Key Data Covered in this Heat-not-burn Tobacco Products Market Research and Growth Report?

  • What is the expected growth of the Heat-not-burn Tobacco Products Market between 2026 and 2030?

    • USD 214.69 billion, at a CAGR of 45.2%

  • What segmentation does the market report cover?

    • The report is segmented by Product (Devices, Capsules, and Vaporizers), Distribution Channel (Offline, and Online), Flavor (Traditional tobacco, Mint, and Fruit), End-user (Individuals, and Commercial) and Geography (APAC, Europe, North America, Middle East and Africa, South America)

  • Which regions are analyzed in the report?

    • APAC, Europe, North America, Middle East and Africa and South America

  • What are the key growth drivers and market challenges?

    • Increasing consumer demand for reduced-risk nicotine delivery systems, Fragmentation of global regulatory frameworks and intensifying flavor bans

  • Who are the major players in the Heat-not-burn Tobacco Products Market?

    • ALD Group Ltd, British American Tobacco Plc, Buddy Technology Development, CFU Group, HiTaste Technology Co Ltd, Imperial Brands Plc, ISMODJO Technology Co Ltd, Japan Tobacco Inc., Joecig Technology Co Ltd, Kamry Technology Co Ltd, KT and G Corp., Lambda Smoke Inc, Mysmok Electronic Technology, Philip Morris International, Pluscig Technology Co Ltd, Shenzhen Kanger Technology, SMISS Technology Co. Ltd., SMOORE International Holdings and Xomok Technology Co Ltd

Market Research Insights

  • Market dynamics are heavily influenced by the strategic push toward a smoke-free future, with a focus on reduced-risk alternatives and harm reduction policies. Consumer sentiment analysis reveals a strong preference for devices that offer a clean and consistent experience, leading to user attrition rates of over 25% for systems with poor performance.
  • The value proposition is challenged by high initial capital expenditure, but this is offset by the long-term benefits of reduced toxicant exposure. In some regions, a risk-proportionate regulatory framework has been adopted, while in others, fiscal and legislative hurdles, such as a 95% tax on sales price, create significant market pressure.
  • This fragmented regulatory landscape requires companies to maintain high agility in their go-to-market strategies.

We can help! Our analysts can customize this heat-not-burn tobacco products market research report to meet your requirements.

Get in touch

1. Executive Summary

1.1 Market overview

Executive Summary - Chart on Market Overview
Executive Summary - Data Table on Market Overview
Executive Summary - Chart on Global Market Characteristics
Executive Summary - Chart on Market by Geography
Executive Summary - Chart on Market Segmentation by Product
Executive Summary - Chart on Market Segmentation by Distribution Channel
Executive Summary - Chart on Market Segmentation by Flavor
Executive Summary - Chart on Market Segmentation by End-user
Executive Summary - Chart on Incremental Growth
Executive Summary - Data Table on Incremental Growth
Executive Summary - Chart on Company Market Positioning

2. Technavio Analysis

2.1 Analysis of price sensitivity, lifecycle, customer purchase basket, adoption rates, and purchase criteria

2.2 Criticality of inputs and Factors of differentiation

Chart on Overview on criticality of inputs and factors of differentiation

2.3 Factors of disruption

Chart on Overview on factors of disruption

2.4 Impact of drivers and challenges

Chart on Impact of drivers and challenges in 2025 and 2030

3. Market Landscape

3.1 Market ecosystem

Chart on Parent Market
Data Table on - Parent Market

3.2 Market characteristics

Chart on Market characteristics analysis

3.3 Value chain analysis

Chart on Value chain analysis

4. Market Sizing

4.1 Market definition

Data Table on Offerings of companies included in the market definition

4.2 Market segment analysis

Market segments

4.3 Market size 2025

4.4 Market outlook: Forecast for 2025-2030

Chart on Global - Market size and forecast 2025-2030 ($ million)
Data Table on Global - Market size and forecast 2025-2030 ($ million)
Chart on Global Market: Year-over-year growth 2025-2030 (%)
Data Table on Global Market: Year-over-year growth 2025-2030 (%)

5. Historic Market Size

5.1 Global Heat-Not-Burn Tobacco Products Market 2020 - 2024

Historic Market Size - Data Table on Global Heat-Not-Burn Tobacco Products Market 2020 - 2024 ($ million)

5.2 Product segment analysis 2020 - 2024

Historic Market Size - Product Segment 2020 - 2024 ($ million)

5.3 Distribution Channel segment analysis 2020 - 2024

Historic Market Size - Distribution Channel Segment 2020 - 2024 ($ million)

5.4 Flavor segment analysis 2020 - 2024

Historic Market Size - Flavor Segment 2020 - 2024 ($ million)

5.5 End-user segment analysis 2020 - 2024

Historic Market Size - End-user Segment 2020 - 2024 ($ million)

5.6 Geography segment analysis 2020 - 2024

Historic Market Size - Geography Segment 2020 - 2024 ($ million)

5.7 Country segment analysis 2020 - 2024

Historic Market Size - Country Segment 2020 - 2024 ($ million)

6. Qualitative Analysis

6.1 Impact of AI on global heat-not-burn tobacco products market

6.2 Impact of geopolitical conflicts on global heat-not-burn tobacco products market

7. Five Forces Analysis

7.1 Five forces summary

Five forces analysis - Comparison between 2025 and 2030

7.2 Bargaining power of buyers

Bargaining power of buyers - Impact of key factors 2025 and 2030

7.3 Bargaining power of suppliers

Bargaining power of suppliers - Impact of key factors in 2025 and 2030

7.4 Threat of new entrants

Threat of new entrants - Impact of key factors in 2025 and 2030

7.5 Threat of substitutes

Threat of substitutes - Impact of key factors in 2025 and 2030

7.6 Threat of rivalry

Threat of rivalry - Impact of key factors in 2025 and 2030

7.7 Market condition

Chart on Market condition - Five forces 2025 and 2030

8. Market Segmentation by Product

8.1 Market segments

Chart on Product - Market share 2025-2030 (%)
Data Table on Product - Market share 2025-2030 (%)

8.2 Comparison by Product

Chart on Comparison by Product
Data Table on Comparison by Product

8.3 Devices - Market size and forecast 2025-2030

Chart on Devices - Market size and forecast 2025-2030 ($ million)
Data Table on Devices - Market size and forecast 2025-2030 ($ million)
Chart on Devices - Year-over-year growth 2025-2030 (%)
Data Table on Devices - Year-over-year growth 2025-2030 (%)

8.4 Capsules - Market size and forecast 2025-2030

Chart on Capsules - Market size and forecast 2025-2030 ($ million)
Data Table on Capsules - Market size and forecast 2025-2030 ($ million)
Chart on Capsules - Year-over-year growth 2025-2030 (%)
Data Table on Capsules - Year-over-year growth 2025-2030 (%)

8.5 Vaporizers - Market size and forecast 2025-2030

Chart on Vaporizers - Market size and forecast 2025-2030 ($ million)
Data Table on Vaporizers - Market size and forecast 2025-2030 ($ million)
Chart on Vaporizers - Year-over-year growth 2025-2030 (%)
Data Table on Vaporizers - Year-over-year growth 2025-2030 (%)

8.6 Market opportunity by Product

Market opportunity by Product ($ million)
Data Table on Market opportunity by Product ($ million)

9. Market Segmentation by Distribution Channel

9.1 Market segments

Chart on Distribution Channel - Market share 2025-2030 (%)
Data Table on Distribution Channel - Market share 2025-2030 (%)

9.2 Comparison by Distribution Channel

Chart on Comparison by Distribution Channel
Data Table on Comparison by Distribution Channel

9.3 Offline - Market size and forecast 2025-2030

Chart on Offline - Market size and forecast 2025-2030 ($ million)
Data Table on Offline - Market size and forecast 2025-2030 ($ million)
Chart on Offline - Year-over-year growth 2025-2030 (%)
Data Table on Offline - Year-over-year growth 2025-2030 (%)

9.4 Online - Market size and forecast 2025-2030

Chart on Online - Market size and forecast 2025-2030 ($ million)
Data Table on Online - Market size and forecast 2025-2030 ($ million)
Chart on Online - Year-over-year growth 2025-2030 (%)
Data Table on Online - Year-over-year growth 2025-2030 (%)

9.5 Market opportunity by Distribution Channel

Market opportunity by Distribution Channel ($ million)
Data Table on Market opportunity by Distribution Channel ($ million)

10. Market Segmentation by Flavor

10.1 Market segments

Chart on Flavor - Market share 2025-2030 (%)
Data Table on Flavor - Market share 2025-2030 (%)

10.2 Comparison by Flavor

Chart on Comparison by Flavor
Data Table on Comparison by Flavor

10.3 Traditional tobacco - Market size and forecast 2025-2030

Chart on Traditional tobacco - Market size and forecast 2025-2030 ($ million)
Data Table on Traditional tobacco - Market size and forecast 2025-2030 ($ million)
Chart on Traditional tobacco - Year-over-year growth 2025-2030 (%)
Data Table on Traditional tobacco - Year-over-year growth 2025-2030 (%)

10.4 Mint - Market size and forecast 2025-2030

Chart on Mint - Market size and forecast 2025-2030 ($ million)
Data Table on Mint - Market size and forecast 2025-2030 ($ million)
Chart on Mint - Year-over-year growth 2025-2030 (%)
Data Table on Mint - Year-over-year growth 2025-2030 (%)

10.5 Fruit - Market size and forecast 2025-2030

Chart on Fruit - Market size and forecast 2025-2030 ($ million)
Data Table on Fruit - Market size and forecast 2025-2030 ($ million)
Chart on Fruit - Year-over-year growth 2025-2030 (%)
Data Table on Fruit - Year-over-year growth 2025-2030 (%)

10.6 Market opportunity by Flavor

Market opportunity by Flavor ($ million)
Data Table on Market opportunity by Flavor ($ million)

11. Market Segmentation by End-user

11.1 Market segments

Chart on End-user - Market share 2025-2030 (%)
Data Table on End-user - Market share 2025-2030 (%)

11.2 Comparison by End-user

Chart on Comparison by End-user
Data Table on Comparison by End-user

11.3 Individuals - Market size and forecast 2025-2030

Chart on Individuals - Market size and forecast 2025-2030 ($ million)
Data Table on Individuals - Market size and forecast 2025-2030 ($ million)
Chart on Individuals - Year-over-year growth 2025-2030 (%)
Data Table on Individuals - Year-over-year growth 2025-2030 (%)

11.4 Commercial - Market size and forecast 2025-2030

Chart on Commercial - Market size and forecast 2025-2030 ($ million)
Data Table on Commercial - Market size and forecast 2025-2030 ($ million)
Chart on Commercial - Year-over-year growth 2025-2030 (%)
Data Table on Commercial - Year-over-year growth 2025-2030 (%)

11.5 Market opportunity by End-user

Market opportunity by End-user ($ million)
Data Table on Market opportunity by End-user ($ million)

12. Customer Landscape

12.1 Customer landscape overview

Analysis of price sensitivity, lifecycle, customer purchase basket, adoption rates, and purchase criteria

13. Geographic Landscape

13.1 Geographic segmentation

Chart on Market share by geography 2025-2030 (%)
Data Table on Market share by geography 2025-2030 (%)

13.2 Geographic comparison

Chart on Geographic comparison
Data Table on Geographic comparison

13.3 APAC - Market size and forecast 2025-2030

Chart on APAC - Market size and forecast 2025-2030 ($ million)
Data Table on APAC - Market size and forecast 2025-2030 ($ million)
Chart on APAC - Year-over-year growth 2025-2030 (%)
Data Table on APAC - Year-over-year growth 2025-2030 (%)
Chart on Regional Comparison - APAC
Data Table on Regional Comparison - APAC

13.3.1 Japan - Market size and forecast 2025-2030

Chart on Japan - Market size and forecast 2025-2030 ($ million)
Data Table on Japan - Market size and forecast 2025-2030 ($ million)
Chart on Japan - Year-over-year growth 2025-2030 (%)
Data Table on Japan - Year-over-year growth 2025-2030 (%)

13.3.2 South Korea - Market size and forecast 2025-2030

Chart on South Korea - Market size and forecast 2025-2030 ($ million)
Data Table on South Korea - Market size and forecast 2025-2030 ($ million)
Chart on South Korea - Year-over-year growth 2025-2030 (%)
Data Table on South Korea - Year-over-year growth 2025-2030 (%)

13.3.3 China - Market size and forecast 2025-2030

Chart on China - Market size and forecast 2025-2030 ($ million)
Data Table on China - Market size and forecast 2025-2030 ($ million)
Chart on China - Year-over-year growth 2025-2030 (%)
Data Table on China - Year-over-year growth 2025-2030 (%)

13.3.4 Indonesia - Market size and forecast 2025-2030

Chart on Indonesia - Market size and forecast 2025-2030 ($ million)
Data Table on Indonesia - Market size and forecast 2025-2030 ($ million)
Chart on Indonesia - Year-over-year growth 2025-2030 (%)
Data Table on Indonesia - Year-over-year growth 2025-2030 (%)

13.3.5 Philippines - Market size and forecast 2025-2030

Chart on Philippines - Market size and forecast 2025-2030 ($ million)
Data Table on Philippines - Market size and forecast 2025-2030 ($ million)
Chart on Philippines - Year-over-year growth 2025-2030 (%)
Data Table on Philippines - Year-over-year growth 2025-2030 (%)

13.3.6 Malaysia - Market size and forecast 2025-2030

Chart on Malaysia - Market size and forecast 2025-2030 ($ million)
Data Table on Malaysia - Market size and forecast 2025-2030 ($ million)
Chart on Malaysia - Year-over-year growth 2025-2030 (%)
Data Table on Malaysia - Year-over-year growth 2025-2030 (%)

13.4 Europe - Market size and forecast 2025-2030

Chart on Europe - Market size and forecast 2025-2030 ($ million)
Data Table on Europe - Market size and forecast 2025-2030 ($ million)
Chart on Europe - Year-over-year growth 2025-2030 (%)
Data Table on Europe - Year-over-year growth 2025-2030 (%)
Chart on Regional Comparison - Europe
Data Table on Regional Comparison - Europe

13.4.1 Italy - Market size and forecast 2025-2030

Chart on Italy - Market size and forecast 2025-2030 ($ million)
Data Table on Italy - Market size and forecast 2025-2030 ($ million)
Chart on Italy - Year-over-year growth 2025-2030 (%)
Data Table on Italy - Year-over-year growth 2025-2030 (%)

13.4.2 Russia - Market size and forecast 2025-2030

Chart on Russia - Market size and forecast 2025-2030 ($ million)
Data Table on Russia - Market size and forecast 2025-2030 ($ million)
Chart on Russia - Year-over-year growth 2025-2030 (%)
Data Table on Russia - Year-over-year growth 2025-2030 (%)

13.4.3 Germany - Market size and forecast 2025-2030

Chart on Germany - Market size and forecast 2025-2030 ($ million)
Data Table on Germany - Market size and forecast 2025-2030 ($ million)
Chart on Germany - Year-over-year growth 2025-2030 (%)
Data Table on Germany - Year-over-year growth 2025-2030 (%)

13.4.4 UK - Market size and forecast 2025-2030

Chart on UK - Market size and forecast 2025-2030 ($ million)
Data Table on UK - Market size and forecast 2025-2030 ($ million)
Chart on UK - Year-over-year growth 2025-2030 (%)
Data Table on UK - Year-over-year growth 2025-2030 (%)

13.4.5 Poland - Market size and forecast 2025-2030

Chart on Poland - Market size and forecast 2025-2030 ($ million)
Data Table on Poland - Market size and forecast 2025-2030 ($ million)
Chart on Poland - Year-over-year growth 2025-2030 (%)
Data Table on Poland - Year-over-year growth 2025-2030 (%)

13.4.6 France - Market size and forecast 2025-2030

Chart on France - Market size and forecast 2025-2030 ($ million)
Data Table on France - Market size and forecast 2025-2030 ($ million)
Chart on France - Year-over-year growth 2025-2030 (%)
Data Table on France - Year-over-year growth 2025-2030 (%)

13.5 North America - Market size and forecast 2025-2030

Chart on North America - Market size and forecast 2025-2030 ($ million)
Data Table on North America - Market size and forecast 2025-2030 ($ million)
Chart on North America - Year-over-year growth 2025-2030 (%)
Data Table on North America - Year-over-year growth 2025-2030 (%)
Chart on Regional Comparison - North America
Data Table on Regional Comparison - North America

13.5.1 US - Market size and forecast 2025-2030

Chart on US - Market size and forecast 2025-2030 ($ million)
Data Table on US - Market size and forecast 2025-2030 ($ million)
Chart on US - Year-over-year growth 2025-2030 (%)
Data Table on US - Year-over-year growth 2025-2030 (%)

13.5.2 Canada - Market size and forecast 2025-2030

Chart on Canada - Market size and forecast 2025-2030 ($ million)
Data Table on Canada - Market size and forecast 2025-2030 ($ million)
Chart on Canada - Year-over-year growth 2025-2030 (%)
Data Table on Canada - Year-over-year growth 2025-2030 (%)

13.5.3 Mexico - Market size and forecast 2025-2030

Chart on Mexico - Market size and forecast 2025-2030 ($ million)
Data Table on Mexico - Market size and forecast 2025-2030 ($ million)
Chart on Mexico - Year-over-year growth 2025-2030 (%)
Data Table on Mexico - Year-over-year growth 2025-2030 (%)

13.6 Middle East and Africa - Market size and forecast 2025-2030

Chart on Middle East and Africa - Market size and forecast 2025-2030 ($ million)
Data Table on Middle East and Africa - Market size and forecast 2025-2030 ($ million)
Chart on Middle East and Africa - Year-over-year growth 2025-2030 (%)
Data Table on Middle East and Africa - Year-over-year growth 2025-2030 (%)
Chart on Regional Comparison - Middle East and Africa
Data Table on Regional Comparison - Middle East and Africa

13.6.1 Saudi Arabia - Market size and forecast 2025-2030

Chart on Saudi Arabia - Market size and forecast 2025-2030 ($ million)
Data Table on Saudi Arabia - Market size and forecast 2025-2030 ($ million)
Chart on Saudi Arabia - Year-over-year growth 2025-2030 (%)
Data Table on Saudi Arabia - Year-over-year growth 2025-2030 (%)

13.6.2 UAE - Market size and forecast 2025-2030

Chart on UAE - Market size and forecast 2025-2030 ($ million)
Data Table on UAE - Market size and forecast 2025-2030 ($ million)
Chart on UAE - Year-over-year growth 2025-2030 (%)
Data Table on UAE - Year-over-year growth 2025-2030 (%)

13.6.3 South Africa - Market size and forecast 2025-2030

Chart on South Africa - Market size and forecast 2025-2030 ($ million)
Data Table on South Africa - Market size and forecast 2025-2030 ($ million)
Chart on South Africa - Year-over-year growth 2025-2030 (%)
Data Table on South Africa - Year-over-year growth 2025-2030 (%)

13.6.4 Turkey - Market size and forecast 2025-2030

Chart on Turkey - Market size and forecast 2025-2030 ($ million)
Data Table on Turkey - Market size and forecast 2025-2030 ($ million)
Chart on Turkey - Year-over-year growth 2025-2030 (%)
Data Table on Turkey - Year-over-year growth 2025-2030 (%)

13.6.5 Egypt - Market size and forecast 2025-2030

Chart on Egypt - Market size and forecast 2025-2030 ($ million)
Data Table on Egypt - Market size and forecast 2025-2030 ($ million)
Chart on Egypt - Year-over-year growth 2025-2030 (%)
Data Table on Egypt - Year-over-year growth 2025-2030 (%)

13.7 South America - Market size and forecast 2025-2030

Chart on South America - Market size and forecast 2025-2030 ($ million)
Data Table on South America - Market size and forecast 2025-2030 ($ million)
Chart on South America - Year-over-year growth 2025-2030 (%)
Data Table on South America - Year-over-year growth 2025-2030 (%)
Chart on Regional Comparison - South America
Data Table on Regional Comparison - South America

13.7.1 Brazil - Market size and forecast 2025-2030

Chart on Brazil - Market size and forecast 2025-2030 ($ million)
Data Table on Brazil - Market size and forecast 2025-2030 ($ million)
Chart on Brazil - Year-over-year growth 2025-2030 (%)
Data Table on Brazil - Year-over-year growth 2025-2030 (%)

13.7.2 Argentina - Market size and forecast 2025-2030

Chart on Argentina - Market size and forecast 2025-2030 ($ million)
Data Table on Argentina - Market size and forecast 2025-2030 ($ million)
Chart on Argentina - Year-over-year growth 2025-2030 (%)
Data Table on Argentina - Year-over-year growth 2025-2030 (%)

13.7.3 Colombia - Market size and forecast 2025-2030

Chart on Colombia - Market size and forecast 2025-2030 ($ million)
Data Table on Colombia - Market size and forecast 2025-2030 ($ million)
Chart on Colombia - Year-over-year growth 2025-2030 (%)
Data Table on Colombia - Year-over-year growth 2025-2030 (%)

13.8 Market opportunity by geography

Market opportunity by geography ($ million)
Data Tables on Market opportunity by geography ($ million)

14. Drivers, Challenges, and Opportunity

14.1 Market drivers

Increasing consumer demand for reduced-risk nicotine delivery systems
Progressive regulatory frameworks and harm reduction policies
Technological advancements in device efficiency and user experience

14.2 Market challenges

Fragmentation of global regulatory frameworks and intensifying flavor bans
High initial cost barriers and economic sensitivity in emerging markets
Technological competition and cannibalization from next-generation alternatives

14.3 Impact of drivers and challenges

Impact of drivers and challenges in 2025 and 2030

14.4 Market opportunities

Integration of advanced induction heating technology and smart connectivity
Strategic focus on sustainability and biodegradable consumables
Expansion of premiumization and boutique flavor portfolios

15. Competitive Landscape

15.1 Overview

15.2

Overview on criticality of inputs and factors of differentiation

15.3 Landscape disruption

Overview on factors of disruption

15.4 Industry risks

Impact of key risks on business

16. Competitive Analysis

16.1 Companies profiled

Companies covered

16.2 Company ranking index

16.3 Market positioning of companies

Matrix on companies position and classification

16.4 ALD Group Ltd

ALD Group Ltd - Overview
ALD Group Ltd - Product / Service
ALD Group Ltd - Key offerings
SWOT

16.5 British American Tobacco Plc

British American Tobacco Plc - Overview
British American Tobacco Plc - Business segments
British American Tobacco Plc - Key offerings
British American Tobacco Plc - Segment focus
SWOT

16.6 Buddy Technology Development

Buddy Technology Development - Overview
Buddy Technology Development - Product / Service
Buddy Technology Development - Key offerings
SWOT

16.7 CFU Group

CFU Group - Overview
CFU Group - Product / Service
CFU Group - Key offerings
SWOT

16.8 HiTaste Technology Co Ltd

HiTaste Technology Co Ltd - Overview
HiTaste Technology Co Ltd - Product / Service
HiTaste Technology Co Ltd - Key offerings
SWOT

16.9 Imperial Brands Plc

Imperial Brands Plc - Overview
Imperial Brands Plc - Business segments
Imperial Brands Plc - Key offerings
Imperial Brands Plc - Segment focus
SWOT

16.10 Japan Tobacco Inc.

Japan Tobacco Inc. - Overview
Japan Tobacco Inc. - Business segments
Japan Tobacco Inc. - Key offerings
Japan Tobacco Inc. - Segment focus
SWOT

16.11 Joecig Technology Co Ltd

Joecig Technology Co Ltd - Overview
Joecig Technology Co Ltd - Product / Service
Joecig Technology Co Ltd - Key offerings
SWOT

16.12 Kamry Technology Co Ltd

Kamry Technology Co Ltd - Overview
Kamry Technology Co Ltd - Product / Service
Kamry Technology Co Ltd - Key offerings
SWOT

16.13 KT and G Corp.

KT and G Corp. - Overview
KT and G Corp. - Business segments
KT and G Corp. - Key offerings
KT and G Corp. - Segment focus
SWOT

16.14 Lambda Smoke Inc

Lambda Smoke Inc - Overview
Lambda Smoke Inc - Product / Service
Lambda Smoke Inc - Key offerings
SWOT

16.15 Philip Morris International

Philip Morris International - Overview
Philip Morris International - Business segments
Philip Morris International - Key offerings
Philip Morris International - Segment focus
SWOT

16.16 Pluscig Technology Co Ltd

Pluscig Technology Co Ltd - Overview
Pluscig Technology Co Ltd - Product / Service
Pluscig Technology Co Ltd - Key offerings
SWOT

16.17 Shenzhen Kanger Technology

Shenzhen Kanger Technology - Overview
Shenzhen Kanger Technology - Product / Service
Shenzhen Kanger Technology - Key offerings
SWOT

16.18 SMOORE International Holdings

SMOORE International Holdings - Overview
SMOORE International Holdings - Product / Service
SMOORE International Holdings - Key offerings
SWOT

17. Appendix

17.1 Scope of the report

Market definition
Objectives
Notes and caveats

17.2 Inclusions and exclusions checklist

Inclusions checklist
Exclusions checklist

17.3 Currency conversion rates for US$

17.4 Research methodology

17.5 Data procurement

Information sources

17.6 Data validation

17.7 Validation techniques employed for market sizing

17.8 Data synthesis

17.9 360 degree market analysis

17.10 List of abbreviations

Research Methodology

Technavio presents a detailed picture of the market by way of study, synthesis, and summation of data from multiple sources. The analysts have presented the various facets of the market with a particular focus on identifying the key industry influencers. The data thus presented is comprehensive, reliable, and the result of extensive research, both primary and secondary.

INFORMATION SOURCES

Primary sources

  • Manufacturers and suppliers
  • Channel partners
  • Industry experts
  • Strategic decision makers

Secondary sources

  • Industry journals and periodicals
  • Government data
  • Financial reports of key industry players
  • Historical data
  • Press releases

DATA ANALYSIS

Data Synthesis

  • Collation of data
  • Estimation of key figures
  • Analysis of derived insights

Data Validation

  • Triangulation with data models
  • Reference against proprietary databases
  • Corroboration with industry experts

REPORT WRITING

Qualitative

  • Market drivers
  • Market challenges
  • Market trends
  • Five forces analysis

Quantitative

  • Market size and forecast
  • Market segmentation
  • Geographical insights
  • Competitive landscape

Interested in this report?

Get your sample now to see our research methodology and insights!

Download Now

Frequently Asked Questions

Heat-not-burn Tobacco Products market growth will increase by USD 214688.6 million during 2026-2030.

The Heat-not-burn Tobacco Products market is expected to grow at a CAGR of 45.2% during 2026-2030.

Heat-not-burn Tobacco Products market is segmented by Product (Devices, Capsules, Vaporizers) Distribution channel (Offline, Online) Flavor (Traditional tobacco, Mint, Fruit) End-user (Individuals, Commercial)

ALD Group Ltd, British American Tobacco Plc, Buddy Technology Development, CFU Group, HiTaste Technology Co Ltd, Imperial Brands Plc, ISMODJO Technology Co Ltd, Japan Tobacco Inc., Joecig Technology Co Ltd, Kamry Technology Co Ltd, KT and G Corp., Lambda Smoke Inc, Mysmok Electronic Technology, Philip Morris International, Pluscig Technology Co Ltd, Shenzhen Kanger Technology, SMISS Technology Co. Ltd., SMOORE International Holdings, Xomok Technology Co Ltd are a few of the key vendors in the Heat-not-burn Tobacco Products market.

APAC will register the highest growth rate of 49.9% among the other regions. Therefore, the Heat-not-burn Tobacco Products market in APAC is expected to garner significant business opportunities for the vendors during the forecast period.

Japan, South Korea, China, Indonesia, Philippines, Malaysia, Italy, Russia, Germany, UK, Poland, France, US, Canada, Mexico, Saudi Arabia, UAE, South Africa, Turkey, Egypt, Brazil, Argentina, Colombia

  • Increasing consumer demand for reduced-risk nicotine delivery systems is the driving factor this market.

The Heat-not-burn Tobacco Products market vendors should focus on grabbing business opportunities from the Product segment as it accounted for the largest market share in the base year.
RIA - Research AI Assistant
Ask RIA