
Greenhouse Horticulture Market Analysis, Size, and Forecast 2026-2030: Europe (The Netherlands, Spain, and Italy), North America (US, Canada, and Mexico), APAC (China, India, and South Korea), Middle East and Africa (Turkey, Saudi Arabia, and UAE), South America (Brazil, Argentina, and Chile), and Rest of World (ROW)

Greenhouse Horticulture Market Analysis, Size, and Forecast 2026-2030:
Europe (The Netherlands, Spain, and Italy), North America (US, Canada, and Mexico), APAC (China, India, and South Korea), Middle East and Africa (Turkey, Saudi Arabia, and UAE), South America (Brazil, Argentina, and Chile), and Rest of World (ROW)

Published: Nov 2026 298 Pages SKU: IRTNTR41076

Market Overview at a Glance

$14.11 B
Market Opportunity
8%
CAGR 2025 - 2030
55.3%
Europe Growth
$23.33 B
Plastic segment 2024

Greenhouse Horticulture Market Size 2026-2030

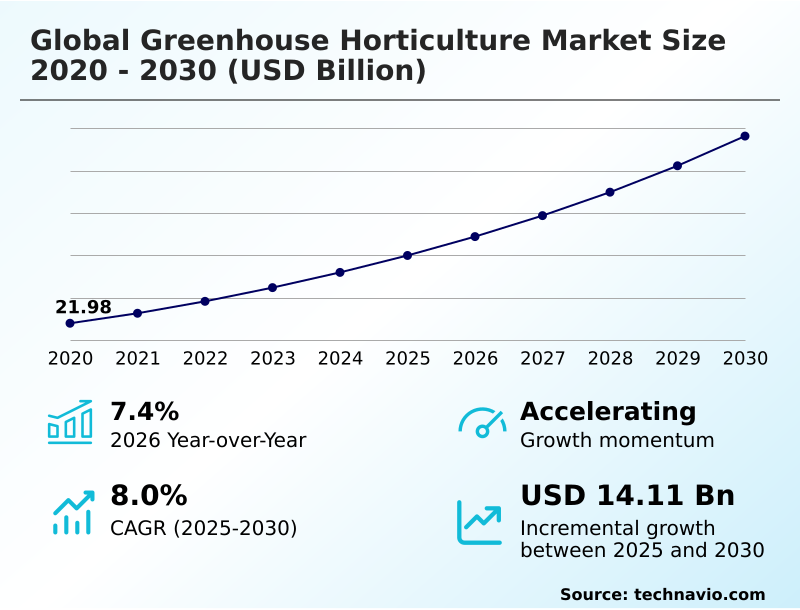
The greenhouse horticulture market size is valued to increase by USD 14.11 billion, at a CAGR of 8% from 2025 to 2030. Surging global consumer demand for year round local produce will drive the greenhouse horticulture market.

Major Market Trends & Insights

  • Europe dominated the market and accounted for a 55.3% growth during the forecast period.
  • By Product - Plastic segment was valued at USD 23.33 billion in 2024
  • By Crop Type - Fruits and vegetables segment accounted for the largest market revenue share in 2024

Market Size & Forecast

  • Market Opportunities: USD 22.12 billion
  • Market Future Opportunities: USD 14.11 billion
  • CAGR from 2025 to 2030 : 8%

Market Summary

  • The Greenhouse Horticulture Market demonstrates robust structural expansion as agricultural enterprises transition toward controlled environment agriculture to secure continuous food production. Driven by surging retail mandates for year-round pesticide free cultivation, commercial operators rapidly integrate automated microclimate computer networks and hydroponic fertigation loops to guarantee predictable supply chains.
  • Implementing closed loop ecosystems allows facilities to recirculate drainage water, ultimately achieving a 90% reduction in agricultural water footprints compared to traditional open-field flood techniques. A major operational driver is the rising frequency of severe weather anomalies, which compels large-scale vegetable producers to construct highly durable polycarbonate enclosures to protect vulnerable crop yields.
  • However, this technological transition is significantly constrained by elevated initial capital outlays for structural framing, dynamic LED spectrum modules, and thermal energy retention systems. Navigating volatile global energy tariffs further squeezes facility operating margins during high-demand winter seasons.
  • Consequently, major growers must balance massive upfront investments with the necessity of deploying smart shading screens and automated nutrient dosing systems to maximize long-term spatial efficiency and crop profitability.

What will be the Size of the Greenhouse Horticulture Market during the forecast period?
Get Key Insights on Market Forecast (PDF) Get Free Sample

How is the Greenhouse Horticulture Market Segmented?

The greenhouse horticulture industry research report provides comprehensive data (region-wise segment analysis), with forecasts and estimates in "USD million" for the period 2026-2030, as well as historical data from 2020-2024 for the following segments.

  • Product
    • Plastic
    • Glass
  • Crop type
    • Fruits and vegetables
    • Nursery crops
    • Flowers and ornamentals
    • Others
  • Technology
    • Hydroponics
    • Aeroponics
    • Aquaponics
    • Vertical farming
    • Others
  • Geography
    • Europe
      • The Netherlands
      • Spain
      • Italy
      • Germany
      • France
      • UK
    • North America
      • US
      • Canada
      • Mexico
    • APAC
      • China
      • India
      • South Korea
      • Japan
      • Indonesia
      • Australia
    • Middle East and Africa
      • Turkey
      • Saudi Arabia
      • UAE
      • Israel
      • South Africa
    • South America
      • Brazil
      • Argentina
      • Chile

By Product Insights

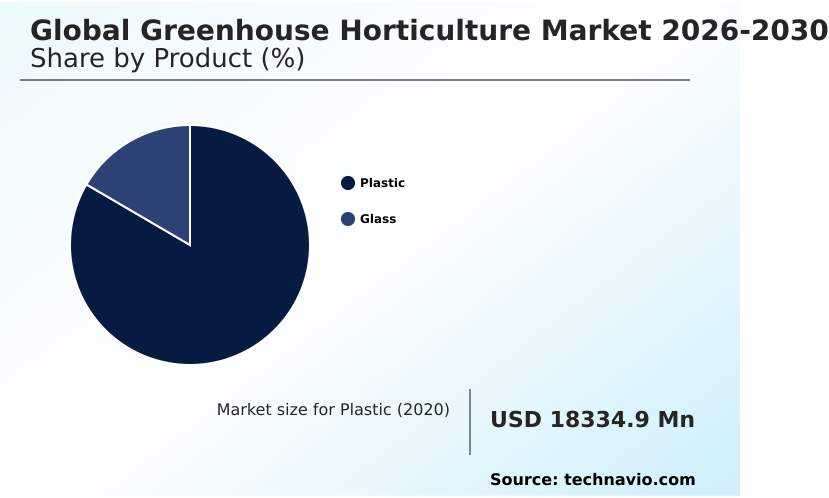
The plastic segment is estimated to witness significant growth during the forecast period.

The plastic segment within the Greenhouse Horticulture Market commands the leading operational volume due to its economical structural deployment and superior impact resistance.

Commercial growers increasingly transition to multi layer flexible low density polyethylene films to maintain precise microclimate uniformity across expansive cultivation zones.

These advanced covers integrate ultraviolet light stabilizers and heat activated dynamic shade coatings to reflect excess solar radiation, effectively optimizing photosynthetic active radiation for dense plant canopies.

By utilizing lightweight polycarbonate cladding panels, facilities can expand structurally without requiring heavy internal supports, thereby improving spatial efficiency by 15%. This structural flexibility facilitates rapid installation of automated microclimate computer systems and precision drip irrigation networks.

Consequently, agricultural enterprises can achieve year round crop production while maintaining strict environmental regulations and mitigating the risks associated with sudden extreme weather events.
Get Free Sample

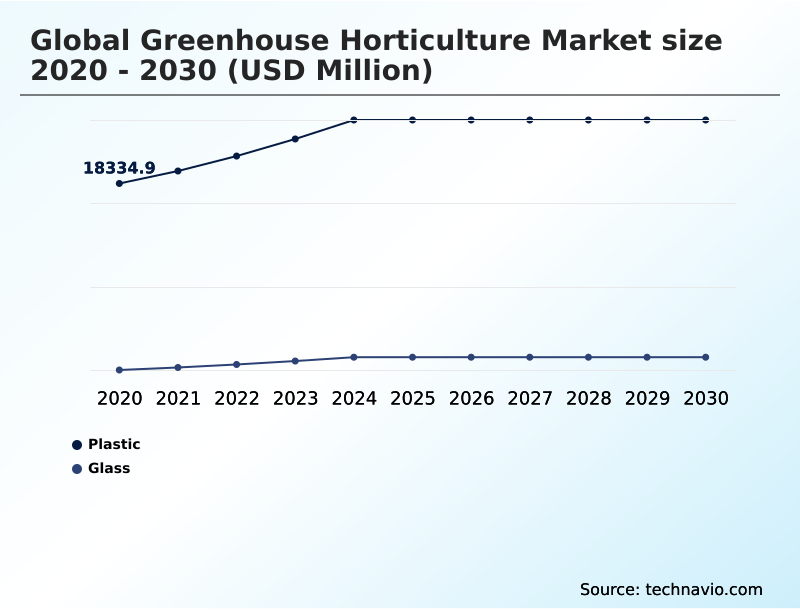
The Plastic segment was valued at USD 23.33 billion in 2024 and showed a gradual increase during the forecast period.
Get Free Sample

Regional Analysis

Europe is estimated to contribute 55.3% to the growth of the global market during the forecast period.Technavio’s analysts have elaborately explained the regional trends and drivers that shape the market during the forecast period.
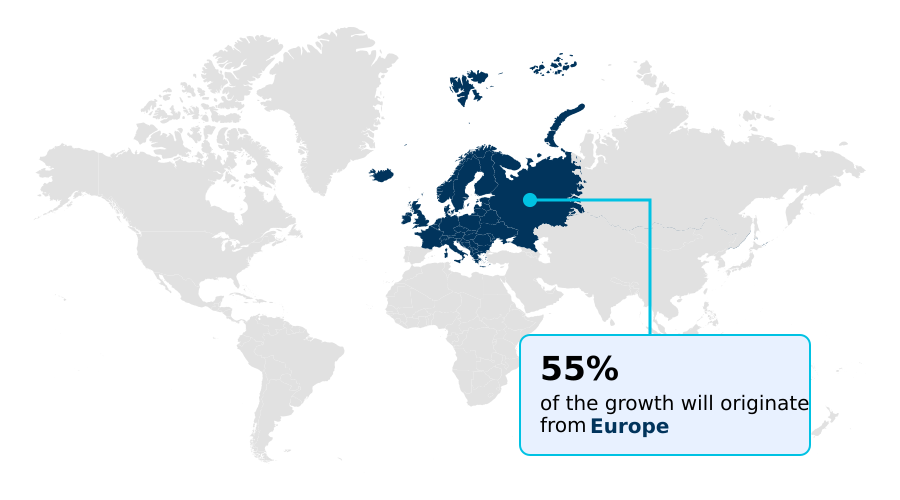
See How Greenhouse Horticulture Market Demand is Rising in Europe Get Free Sample

The geographic adoption within the Greenhouse Horticulture Market varies significantly due to diverse climate pressures, governmental sustainability mandates, and available urban space.

Europe maintains a highly mature infrastructure base where strict environmental regulations and zero microplastic waste directives compel facilities to achieve a 95% adoption rate of closed loop hydroponics and sustainable biomaterial integration.

Conversely, APAC exhibits the most rapid deployment of high density vertical setups, driven by severe arable land constraints and expanding urban populations, resulting in a 40% faster facility construction pace compared to North America.

Across North America, extreme weather protection requirements and severe drought have triggered a 35% increase in automated nutrient dosing and precision drip irrigation installations.

These regional contrasts highlight how localized resource scarcity dictates the integration of automated structural ventilation and automated data interoperability to optimize yield economics.

Market Dynamics

Our researchers analyzed the data with 2025 as the base year, along with the key drivers, trends, and challenges. A holistic analysis of drivers will help companies refine their marketing strategies to gain a competitive advantage.

  • The commercial development of the Greenhouse Horticulture Market heavily relies on integrating sophisticated infrastructure to stabilize volatile agricultural supply chains and meet rigorous retailer compliance standards. High tech venlo glasshouse structures form the architectural foundation for large-scale operations, utilizing high transmittance double glazed glasshouses and extreme weather resilient greenhouse panels to shield crops from catastrophic environmental damage.
  • Within these robust enclosures, automated AI driven climate control systems and advanced microclimate humidity management software orchestrate daily environmental adjustments. This dynamic capability improves supply chain predictability by ensuring continuous yield generation regardless of external weather patterns.
  • To maximize resource utilization, facilities deploy closed loop hydroponic irrigation loops alongside precision root zone EC monitoring, which collectively execute sustainable agricultural water conservation methods that vastly outperform conventional open-field watering techniques. Modern operations also mandate energy efficient thermal screen deployment and heat activated dynamic shade coatings to regulate internal temperatures without excessive utility expenditure.
  • Furthermore, the integration of UV stabilized agricultural plastic film offers cost-effective microclimate protection for mid-tier growers transitioning into controlled environment sectors. To mitigate chronic labor shortages, top-tier producers implement autonomous harvesting robotic gantry systems and AI powered canopy monitoring sensors.
  • Meanwhile, structural material sustainability is addressed through the adoption of compostable greenhouse crop support components and recirculating aquaponic bio filtration systems. The continuous expansion of automated greenhouse vertical farming racks allows urban producers to achieve unmatched spatial efficiency, ensuring consistent multi-seasonal output for demanding retail buyers.
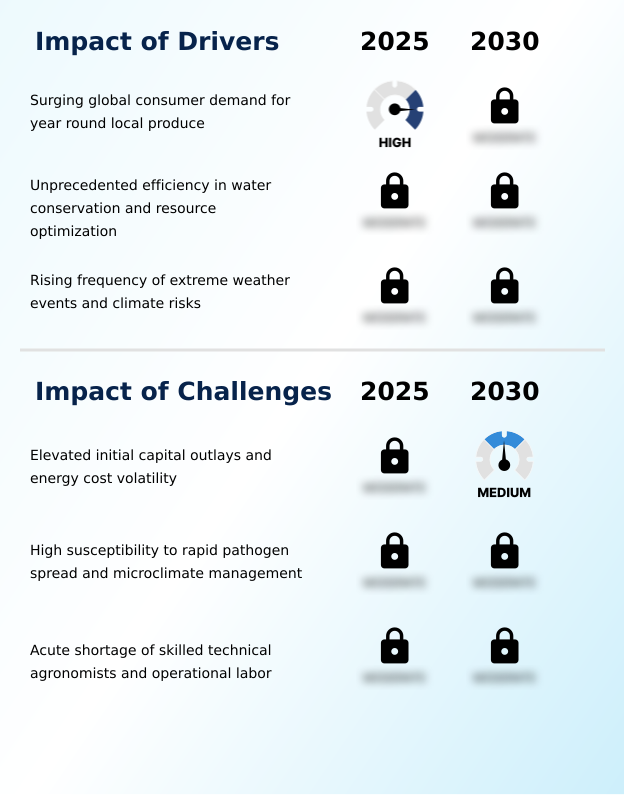
What are the key market drivers leading to the rise in the adoption of Greenhouse Horticulture Industry?

  • Surging consumer demand for reliable, year-round local produce serves as the primary driver propelling continuous market expansion.

  • Surging retail demand for reliable, pesticide free cultivation fundamentally drives structural expansion within the Greenhouse Horticulture Market.
  • Because open-field supply chains suffer frequent disruptions, major distributors mandate consistent agricultural deliveries, compelling commercial producers to adopt advanced micro irrigation and nutrient film technique networks.
  • Operating within protected environments utilizing rockwool growing media entirely eliminates soil-borne pathogens, enabling growers to reduce chemical intervention costs by 40%.
  • The necessity to conserve rapidly depleting groundwater reserves heavily pushes facilities to install dielectric root sensors and execute closed loop hydroponic fertigation loops.
  • These water-recycling frameworks elevate overall water use efficiency by nearly 85% compared to traditional farming, allowing modern producers to secure long-term purchase contracts through unparalleled operational sustainability.

What are the market trends shaping the Greenhouse Horticulture Industry?

  • The rapid integration of artificial intelligence-driven autonomous climate and irrigation controls represents a defining technological trend shaping the market.

  • The technological advancement of the Greenhouse Horticulture Market is defined by a rapid operational shift toward artificial intelligence crop software and automated plant telemetry. To overcome unpredictable outdoor climatic patterns, commercial agricultural facilities aggressively deploy autonomous crop steering platforms to continuously analyze and adjust the vapor pressure deficit.
  • This transition toward intelligent data frameworks allows facility managers to reduce daily manual monitoring requirements by 30% while simultaneously improving overall harvest volume accuracy by 22%. The strategic integration of automated data interoperability across diverse equipment suites ensures that recirculating aquaculture filtration arrays and variable spectrum illumination systems communicate seamlessly.
  • Consequently, these synchronized digital ecosystems allow modern agricultural producers to maximize biological pest suppression and ensure continuous high-yield delivery capabilities regardless of shifting external environmental variables.

What challenges does the Greenhouse Horticulture Industry face during its growth?

  • Elevated initial capital outlays and continuous energy cost volatility constitute the primary operational challenges constraining industry expansion.

  • Extensive financial constraints and extreme microclimate vulnerabilities pose severe operational barriers within the Greenhouse Horticulture Market. Constructing high-density facilities mandates extraordinary initial capital for structural load requirements, automated ebb and flow benches, and supplemental assimilation lights. These massive upfront expenditures frequently delay facility expansion projects by up to 18% across volatile economic environments.
  • Furthermore, maintaining precise microclimate uniformity within enclosed canopies is biologically precarious. If high pressure fogging modules or root zone oxygenation systems experience mechanical failure, devastating fungal pathogens spread exponentially across dense cultivation rows.
  • Managing continuous thermal energy demands and navigating sudden tariff spikes directly compresses profit margins, forcing facilities to meticulously optimize every thermochromic polymer coatings application to avoid a 15% reduction in overall operating revenue.

Exclusive Technavio Analysis on Customer Landscape

The greenhouse horticulture market forecasting report includes the adoption lifecycle of the market, covering from the innovator’s stage to the laggard’s stage. It focuses on adoption rates in different regions based on penetration. Furthermore, the greenhouse horticulture market report also includes key purchase criteria and drivers of price sensitivity to help companies evaluate and develop their market growth analysis strategies.
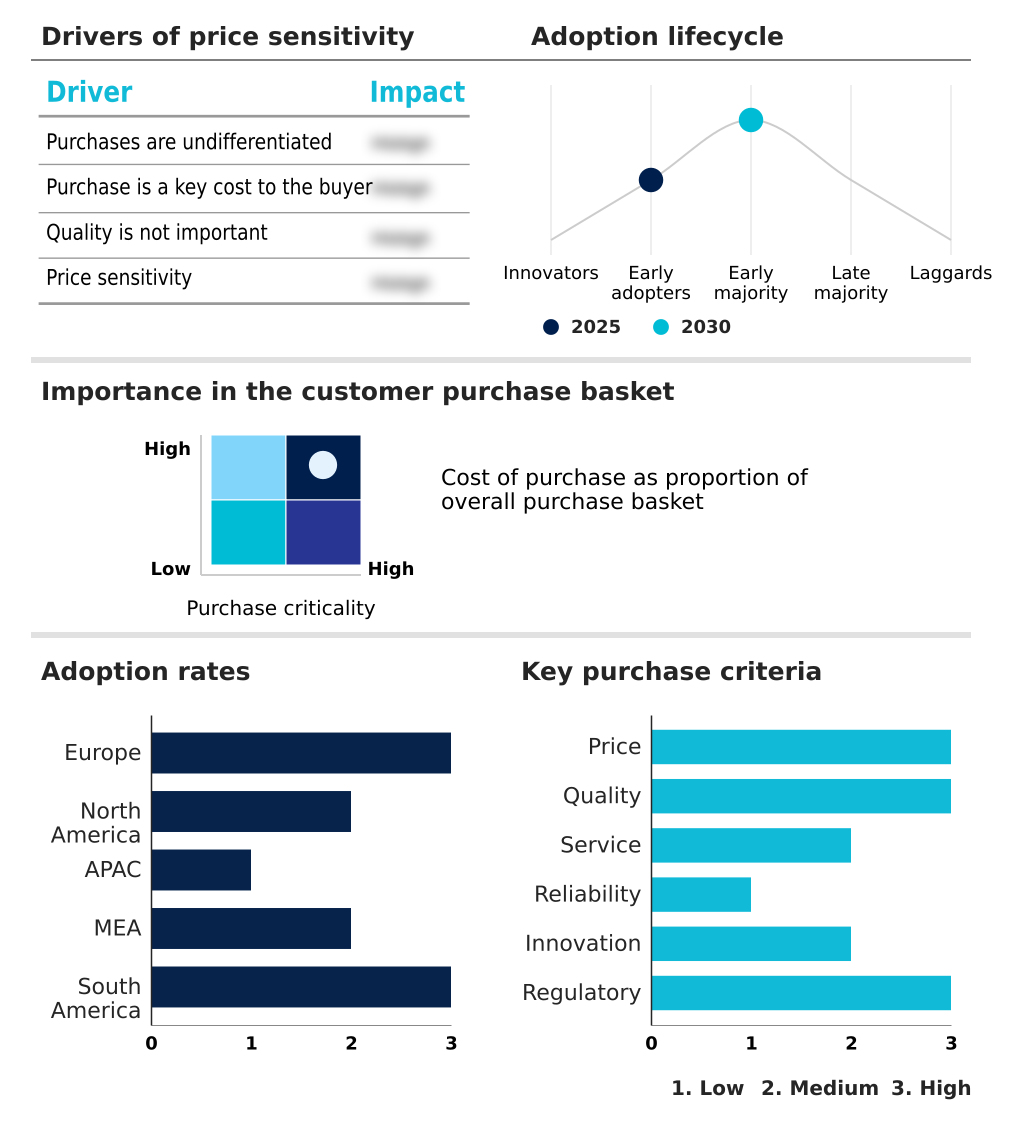
Customer Landscape of Greenhouse Horticulture Industry

Competitive Landscape

Companies are implementing various strategies, such as strategic alliances, greenhouse horticulture market forecast, partnerships, mergers and acquisitions, geographical expansion, and product/service launches, to enhance their presence in the industry.

AB Ludvig Svensson - The unified service portfolio delivers specialized climate control screens and advanced light diffusion textiles designed to optimize environmental parameters and enhance crop productivity in commercial high-tech agricultural facilities.

The industry research and growth report includes detailed analyses of the competitive landscape of the market and information about key companies, including:

  • AB Ludvig Svensson
  • Agrolux
  • Argus Control Systems Ltd.
  • Certhon Build B.V.
  • Dalsem Greenhouse Projects BV
  • De Gier Drive Systems
  • Debets Schalke
  • Fluence
  • Grodan
  • Hoogendoorn Growth Management
  • Hortiplan BV
  • KUBO Group
  • LOGIQS B.V.
  • Metazet
  • Netafim Ltd.
  • P.L. Light Systems
  • Prins Group
  • Ridder Drive Systems BV
  • Signify NV
  • Van der Hoeven

Qualitative and quantitative analysis of companies has been conducted to help clients understand the wider business environment as well as the strengths and weaknesses of key industry players. Data is qualitatively analyzed to categorize companies as pure play, category-focused, industry-focused, and diversified; it is quantitatively analyzed to categorize companies as dominant, leading, strong, tentative, and weak.

Recent Development and News in Greenhouse horticulture market

  • In the Building Products industry, the widespread adoption of high transmittance double glazed glasshouses improved thermal heating networks, directly impacting Greenhouse Horticulture Market demand by reducing cold climate energy consumption by 25%.
  • Stringent circular economy directives on commercial construction materials accelerated sustainable biomaterial integration, compelling the Greenhouse Horticulture Market to replace synthetic bindings with bio based compostable clips to eliminate zero microplastic waste.
  • The commercial scale deployment of automated structural ventilation systems within advanced warehousing logistics enhanced precise atmospheric humidity control, which subsequently enabled the Greenhouse Horticulture Market to decrease fungal pathogen spread by 18%.
  • Advancements in extreme weather protection coatings for heavy commercial roofing applications created highly durable UV stabilized agricultural plastic film variants, driving Greenhouse Horticulture Market adoption to shield valuable crops from severe hailstorm damage.

Dive into Technavio’s robust research methodology, blending expert interviews, extensive data synthesis, and validated models for unparalleled Greenhouse Horticulture Market insights. See full methodology.

Market Scope
Page number 298
Base year 2025
Historic period 2020-2024
Forecast period 2026-2030
Growth momentum & CAGR Accelerate at a CAGR of 8%
Market growth 2026-2030 USD 14110.8 million
Market structure Fragmented
YoY growth 2025-2026(%) 7.4%
Key countries The Netherlands, Spain, Italy, Germany, France, UK, US, Canada, Mexico, China, India, South Korea, Japan, Indonesia, Australia, Turkey, Saudi Arabia, UAE, Israel, South Africa, Brazil, Argentina and Chile
Competitive landscape Leading Companies, Market Positioning of Companies, Competitive Strategies, and Industry Risks

Request Free Sample

Research Analyst Overview

  • The Greenhouse Horticulture Market continuously evolves as agricultural operators adopt highly specialized closed loop hydroponics to combat systemic resource scarcity. To stabilize fragile supply chains, facility managers heavily invest in automated microclimate computer technology and dynamic LED spectrum arrays to perfectly orchestrate plant growth cycles.
  • Strategic deployment of smart glass coatings and thermal energy retention systems allows operators to lower massive utility expenditures and align facility infrastructure with rigorous international sustainability standards. Transitioning to these autonomous frameworks yields immediate operational benefits, as early adopters record a 25% decrease in overall resource wastage.
  • The integration of automated harvesting robotics directly addresses chronic labor deficits, ensuring precise and uninterrupted crop collection. Furthermore, utilizing deep water culture and evaporative cooling pads maintains an optimal vapor pressure deficit, minimizing the risk of localized biological pathogen outbreaks.
  • These synchronized technological upgrades empower commercial farming enterprises to decouple their financial performance from unpredictable external climate patterns, guaranteeing reliable delivery volumes for high-value agricultural commodities across urban hubs.

What are the Key Data Covered in this Greenhouse Horticulture Market Research and Growth Report?

  • What is the expected growth of the Greenhouse Horticulture Market between 2026 and 2030?

    • USD 14.11 billion, at a CAGR of 8%

  • What segmentation does the market report cover?

    • The report is segmented by Product (Plastic, and Glass), Crop Type (Fruits and vegetables, Nursery crops, Flowers and ornamentals, and Others), Technology (Hydroponics, Aeroponics, Aquaponics, Vertical farming, and Others) and Geography (Europe, North America, APAC, Middle East and Africa, South America)

  • Which regions are analyzed in the report?

    • Europe, North America, APAC, Middle East and Africa and South America

  • What are the key growth drivers and market challenges?

    • Surging global consumer demand for year round local produce, Elevated initial capital outlays and energy cost volatility

  • Who are the major players in the Greenhouse Horticulture Market?

    • AB Ludvig Svensson, Agrolux, Argus Control Systems Ltd., Certhon Build B.V., Dalsem Greenhouse Projects BV, De Gier Drive Systems, Debets Schalke, Fluence, Grodan, Hoogendoorn Growth Management, Hortiplan BV, KUBO Group, LOGIQS B.V., Metazet, Netafim Ltd., P.L. Light Systems, Prins Group, Ridder Drive Systems BV, Signify NV and Van der Hoeven

Market Research Insights

  • The Greenhouse Horticulture Market is rapidly evolving as commercial agricultural operators adopt controlled environment agriculture to stabilize volatile fresh produce supply chains. By integrating automated plant telemetry and advanced micro irrigation frameworks, high-tech facilities have successfully improved water use efficiency by 85% relative to conventional field farming.
  • Furthermore, the strategic deployment of artificial intelligence crop software enhances harvest predictability and minimizes crop stress mitigation, boosting overall yield volumes by nearly 40% in densely populated urban centers. Driven by strict environmental regulations mandating sustainable agriculture initiatives, growers continuously upgrade thermal heating networks to lower energy consumption by 20%.
  • These precise environmental optimizations enable reliable year round crop production while systematically reducing operational overhead across diverse climatic zones.

We can help! Our analysts can customize this greenhouse horticulture market research report to meet your requirements.

Get in touch

1. Executive Summary

1.1 Market overview

Executive Summary - Chart on Market Overview
Executive Summary - Data Table on Market Overview
Executive Summary - Chart on Global Market Characteristics
Executive Summary - Chart on Market by Geography
Executive Summary - Chart on Market Segmentation by Product
Executive Summary - Chart on Market Segmentation by Crop Type
Executive Summary - Chart on Market Segmentation by Technology
Executive Summary - Chart on Incremental Growth
Executive Summary - Data Table on Incremental Growth
Executive Summary - Chart on Company Market Positioning

2. Technavio Analysis

2.1 Analysis of price sensitivity, lifecycle, customer purchase basket, adoption rates, and purchase criteria

2.2 Criticality of inputs and Factors of differentiation

Chart on Overview on criticality of inputs and factors of differentiation

2.3 Factors of disruption

Chart on Overview on factors of disruption

2.4 Impact of drivers and challenges

Chart on Impact of drivers and challenges in 2025 and 2030

3. Market Landscape

3.1 Market ecosystem

Chart on Parent Market
Data Table on - Parent Market

3.2 Market characteristics

Chart on Market characteristics analysis

3.3 Value chain analysis

Chart on Value chain analysis

4. Market Sizing

4.1 Market definition

Data Table on Offerings of companies included in the market definition

4.2 Market segment analysis

Market segments

4.3 Market size 2025

4.4 Market outlook: Forecast for 2025-2030

Chart on Global - Market size and forecast 2025-2030 ($ million)
Data Table on Global - Market size and forecast 2025-2030 ($ million)
Chart on Global Market: Year-over-year growth 2025-2030 (%)
Data Table on Global Market: Year-over-year growth 2025-2030 (%)

5. Historic Market Size

5.1 Global Greenhouse Horticulture Market 2020 - 2024

Historic Market Size - Data Table on Global Greenhouse Horticulture Market 2020 - 2024 ($ million)

5.2 Product segment analysis 2020 - 2024

Historic Market Size - Product Segment 2020 - 2024 ($ million)

5.3 Crop Type segment analysis 2020 - 2024

Historic Market Size - Crop Type Segment 2020 - 2024 ($ million)

5.4 Technology segment analysis 2020 - 2024

Historic Market Size - Technology Segment 2020 - 2024 ($ million)

5.5 Geography segment analysis 2020 - 2024

Historic Market Size - Geography Segment 2020 - 2024 ($ million)

5.6 Country segment analysis 2020 - 2024

Historic Market Size - Country Segment 2020 - 2024 ($ million)

6. Qualitative Analysis

6.1 Impact of AI on global greenhouse horticulture market

6.2 Impact of geopolitical conflicts on global greenhouse horticulture market

7. Five Forces Analysis

7.1 Five forces summary

Five forces analysis - Comparison between 2025 and 2030

7.2 Bargaining power of buyers

Bargaining power of buyers - Impact of key factors 2025 and 2030

7.3 Bargaining power of suppliers

Bargaining power of suppliers - Impact of key factors in 2025 and 2030

7.4 Threat of new entrants

Threat of new entrants - Impact of key factors in 2025 and 2030

7.5 Threat of substitutes

Threat of substitutes - Impact of key factors in 2025 and 2030

7.6 Threat of rivalry

Threat of rivalry - Impact of key factors in 2025 and 2030

7.7 Market condition

Chart on Market condition - Five forces 2025 and 2030

8. Market Segmentation by Product

8.1 Market segments

Chart on Product - Market share 2025-2030 (%)
Data Table on Product - Market share 2025-2030 (%)

8.2 Comparison by Product

Chart on Comparison by Product
Data Table on Comparison by Product

8.3 Plastic - Market size and forecast 2025-2030

Chart on Plastic - Market size and forecast 2025-2030 ($ million)
Data Table on Plastic - Market size and forecast 2025-2030 ($ million)
Chart on Plastic - Year-over-year growth 2025-2030 (%)
Data Table on Plastic - Year-over-year growth 2025-2030 (%)

8.4 Glass - Market size and forecast 2025-2030

Chart on Glass - Market size and forecast 2025-2030 ($ million)
Data Table on Glass - Market size and forecast 2025-2030 ($ million)
Chart on Glass - Year-over-year growth 2025-2030 (%)
Data Table on Glass - Year-over-year growth 2025-2030 (%)

8.5 Market opportunity by Product

Market opportunity by Product ($ million)
Data Table on Market opportunity by Product ($ million)

9. Market Segmentation by Crop Type

9.1 Market segments

Chart on Crop Type - Market share 2025-2030 (%)
Data Table on Crop Type - Market share 2025-2030 (%)

9.2 Comparison by Crop Type

Chart on Comparison by Crop Type
Data Table on Comparison by Crop Type

9.3 Fruits and vegetables - Market size and forecast 2025-2030

Chart on Fruits and vegetables - Market size and forecast 2025-2030 ($ million)
Data Table on Fruits and vegetables - Market size and forecast 2025-2030 ($ million)
Chart on Fruits and vegetables - Year-over-year growth 2025-2030 (%)
Data Table on Fruits and vegetables - Year-over-year growth 2025-2030 (%)

9.4 Nursery crops - Market size and forecast 2025-2030

Chart on Nursery crops - Market size and forecast 2025-2030 ($ million)
Data Table on Nursery crops - Market size and forecast 2025-2030 ($ million)
Chart on Nursery crops - Year-over-year growth 2025-2030 (%)
Data Table on Nursery crops - Year-over-year growth 2025-2030 (%)

9.5 Flowers and ornamentals - Market size and forecast 2025-2030

Chart on Flowers and ornamentals - Market size and forecast 2025-2030 ($ million)
Data Table on Flowers and ornamentals - Market size and forecast 2025-2030 ($ million)
Chart on Flowers and ornamentals - Year-over-year growth 2025-2030 (%)
Data Table on Flowers and ornamentals - Year-over-year growth 2025-2030 (%)

9.6 Others - Market size and forecast 2025-2030

Chart on Others - Market size and forecast 2025-2030 ($ million)
Data Table on Others - Market size and forecast 2025-2030 ($ million)
Chart on Others - Year-over-year growth 2025-2030 (%)
Data Table on Others - Year-over-year growth 2025-2030 (%)

9.7 Market opportunity by Crop Type

Market opportunity by Crop Type ($ million)
Data Table on Market opportunity by Crop Type ($ million)

10. Market Segmentation by Technology

10.1 Market segments

Chart on Technology - Market share 2025-2030 (%)
Data Table on Technology - Market share 2025-2030 (%)

10.2 Comparison by Technology

Chart on Comparison by Technology
Data Table on Comparison by Technology

10.3 Hydroponics - Market size and forecast 2025-2030

Chart on Hydroponics - Market size and forecast 2025-2030 ($ million)
Data Table on Hydroponics - Market size and forecast 2025-2030 ($ million)
Chart on Hydroponics - Year-over-year growth 2025-2030 (%)
Data Table on Hydroponics - Year-over-year growth 2025-2030 (%)

10.4 Aeroponics - Market size and forecast 2025-2030

Chart on Aeroponics - Market size and forecast 2025-2030 ($ million)
Data Table on Aeroponics - Market size and forecast 2025-2030 ($ million)
Chart on Aeroponics - Year-over-year growth 2025-2030 (%)
Data Table on Aeroponics - Year-over-year growth 2025-2030 (%)

10.5 Aquaponics - Market size and forecast 2025-2030

Chart on Aquaponics - Market size and forecast 2025-2030 ($ million)
Data Table on Aquaponics - Market size and forecast 2025-2030 ($ million)
Chart on Aquaponics - Year-over-year growth 2025-2030 (%)
Data Table on Aquaponics - Year-over-year growth 2025-2030 (%)

10.6 Vertical farming - Market size and forecast 2025-2030

Chart on Vertical farming - Market size and forecast 2025-2030 ($ million)
Data Table on Vertical farming - Market size and forecast 2025-2030 ($ million)
Chart on Vertical farming - Year-over-year growth 2025-2030 (%)
Data Table on Vertical farming - Year-over-year growth 2025-2030 (%)

10.7 Others - Market size and forecast 2025-2030

Chart on Others - Market size and forecast 2025-2030 ($ million)
Data Table on Others - Market size and forecast 2025-2030 ($ million)
Chart on Others - Year-over-year growth 2025-2030 (%)
Data Table on Others - Year-over-year growth 2025-2030 (%)

10.8 Market opportunity by Technology

Market opportunity by Technology ($ million)
Data Table on Market opportunity by Technology ($ million)

11. Customer Landscape

11.1 Customer landscape overview

Analysis of price sensitivity, lifecycle, customer purchase basket, adoption rates, and purchase criteria

12. Geographic Landscape

12.1 Geographic segmentation

Chart on Market share by geography 2025-2030 (%)
Data Table on Market share by geography 2025-2030 (%)

12.2 Geographic comparison

Chart on Geographic comparison
Data Table on Geographic comparison

12.3 Europe - Market size and forecast 2025-2030

Chart on Europe - Market size and forecast 2025-2030 ($ million)
Data Table on Europe - Market size and forecast 2025-2030 ($ million)
Chart on Europe - Year-over-year growth 2025-2030 (%)
Data Table on Europe - Year-over-year growth 2025-2030 (%)
Chart on Regional Comparison - Europe
Data Table on Regional Comparison - Europe

12.3.1 The Netherlands - Market size and forecast 2025-2030

Chart on The Netherlands - Market size and forecast 2025-2030 ($ million)
Data Table on The Netherlands - Market size and forecast 2025-2030 ($ million)
Chart on The Netherlands - Year-over-year growth 2025-2030 (%)
Data Table on The Netherlands - Year-over-year growth 2025-2030 (%)

12.3.2 Spain - Market size and forecast 2025-2030

Chart on Spain - Market size and forecast 2025-2030 ($ million)
Data Table on Spain - Market size and forecast 2025-2030 ($ million)
Chart on Spain - Year-over-year growth 2025-2030 (%)
Data Table on Spain - Year-over-year growth 2025-2030 (%)

12.3.3 Italy - Market size and forecast 2025-2030

Chart on Italy - Market size and forecast 2025-2030 ($ million)
Data Table on Italy - Market size and forecast 2025-2030 ($ million)
Chart on Italy - Year-over-year growth 2025-2030 (%)
Data Table on Italy - Year-over-year growth 2025-2030 (%)

12.3.4 Germany - Market size and forecast 2025-2030

Chart on Germany - Market size and forecast 2025-2030 ($ million)
Data Table on Germany - Market size and forecast 2025-2030 ($ million)
Chart on Germany - Year-over-year growth 2025-2030 (%)
Data Table on Germany - Year-over-year growth 2025-2030 (%)

12.3.5 France - Market size and forecast 2025-2030

Chart on France - Market size and forecast 2025-2030 ($ million)
Data Table on France - Market size and forecast 2025-2030 ($ million)
Chart on France - Year-over-year growth 2025-2030 (%)
Data Table on France - Year-over-year growth 2025-2030 (%)

12.3.6 UK - Market size and forecast 2025-2030

Chart on UK - Market size and forecast 2025-2030 ($ million)
Data Table on UK - Market size and forecast 2025-2030 ($ million)
Chart on UK - Year-over-year growth 2025-2030 (%)
Data Table on UK - Year-over-year growth 2025-2030 (%)

12.4 North America - Market size and forecast 2025-2030

Chart on North America - Market size and forecast 2025-2030 ($ million)
Data Table on North America - Market size and forecast 2025-2030 ($ million)
Chart on North America - Year-over-year growth 2025-2030 (%)
Data Table on North America - Year-over-year growth 2025-2030 (%)
Chart on Regional Comparison - North America
Data Table on Regional Comparison - North America

12.4.1 US - Market size and forecast 2025-2030

Chart on US - Market size and forecast 2025-2030 ($ million)
Data Table on US - Market size and forecast 2025-2030 ($ million)
Chart on US - Year-over-year growth 2025-2030 (%)
Data Table on US - Year-over-year growth 2025-2030 (%)

12.4.2 Canada - Market size and forecast 2025-2030

Chart on Canada - Market size and forecast 2025-2030 ($ million)
Data Table on Canada - Market size and forecast 2025-2030 ($ million)
Chart on Canada - Year-over-year growth 2025-2030 (%)
Data Table on Canada - Year-over-year growth 2025-2030 (%)

12.4.3 Mexico - Market size and forecast 2025-2030

Chart on Mexico - Market size and forecast 2025-2030 ($ million)
Data Table on Mexico - Market size and forecast 2025-2030 ($ million)
Chart on Mexico - Year-over-year growth 2025-2030 (%)
Data Table on Mexico - Year-over-year growth 2025-2030 (%)

12.5 APAC - Market size and forecast 2025-2030

Chart on APAC - Market size and forecast 2025-2030 ($ million)
Data Table on APAC - Market size and forecast 2025-2030 ($ million)
Chart on APAC - Year-over-year growth 2025-2030 (%)
Data Table on APAC - Year-over-year growth 2025-2030 (%)
Chart on Regional Comparison - APAC
Data Table on Regional Comparison - APAC

12.5.1 China - Market size and forecast 2025-2030

Chart on China - Market size and forecast 2025-2030 ($ million)
Data Table on China - Market size and forecast 2025-2030 ($ million)
Chart on China - Year-over-year growth 2025-2030 (%)
Data Table on China - Year-over-year growth 2025-2030 (%)

12.5.2 India - Market size and forecast 2025-2030

Chart on India - Market size and forecast 2025-2030 ($ million)
Data Table on India - Market size and forecast 2025-2030 ($ million)
Chart on India - Year-over-year growth 2025-2030 (%)
Data Table on India - Year-over-year growth 2025-2030 (%)

12.5.3 South Korea - Market size and forecast 2025-2030

Chart on South Korea - Market size and forecast 2025-2030 ($ million)
Data Table on South Korea - Market size and forecast 2025-2030 ($ million)
Chart on South Korea - Year-over-year growth 2025-2030 (%)
Data Table on South Korea - Year-over-year growth 2025-2030 (%)

12.5.4 Japan - Market size and forecast 2025-2030

Chart on Japan - Market size and forecast 2025-2030 ($ million)
Data Table on Japan - Market size and forecast 2025-2030 ($ million)
Chart on Japan - Year-over-year growth 2025-2030 (%)
Data Table on Japan - Year-over-year growth 2025-2030 (%)

12.5.5 Indonesia - Market size and forecast 2025-2030

Chart on Indonesia - Market size and forecast 2025-2030 ($ million)
Data Table on Indonesia - Market size and forecast 2025-2030 ($ million)
Chart on Indonesia - Year-over-year growth 2025-2030 (%)
Data Table on Indonesia - Year-over-year growth 2025-2030 (%)

12.5.6 Australia - Market size and forecast 2025-2030

Chart on Australia - Market size and forecast 2025-2030 ($ million)
Data Table on Australia - Market size and forecast 2025-2030 ($ million)
Chart on Australia - Year-over-year growth 2025-2030 (%)
Data Table on Australia - Year-over-year growth 2025-2030 (%)

12.6 Middle East and Africa - Market size and forecast 2025-2030

Chart on Middle East and Africa - Market size and forecast 2025-2030 ($ million)
Data Table on Middle East and Africa - Market size and forecast 2025-2030 ($ million)
Chart on Middle East and Africa - Year-over-year growth 2025-2030 (%)
Data Table on Middle East and Africa - Year-over-year growth 2025-2030 (%)
Chart on Regional Comparison - Middle East and Africa
Data Table on Regional Comparison - Middle East and Africa

12.6.1 Turkey - Market size and forecast 2025-2030

Chart on Turkey - Market size and forecast 2025-2030 ($ million)
Data Table on Turkey - Market size and forecast 2025-2030 ($ million)
Chart on Turkey - Year-over-year growth 2025-2030 (%)
Data Table on Turkey - Year-over-year growth 2025-2030 (%)

12.6.2 Saudi Arabia - Market size and forecast 2025-2030

Chart on Saudi Arabia - Market size and forecast 2025-2030 ($ million)
Data Table on Saudi Arabia - Market size and forecast 2025-2030 ($ million)
Chart on Saudi Arabia - Year-over-year growth 2025-2030 (%)
Data Table on Saudi Arabia - Year-over-year growth 2025-2030 (%)

12.6.3 UAE - Market size and forecast 2025-2030

Chart on UAE - Market size and forecast 2025-2030 ($ million)
Data Table on UAE - Market size and forecast 2025-2030 ($ million)
Chart on UAE - Year-over-year growth 2025-2030 (%)
Data Table on UAE - Year-over-year growth 2025-2030 (%)

12.6.4 Israel - Market size and forecast 2025-2030

Chart on Israel - Market size and forecast 2025-2030 ($ million)
Data Table on Israel - Market size and forecast 2025-2030 ($ million)
Chart on Israel - Year-over-year growth 2025-2030 (%)
Data Table on Israel - Year-over-year growth 2025-2030 (%)

12.6.5 South Africa - Market size and forecast 2025-2030

Chart on South Africa - Market size and forecast 2025-2030 ($ million)
Data Table on South Africa - Market size and forecast 2025-2030 ($ million)
Chart on South Africa - Year-over-year growth 2025-2030 (%)
Data Table on South Africa - Year-over-year growth 2025-2030 (%)

12.7 South America - Market size and forecast 2025-2030

Chart on South America - Market size and forecast 2025-2030 ($ million)
Data Table on South America - Market size and forecast 2025-2030 ($ million)
Chart on South America - Year-over-year growth 2025-2030 (%)
Data Table on South America - Year-over-year growth 2025-2030 (%)
Chart on Regional Comparison - South America
Data Table on Regional Comparison - South America

12.7.1 Brazil - Market size and forecast 2025-2030

Chart on Brazil - Market size and forecast 2025-2030 ($ million)
Data Table on Brazil - Market size and forecast 2025-2030 ($ million)
Chart on Brazil - Year-over-year growth 2025-2030 (%)
Data Table on Brazil - Year-over-year growth 2025-2030 (%)

12.7.2 Argentina - Market size and forecast 2025-2030

Chart on Argentina - Market size and forecast 2025-2030 ($ million)
Data Table on Argentina - Market size and forecast 2025-2030 ($ million)
Chart on Argentina - Year-over-year growth 2025-2030 (%)
Data Table on Argentina - Year-over-year growth 2025-2030 (%)

12.7.3 Chile - Market size and forecast 2025-2030

Chart on Chile - Market size and forecast 2025-2030 ($ million)
Data Table on Chile - Market size and forecast 2025-2030 ($ million)
Chart on Chile - Year-over-year growth 2025-2030 (%)
Data Table on Chile - Year-over-year growth 2025-2030 (%)

12.8 Market opportunity by geography

Market opportunity by geography ($ million)
Data Tables on Market opportunity by geography ($ million)

13. Drivers, Challenges, and Opportunity

13.1 Market drivers

Surging global consumer demand for year round local produce
Unprecedented efficiency in water conservation and resource optimization
Rising frequency of extreme weather events and climate risks

13.2 Market challenges

Elevated initial capital outlays and energy cost volatility
High susceptibility to rapid pathogen spread and microclimate management
Acute shortage of skilled technical agronomists and operational labor

13.3 Impact of drivers and challenges

Impact of drivers and challenges in 2025 and 2030

13.4 Market opportunities

Rapid integration of AI driven autonomous climate and irrigation controls
Commercial adoption of biodegradable and sustainable structural consumables
Development of smart heat-activated dynamic shade and light coatings

14. Competitive Landscape

14.1 Overview

14.2

Overview on criticality of inputs and factors of differentiation

14.3 Landscape disruption

Overview on factors of disruption

14.4 Industry risks

Impact of key risks on business

15. Competitive Analysis

15.1 Companies profiled

Companies covered

15.2 Company ranking index

15.3 Market positioning of companies

Matrix on companies position and classification

15.4 AB Ludvig Svensson

AB Ludvig Svensson - Overview
AB Ludvig Svensson - Product / Service
AB Ludvig Svensson - Key offerings
SWOT

15.5 Argus Control Systems Ltd.

Argus Control Systems Ltd. - Overview
Argus Control Systems Ltd. - Product / Service
Argus Control Systems Ltd. - Key offerings
SWOT

15.6 Certhon Build B.V.

Certhon Build B.V. - Overview
Certhon Build B.V. - Product / Service
Certhon Build B.V. - Key offerings
SWOT

15.7 Dalsem Greenhouse Projects BV

Dalsem Greenhouse Projects BV - Overview
Dalsem Greenhouse Projects BV - Product / Service
Dalsem Greenhouse Projects BV - Key offerings
SWOT

15.8 Debets Schalke

Debets Schalke - Overview
Debets Schalke - Product / Service
Debets Schalke - Key offerings
SWOT

15.9 Fluence

Fluence - Overview
Fluence - Product / Service
Fluence - Key offerings
SWOT

15.10 Grodan

Grodan - Overview
Grodan - Product / Service
Grodan - Key offerings
SWOT

15.11 Hoogendoorn Growth Management

Hoogendoorn Growth Management - Overview
Hoogendoorn Growth Management - Product / Service
Hoogendoorn Growth Management - Key offerings
SWOT

15.12 KUBO Group

KUBO Group - Overview
KUBO Group - Product / Service
KUBO Group - Key offerings
SWOT

15.13 LOGIQS B.V.

LOGIQS B.V. - Overview
LOGIQS B.V. - Product / Service
LOGIQS B.V. - Key offerings
SWOT

15.14 Metazet

Metazet - Overview
Metazet - Product / Service
Metazet - Key offerings
SWOT

15.15 Netafim Ltd.

Netafim Ltd. - Overview
Netafim Ltd. - Product / Service
Netafim Ltd. - Key offerings
SWOT

15.16 Ridder Drive Systems BV

Ridder Drive Systems BV - Overview
Ridder Drive Systems BV - Product / Service
Ridder Drive Systems BV - Key offerings
SWOT

15.17 Signify NV

Signify NV - Overview
Signify NV - Business segments
Signify NV - Key offerings
Signify NV - Segment focus
SWOT

15.18 Van der Hoeven

Van der Hoeven - Overview
Van der Hoeven - Product / Service
Van der Hoeven - Key offerings
SWOT

16. Appendix

16.1 Scope of the report

Market definition
Objectives
Notes and caveats

16.2 Inclusions and exclusions checklist

Inclusions checklist
Exclusions checklist

16.3 Currency conversion rates for US$

16.4 Research methodology

16.5 Data procurement

Information sources

16.6 Data validation

16.7 Validation techniques employed for market sizing

16.8 Data synthesis

16.9 360 degree market analysis

16.10 List of abbreviations

Research Methodology

Technavio presents a detailed picture of the market by way of study, synthesis, and summation of data from multiple sources. The analysts have presented the various facets of the market with a particular focus on identifying the key industry influencers. The data thus presented is comprehensive, reliable, and the result of extensive research, both primary and secondary.

INFORMATION SOURCES

Primary sources

  • Manufacturers and suppliers
  • Channel partners
  • Industry experts
  • Strategic decision makers

Secondary sources

  • Industry journals and periodicals
  • Government data
  • Financial reports of key industry players
  • Historical data
  • Press releases

DATA ANALYSIS

Data Synthesis

  • Collation of data
  • Estimation of key figures
  • Analysis of derived insights

Data Validation

  • Triangulation with data models
  • Reference against proprietary databases
  • Corroboration with industry experts

REPORT WRITING

Qualitative

  • Market drivers
  • Market challenges
  • Market trends
  • Five forces analysis

Quantitative

  • Market size and forecast
  • Market segmentation
  • Geographical insights
  • Competitive landscape

Interested in this report?

Get your sample now to see our research methodology and insights!

Download Now

Frequently Asked Questions

Greenhouse Horticulture market growth will increase by USD 14110.8 million during 2026-2030.

The Greenhouse Horticulture market is expected to grow at a CAGR of 8% during 2026-2030.

Greenhouse Horticulture market is segmented by Product (Plastic, Glass) Crop type (Fruits and vegetables, Nursery crops, Flowers and ornamentals, Others) Technology (Hydroponics, Aeroponics, Aquaponics, Vertical farming, Others)

AB Ludvig Svensson, Agrolux, Argus Control Systems Ltd., Certhon Build B.V., Dalsem Greenhouse Projects BV, De Gier Drive Systems, Debets Schalke, Fluence, Grodan, Hoogendoorn Growth Management, Hortiplan BV, KUBO Group, LOGIQS B.V., Metazet, Netafim Ltd., P.L. Light Systems, Prins Group, Ridder Drive Systems BV, Signify NV, Van der Hoeven are a few of the key vendors in the Greenhouse Horticulture market.

Europe will register the highest growth rate of 55.3% among the other regions. Therefore, the Greenhouse Horticulture market in Europe is expected to garner significant business opportunities for the vendors during the forecast period.

The Netherlands, Spain, Italy, Germany, France, UK, US, Canada, Mexico, China, India, South Korea, Japan, Indonesia, Australia, Turkey, Saudi Arabia, UAE, Israel, South Africa, Brazil, Argentina, Chile

  • Surging global consumer demand for year round local produce is the driving factor this market.

The Greenhouse Horticulture market vendors should focus on grabbing business opportunities from the Product segment as it accounted for the largest market share in the base year.
RIA - Research AI Assistant
Ask RIA