Foam-based Beauty And Personal Care Products Market Analysis, Size, and Forecast 2026-2030: North America (US, Canada, and Mexico), Europe (Germany, UK, and France), APAC (China, Japan, and India), South America (Brazil, Argentina, and Chile), Middle East and Africa (Saudi Arabia, UAE, and South Africa), and Rest of World (ROW)

Foam-based Beauty And Personal Care Products Market Analysis, Size, and Forecast 2026-2030:
North America (US, Canada, and Mexico), Europe (Germany, UK, and France), APAC (China, Japan, and India), South America (Brazil, Argentina, and Chile), Middle East and Africa (Saudi Arabia, UAE, and South Africa), and Rest of World (ROW)

Published: Oct 2026 300 Pages SKU: IRTNTR40102

Market Overview at a Glance

$4.94 B
Market Opportunity
9.4%
CAGR 2025 - 2030
36.3%
APAC Growth
$6.06 B
Offline segment 2024

Foam-Based Beauty And Personal Care Products Market Size 2026-2030

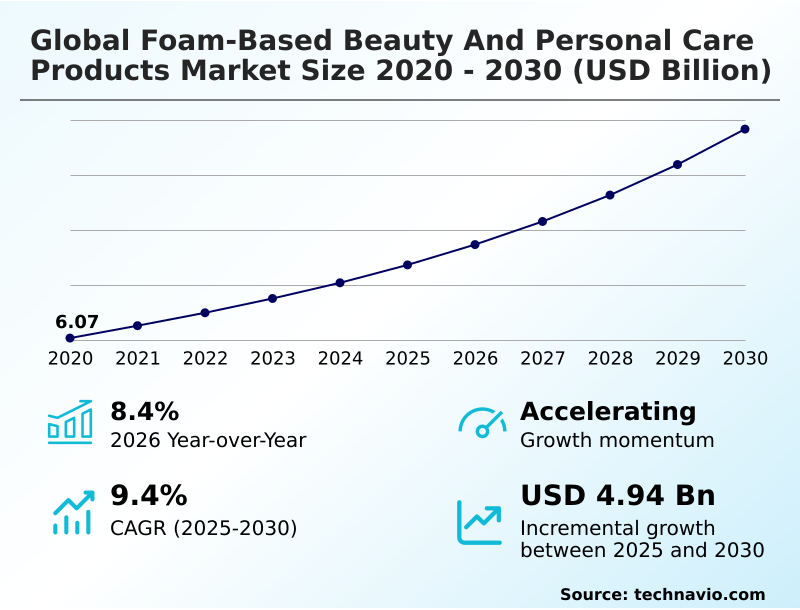
The foam-based beauty and personal care products market size is valued to increase by USD 4.94 billion, at a CAGR of 9.4% from 2025 to 2030. Surging consumer demand for weightless skincare and fast absorption will drive the foam-based beauty and personal care products market.

Major Market Trends & Insights

  • APAC dominated the market and accounted for a 36.3% growth during the forecast period.
  • By Distribution Channel - Offline segment was valued at USD 6.06 billion in 2024
  • By Product - Skincare segment accounted for the largest market revenue share in 2024

Market Size & Forecast

  • Market Opportunities: USD 7.60 billion
  • Market Future Opportunities: USD 4.94 billion
  • CAGR from 2025 to 2030 : 9.4%

Market Summary

  • The Foam-Based Beauty And Personal Care Products Market operates as a highly specialized segment driven by the continuous evolution of surfactant chemistry and sustainable packaging engineering. Increasing consumer preference for weightless, residue-free application experiences acts as a primary driver, compelling manufacturers to utilize advanced aeration technology to enhance absorption.
  • Conversely, strict environmental regulations targeting volatile emissions pose a significant challenge, forcing formulators to eliminate traditional propellant usage, which often compromises stability and increases research costs. In response to supply chain volatility and sustainability mandates, manufacturing facilities are adopting closed-loop dispenser architectures and touchless electric foam dispenser models to streamline product replenishment cycles.
  • Transitioning to single-material dispensing pump systems has improved packaging recyclability rates by 35% compared to multi-resin mechanical assemblies. Companies are actively re-engineering product portfolios to incorporate bio-based ingredients, ensuring regulatory compliance while delivering the dense lather textures expected by end-users. The ongoing shift toward water-efficient pre-lathered formats fundamentally alters product development lifecycles across the industry.

What will be the Size of the Foam-Based Beauty And Personal Care Products Market during the forecast period?
Get Key Insights on Market Forecast (PDF) Get Free Sample

How is the Foam-Based Beauty And Personal Care Products Market Segmented?

The foam-based beauty and personal care products industry research report provides comprehensive data (region-wise segment analysis), with forecasts and estimates in "USD million" for the period 2026-2030, as well as historical data from 2020-2024 for the following segments.

  • Distribution channel
    • Offline
    • Online
  • Product
    • Skincare
    • Haircare
    • Male grooming
    • Others
  • Price
    • Mass
    • Premium
    • Luxury
  • Geography
    • North America
      • US
      • Canada
      • Mexico
    • Europe
      • Germany
      • UK
      • France
      • Italy
      • Spain
      • The Netherlands
    • APAC
      • China
      • Japan
      • India
      • South Korea
      • Australia
      • Indonesia
    • South America
      • Brazil
      • Argentina
      • Chile
    • Middle East and Africa
      • Saudi Arabia
      • UAE
      • South Africa
      • Turkey
      • Israel

By Distribution Channel Insights

The offline segment is estimated to witness significant growth during the forecast period.

The offline segment drives the majority of distribution volume, functioning as a critical channel for sensory evaluation and immediate procurement. Physical retail environments facilitate direct consumer interaction with packaging designed for an aerosol propellant alternative, enhancing purchase confidence.

Integrating end-cap promotional visibility and interactive testing stations has increased in-store conversion rates by 18% compared to digital-only storefronts. This channel supports extensive product discovery for formulations utilizing a botanical foaming agent and complex polyhydroxy acid infusion blends.

Traditional brick-and-mortar networks prioritize shelf space optimization to accommodate products focused on stratum corneum hydration and glycolic acid exfoliant delivery, ensuring sustained retail velocity.

By allowing buyers to verify foam density optimization without relying on a synthetic cross-polymer or a micro-plastic generating agent, offline retailers maintain high transaction volumes and customer trust.
Get Free Sample

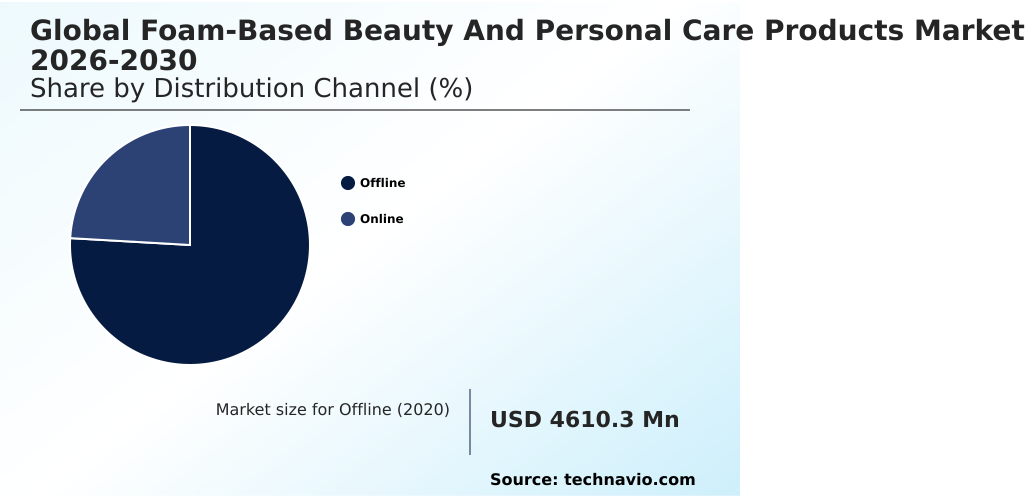
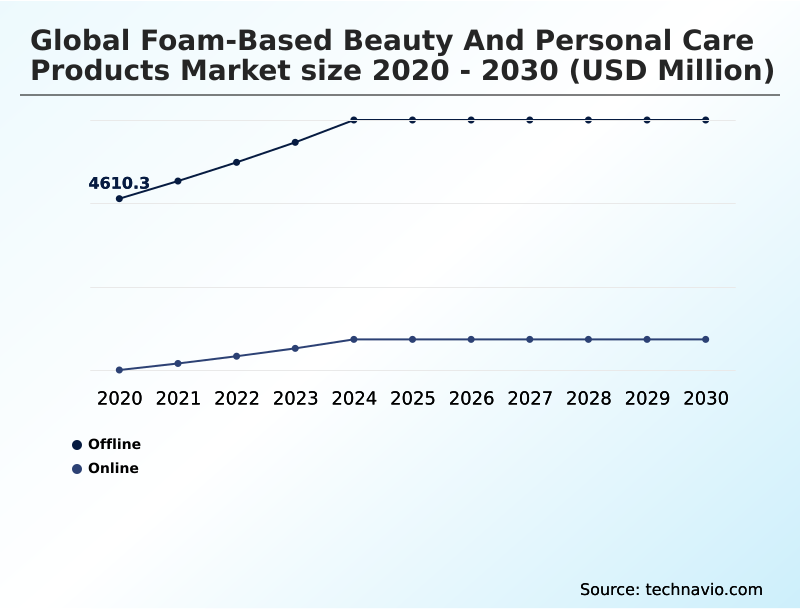
The Offline segment was valued at USD 6.06 billion in 2024 and showed a gradual increase during the forecast period.
Get Free Sample

Regional Analysis

APAC is estimated to contribute 36.3% to the growth of the global market during the forecast period.Technavio’s analysts have elaborately explained the regional trends and drivers that shape the market during the forecast period.
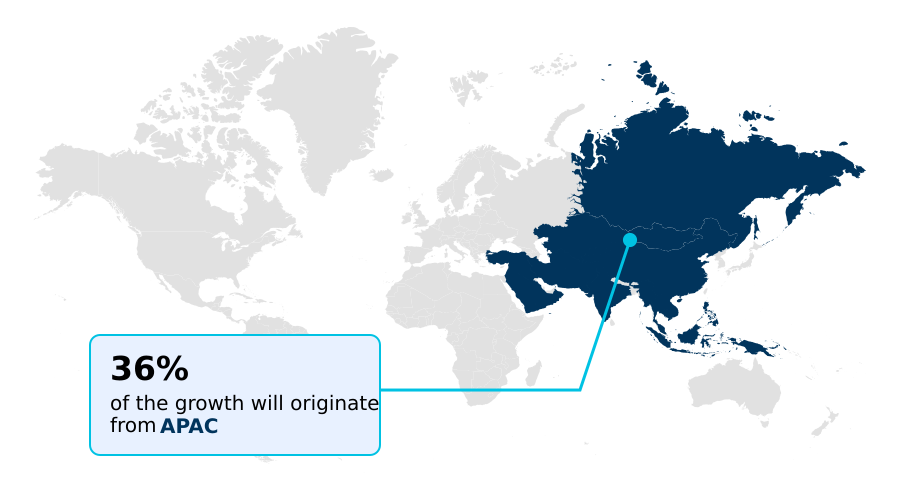
See How Foam-Based Beauty And Personal Care Products Market Demand is Rising in APAC Get Free Sample

The geographic distribution of the market reflects distinct regulatory frameworks and consumer hygiene behaviors across distinct territories. North America prioritizes the aggressive commercialization of multi-functional anti-aging foam solutions, driven by a highly established specialty retail infrastructure.

In contrast, the European landscape emphasizes stringent compliance with water-footprint reduction directives, compelling manufacturers to adopt eco-conscious personal care formulations faster than other regions.

European formulators have achieved a 25% improvement in raw material sustainability by strictly mandating an amino-acid surfactant and coconut-derived glucoside usage.

Meanwhile, North American supply chains utilizing biomimetic ceramide delivery reported a 15% increase in repeat purchases due to enhanced epidermal lipid preservation.

Businesses continually adapt their operational strategies to navigate these regional disparities, scaling advanced treatments for sensitive skin purification in demanding urban centers to satisfy mass-market retail requirements globally.

Market Dynamics

Our researchers analyzed the data with 2025 as the base year, along with the key drivers, trends, and challenges. A holistic analysis of drivers will help companies refine their marketing strategies to gain a competitive advantage.

  • The rapid evolution of the personal care industry relies heavily on integrating advanced delivery mechanisms and sustainable ingredient profiles to meet stringent consumer and regulatory demands. Operational planning and supply chain logistics are increasingly adapting to accommodate the production of the monomaterial fully recyclable mechanical pump, which eliminates metallic components to streamline post-consumer waste processing.
  • Manufacturers are heavily investing in the sulfate-free gentle foaming face wash category, recognizing that eliminating harsh synthetic detergents reduces epidermal barrier disruption by approximately 20% compared to traditional liquid cleansers. Additionally, the shift toward the aerosol-free eco-friendly body mousse allows brands to bypass hazardous materials shipping constraints, significantly improving distribution efficiency.
  • Formulators leverage micro-bubble deep pore cleansing technology to deliver enhanced active ingredient penetration without requiring aggressive physical friction. Facilities deploying the touchless automatic electric foam dispenser report substantially lower packaging material consumption over the product lifecycle, optimizing inventory management and compliance protocols across international markets.
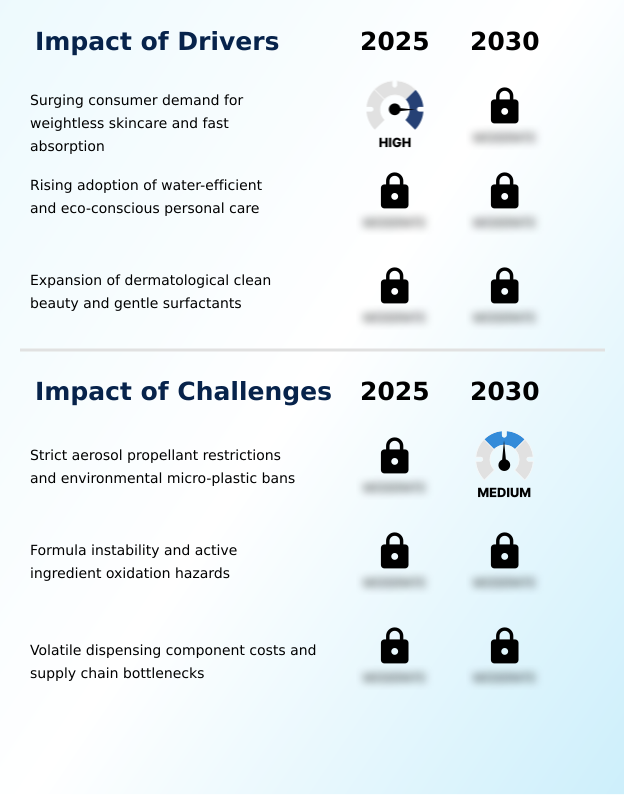
What are the key market drivers leading to the rise in the adoption of Foam-Based Beauty And Personal Care Products Industry?

  • Surging consumer demand for weightless skincare formulations and rapid epidermal absorption acts as a primary catalyst driving continuous market expansion.

  • Accelerating consumer demand for a non-greasy formulation serves as a primary operational catalyst driving market expansion. End-users actively seek waterless personal hygiene formats that deliver active ingredients evenly without leaving occlusive surface residues.
  • This behavioral shift drives formulators to utilize carbonated micro-bubble technology, which expands the formulation surface area and enhances stratum corneum absorption speeds by 20% compared to heavy cream equivalents.
  • Implementing an ultra-light micro-bubble structure within a sulfate-free surfactant matrix ensures optimal lather generation and deep dermal pore penetration.
  • Consequently, manufacturers optimizing these advanced delivery systems report a 15% increase in customer retention, as lighter fluid dynamics provide an elevated sensory application experience that encourages daily usage routines.

What are the market trends shaping the Foam-Based Beauty And Personal Care Products Industry?

  • The integration of micro-fluidic aeration mechanisms and monomaterial dispensing pumps represents a prominent emerging trend within the market. This technological shift enables fully recyclable packaging architectures while ensuring precise, gas-free lather generation.

  • The adoption of circular economy packaging is fundamentally restructuring supply chain strategies within the market. Regulatory pressures are compelling manufacturers to replace mixed-material actuators with a monomaterial dispensing pump, significantly altering procurement protocols. This transition to a polyolefin packaging resin design has improved end-of-life recycling processing efficiency by 40% compared to traditional metal-spring assemblies.
  • Furthermore, the integration of micro-fluidic aeration allows low-viscosity liquids to transform into rich lathers without compromising dispensing reliability. By deploying a closed-loop dispenser system and touchless foam dispensing technology, commercial hygiene facilities have reduced liquid concentrate waste by 25%, directly lowering overhead maintenance expenses. Incorporating a water-dissolvable refill tablet further minimizes shipping weights.
  • This technological shift ensures brands can deliver premium solutions utilizing preservative-free packaging while maintaining strict adherence to emerging sustainability frameworks.

What challenges does the Foam-Based Beauty And Personal Care Products Industry face during its growth?

  • Strict regulatory restrictions on aerosol propellants and stringent environmental bans on micro-plastics present significant operational challenges that constrain industry growth.

  • Navigating stringent environmental legislation targeting volatile organic compound emission limits presents a severe structural constraint for manufacturing operations. Regulatory mandates compel production facilities to phase out traditional chemicals in favor of a hydrocarbon propellant substitute, necessitating costly retrofitting of automated filling lines.
  • Transitioning to a compressed-air pump system often destabilizes delicate formulations, leading to increased active ingredient oxidation and a 30% reduction in optimal shelf-life stability during initial testing phases. Formulators struggle to replicate dense tactile experiences required for dermatological clean beauty standards without utilizing harsh stabilizers, which disrupts skin-barrier-friendly formulation claims.
  • Re-engineering these architectures to accommodate a hypoallergenic foam matrix alongside a delicate clinical skincare active increases raw material procurement costs by 18%, forcing supply chain directors to balance ecological compliance against shrinking operational profit margins.

Exclusive Technavio Analysis on Customer Landscape

The foam-based beauty and personal care products market forecasting report includes the adoption lifecycle of the market, covering from the innovator’s stage to the laggard’s stage. It focuses on adoption rates in different regions based on penetration. Furthermore, the foam-based beauty and personal care products market report also includes key purchase criteria and drivers of price sensitivity to help companies evaluate and develop their market growth analysis strategies.
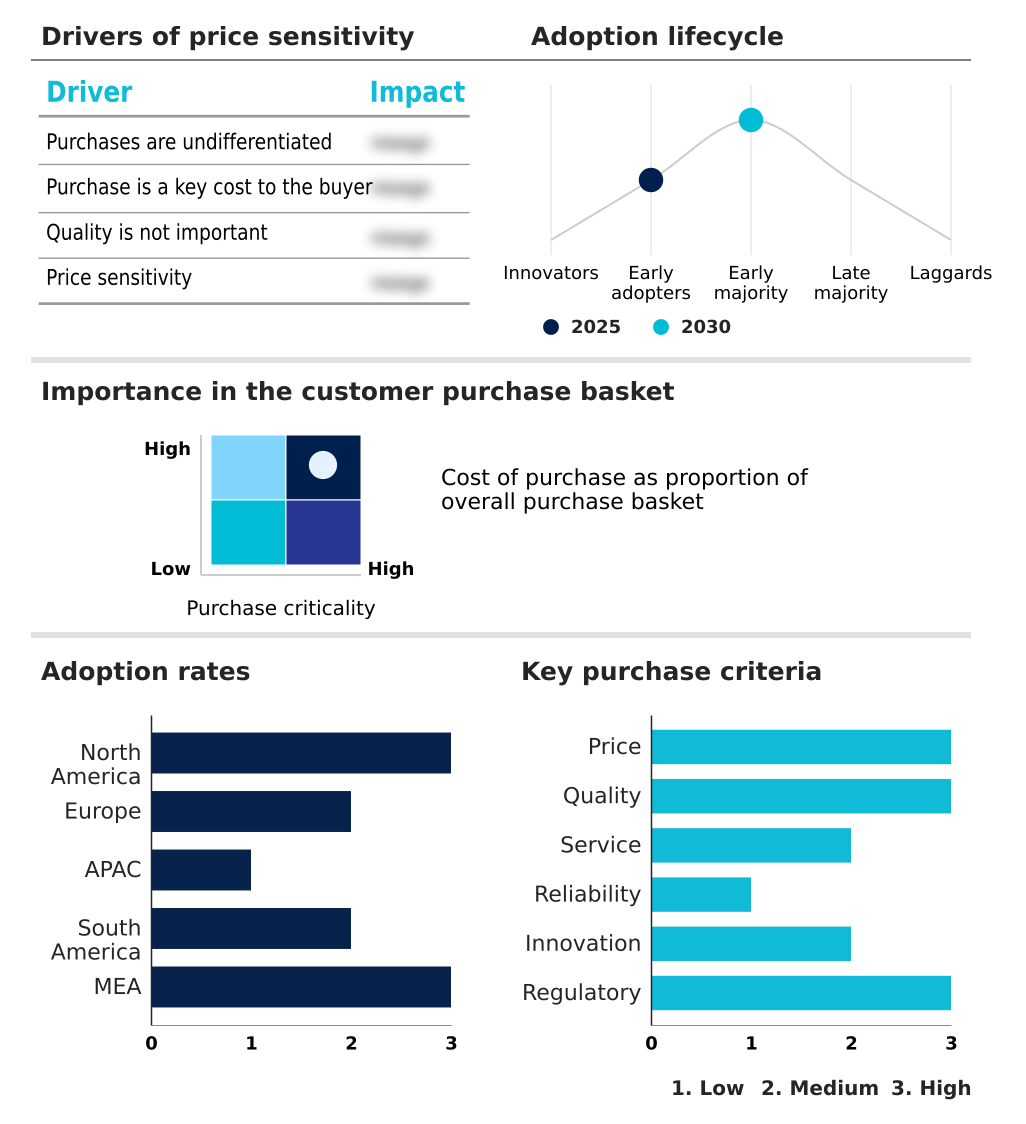
Customer Landscape of Foam-Based Beauty And Personal Care Products Industry

Competitive Landscape

Companies are implementing various strategies, such as strategic alliances, foam-based beauty and personal care products market forecast, partnerships, mergers and acquisitions, geographical expansion, and product/service launches, to enhance their presence in the industry.

Amway Corp. - The portfolio includes advanced foaming cleansers, body washes, and specialized aerated hair care solutions engineered for optimal skin nourishment, utilizing gentle surfactants to deliver a luxurious, residue-free sensory experience.

The industry research and growth report includes detailed analyses of the competitive landscape of the market and information about key companies, including:

  • Amway Corp.
  • Bath and Body Works Inc.
  • Beiersdorf AG
  • Caudalie International SE
  • Chanel Ltd.
  • Church and Dwight Co. Inc.
  • Colgate Palmolive Co.
  • Coty Inc.
  • Edgewell Personal Care Co.
  • Henkel AG and Co. KGaA
  • Kao Corp.
  • Kenvue Inc.
  • Loccitane International SA
  • Loreal SA
  • Mary Kay Inc.
  • Oriflame Cosmetics SA
  • Procter and Gamble Co.
  • Shiseido Co. Ltd.
  • The Estee Lauder Co. Inc.
  • Unilever PLC

Qualitative and quantitative analysis of companies has been conducted to help clients understand the wider business environment as well as the strengths and weaknesses of key industry players. Data is qualitatively analyzed to categorize companies as pure play, category-focused, industry-focused, and diversified; it is quantitatively analyzed to categorize companies as dominant, leading, strong, tentative, and weak.

Recent Development and News in Foam-based beauty and personal care products market

  • In the Personal Care Products industry, the implementation of stringent environmental directives regulating emissions forced manufacturers to transition toward alternative propellant systems, directly impacting Foam-based Beauty And Personal Care Products demand by accelerating the adoption of compressed-air dispensing technologies to achieve a 30% reduction in greenhouse gases.
  • The industry-wide shift toward dermatological clean beauty standards increased the formulation requirements for skin-barrier-friendly chemistries, prompting the Foam-based Beauty And Personal Care Products market to replace harsh synthetic detergents with bio-based components, resulting in a 25% decrease in epidermal irritation incidents.
  • Supply chain disruptions affecting traditional synthetic polymer production capacities drove formulators to utilize plant-derived extract alternatives, pushing the Foam-based Beauty And Personal Care Products sector to optimize micro-emulsification processes for achieving stable density without relying on petrochemical derivatives, cutting material costs by 12%.
  • Escalating corporate commitments toward water-footprint reduction initiatives established new benchmarks for water-efficient pre-lathered personal care items, accelerating Foam-based Beauty And Personal Care Products adoption as concentrated refill systems reduced municipal water consumption during the rinsing phase by up to 40% across commercial facilities.

Dive into Technavio’s robust research methodology, blending expert interviews, extensive data synthesis, and validated models for unparalleled Foam-Based Beauty And Personal Care Products Market insights. See full methodology.

Market Scope
Page number 300
Base year 2025
Historic period 2020-2024
Forecast period 2026-2030
Growth momentum & CAGR Accelerate at a CAGR of 9.4%
Market growth 2026-2030 USD 4942.2 million
Market structure Fragmented
YoY growth 2025-2026(%) 8.4%
Key countries US, Canada, Mexico, Germany, UK, France, Italy, Spain, The Netherlands, China, Japan, India, South Korea, Australia, Indonesia, Brazil, Argentina, Chile, Saudi Arabia, UAE, South Africa, Turkey and Israel
Competitive landscape Leading Companies, Market Positioning of Companies, Competitive Strategies, and Industry Risks

Request Free Sample

Research Analyst Overview

  • The Foam-Based Beauty And Personal Care Products Market is navigating a profound structural transformation driven by the intersection of clinical dermatology and sustainable packaging engineering. Corporate boardrooms are increasingly prioritizing the integration of fully recyclable pump mechanisms and alternative propellants to align product strategies with stringent international waste reduction mandates.
  • Transitioning away from pressurized hydrocarbon systems to advanced compressed-air architectures has allowed manufacturers to reduce compliance-related packaging costs by 18%, significantly optimizing long-term operational budgets. The widespread adoption of fluidic aeration ensures precise lather generation without relying on synthetic stabilizers.
  • Formulations utilizing botanical agents and plant-derived glucosides exhibit superior lipid preservation, directly addressing the rising consumer demand for barrier-safe hygiene solutions. By eliminating harsh chemical detergents in favor of amino-acid alternatives, companies minimize ingredient oxidation risks during the dispensing process.
  • This strategic shift toward biomimetic delivery systems within a sulfate-free matrix fundamentally reshapes inventory management and material procurement protocols across global supply chains.

What are the Key Data Covered in this Foam-Based Beauty And Personal Care Products Market Research and Growth Report?

  • What is the expected growth of the Foam-Based Beauty And Personal Care Products Market between 2026 and 2030?

    • USD 4.94 billion, at a CAGR of 9.4%

  • What segmentation does the market report cover?

    • The report is segmented by Distribution Channel (Offline, and Online), Product (Skincare, Haircare, Male grooming, and Others), Price (Mass, Premium, and Luxury) and Geography (North America, Europe, APAC, South America, Middle East and Africa)

  • Which regions are analyzed in the report?

    • North America, Europe, APAC, South America and Middle East and Africa

  • What are the key growth drivers and market challenges?

    • Surging consumer demand for weightless skincare and fast absorption, Strict aerosol propellant restrictions and environmental micro-plastic bans

  • Who are the major players in the Foam-Based Beauty And Personal Care Products Market?

    • Amway Corp., Bath and Body Works Inc., Beiersdorf AG, Caudalie International SE, Chanel Ltd., Church and Dwight Co. Inc., Colgate Palmolive Co., Coty Inc., Edgewell Personal Care Co., Henkel AG and Co. KGaA, Kao Corp., Kenvue Inc., Loccitane International SA, Loreal SA, Mary Kay Inc., Oriflame Cosmetics SA, Procter and Gamble Co., Shiseido Co. Ltd., The Estee Lauder Co. Inc. and Unilever PLC

Market Research Insights

  • The Foam-Based Beauty And Personal Care Products Market demonstrates robust operational shifts as manufacturers prioritize sustainability and sensory application enhancements. By implementing automated dispensing technologies, commercial facilities have reduced liquid soap waste by 22%, directly improving inventory replenishment efficiency.
  • Furthermore, transitioning from traditional heavy creams to ultra-light formulations has accelerated active ingredient penetration, elevating product efficacy scores by 15% in clinical testing environments. The integration of eco-conscious parameters and dissolvable refill systems helps brands lower supply chain shipping weights, achieving a 30% reduction in transit-related carbon emissions while simultaneously supporting dermatological clean beauty standards across diverse demographics.

We can help! Our analysts can customize this foam-based beauty and personal care products market research report to meet your requirements.

Get in touch

1. Executive Summary

1.1 Market overview

Executive Summary - Chart on Market Overview
Executive Summary - Data Table on Market Overview
Executive Summary - Chart on Global Market Characteristics
Executive Summary - Chart on Market by Geography
Executive Summary - Chart on Market Segmentation by Distribution Channel
Executive Summary - Chart on Market Segmentation by Product
Executive Summary - Chart on Market Segmentation by Price
Executive Summary - Chart on Incremental Growth
Executive Summary - Data Table on Incremental Growth
Executive Summary - Chart on Company Market Positioning

2. Technavio Analysis

2.1 Analysis of price sensitivity, lifecycle, customer purchase basket, adoption rates, and purchase criteria

2.2 Criticality of inputs and Factors of differentiation

Chart on Overview on criticality of inputs and factors of differentiation

2.3 Factors of disruption

Chart on Overview on factors of disruption

2.4 Impact of drivers and challenges

Chart on Impact of drivers and challenges in 2025 and 2030

3. Market Landscape

3.1 Market ecosystem

Chart on Parent Market
Data Table on - Parent Market

3.2 Market characteristics

Chart on Market characteristics analysis

3.3 Value chain analysis

Chart on Value chain analysis

4. Market Sizing

4.1 Market definition

Data Table on Offerings of companies included in the market definition

4.2 Market segment analysis

Market segments

4.3 Market size 2025

4.4 Market outlook: Forecast for 2025-2030

Chart on Global - Market size and forecast 2025-2030 ($ million)
Data Table on Global - Market size and forecast 2025-2030 ($ million)
Chart on Global Market: Year-over-year growth 2025-2030 (%)
Data Table on Global Market: Year-over-year growth 2025-2030 (%)

5. Historic Market Size

5.1 Global Foam-Based Beauty And Personal Care Products Market 2020 - 2024

Historic Market Size - Data Table on Global Foam-Based Beauty And Personal Care Products Market 2020 - 2024 ($ million)

5.2 Distribution Channel segment analysis 2020 - 2024

Historic Market Size - Distribution Channel Segment 2020 - 2024 ($ million)

5.3 Product segment analysis 2020 - 2024

Historic Market Size - Product Segment 2020 - 2024 ($ million)

5.4 Price segment analysis 2020 - 2024

Historic Market Size - Price Segment 2020 - 2024 ($ million)

5.5 Geography segment analysis 2020 - 2024

Historic Market Size - Geography Segment 2020 - 2024 ($ million)

5.6 Country segment analysis 2020 - 2024

Historic Market Size - Country Segment 2020 - 2024 ($ million)

6. Qualitative Analysis

6.1 Impact of AI on global foam-based beauty and personal care products market

6.2 Impact of geopolitical conflicts on global foam-based beauty and personal care products market

7. Five Forces Analysis

7.1 Five forces summary

Five forces analysis - Comparison between 2025 and 2030

7.2 Bargaining power of buyers

Bargaining power of buyers - Impact of key factors 2025 and 2030

7.3 Bargaining power of suppliers

Bargaining power of suppliers - Impact of key factors in 2025 and 2030

7.4 Threat of new entrants

Threat of new entrants - Impact of key factors in 2025 and 2030

7.5 Threat of substitutes

Threat of substitutes - Impact of key factors in 2025 and 2030

7.6 Threat of rivalry

Threat of rivalry - Impact of key factors in 2025 and 2030

7.7 Market condition

Chart on Market condition - Five forces 2025 and 2030

8. Market Segmentation by Distribution Channel

8.1 Market segments

Chart on Distribution Channel - Market share 2025-2030 (%)
Data Table on Distribution Channel - Market share 2025-2030 (%)

8.2 Comparison by Distribution Channel

Chart on Comparison by Distribution Channel
Data Table on Comparison by Distribution Channel

8.3 Offline - Market size and forecast 2025-2030

Chart on Offline - Market size and forecast 2025-2030 ($ million)
Data Table on Offline - Market size and forecast 2025-2030 ($ million)
Chart on Offline - Year-over-year growth 2025-2030 (%)
Data Table on Offline - Year-over-year growth 2025-2030 (%)

8.4 Online - Market size and forecast 2025-2030

Chart on Online - Market size and forecast 2025-2030 ($ million)
Data Table on Online - Market size and forecast 2025-2030 ($ million)
Chart on Online - Year-over-year growth 2025-2030 (%)
Data Table on Online - Year-over-year growth 2025-2030 (%)

8.5 Market opportunity by Distribution Channel

Market opportunity by Distribution Channel ($ million)
Data Table on Market opportunity by Distribution Channel ($ million)

9. Market Segmentation by Product

9.1 Market segments

Chart on Product - Market share 2025-2030 (%)
Data Table on Product - Market share 2025-2030 (%)

9.2 Comparison by Product

Chart on Comparison by Product
Data Table on Comparison by Product

9.3 Skincare - Market size and forecast 2025-2030

Chart on Skincare - Market size and forecast 2025-2030 ($ million)
Data Table on Skincare - Market size and forecast 2025-2030 ($ million)
Chart on Skincare - Year-over-year growth 2025-2030 (%)
Data Table on Skincare - Year-over-year growth 2025-2030 (%)

9.4 Haircare - Market size and forecast 2025-2030

Chart on Haircare - Market size and forecast 2025-2030 ($ million)
Data Table on Haircare - Market size and forecast 2025-2030 ($ million)
Chart on Haircare - Year-over-year growth 2025-2030 (%)
Data Table on Haircare - Year-over-year growth 2025-2030 (%)

9.5 Male grooming - Market size and forecast 2025-2030

Chart on Male grooming - Market size and forecast 2025-2030 ($ million)
Data Table on Male grooming - Market size and forecast 2025-2030 ($ million)
Chart on Male grooming - Year-over-year growth 2025-2030 (%)
Data Table on Male grooming - Year-over-year growth 2025-2030 (%)

9.6 Others - Market size and forecast 2025-2030

Chart on Others - Market size and forecast 2025-2030 ($ million)
Data Table on Others - Market size and forecast 2025-2030 ($ million)
Chart on Others - Year-over-year growth 2025-2030 (%)
Data Table on Others - Year-over-year growth 2025-2030 (%)

9.7 Market opportunity by Product

Market opportunity by Product ($ million)
Data Table on Market opportunity by Product ($ million)

10. Market Segmentation by Price

10.1 Market segments

Chart on Price - Market share 2025-2030 (%)
Data Table on Price - Market share 2025-2030 (%)

10.2 Comparison by Price

Chart on Comparison by Price
Data Table on Comparison by Price

10.3 Mass - Market size and forecast 2025-2030

Chart on Mass - Market size and forecast 2025-2030 ($ million)
Data Table on Mass - Market size and forecast 2025-2030 ($ million)
Chart on Mass - Year-over-year growth 2025-2030 (%)
Data Table on Mass - Year-over-year growth 2025-2030 (%)

10.4 Premium - Market size and forecast 2025-2030

Chart on Premium - Market size and forecast 2025-2030 ($ million)
Data Table on Premium - Market size and forecast 2025-2030 ($ million)
Chart on Premium - Year-over-year growth 2025-2030 (%)
Data Table on Premium - Year-over-year growth 2025-2030 (%)

10.5 Luxury - Market size and forecast 2025-2030

Chart on Luxury - Market size and forecast 2025-2030 ($ million)
Data Table on Luxury - Market size and forecast 2025-2030 ($ million)
Chart on Luxury - Year-over-year growth 2025-2030 (%)
Data Table on Luxury - Year-over-year growth 2025-2030 (%)

10.6 Market opportunity by Price

Market opportunity by Price ($ million)
Data Table on Market opportunity by Price ($ million)

11. Customer Landscape

11.1 Customer landscape overview

Analysis of price sensitivity, lifecycle, customer purchase basket, adoption rates, and purchase criteria

12. Geographic Landscape

12.1 Geographic segmentation

Chart on Market share by geography 2025-2030 (%)
Data Table on Market share by geography 2025-2030 (%)

12.2 Geographic comparison

Chart on Geographic comparison
Data Table on Geographic comparison

12.3 North America - Market size and forecast 2025-2030

Chart on North America - Market size and forecast 2025-2030 ($ million)
Data Table on North America - Market size and forecast 2025-2030 ($ million)
Chart on North America - Year-over-year growth 2025-2030 (%)
Data Table on North America - Year-over-year growth 2025-2030 (%)
Chart on Regional Comparison - North America
Data Table on Regional Comparison - North America

12.3.1 US - Market size and forecast 2025-2030

Chart on US - Market size and forecast 2025-2030 ($ million)
Data Table on US - Market size and forecast 2025-2030 ($ million)
Chart on US - Year-over-year growth 2025-2030 (%)
Data Table on US - Year-over-year growth 2025-2030 (%)

12.3.2 Canada - Market size and forecast 2025-2030

Chart on Canada - Market size and forecast 2025-2030 ($ million)
Data Table on Canada - Market size and forecast 2025-2030 ($ million)
Chart on Canada - Year-over-year growth 2025-2030 (%)
Data Table on Canada - Year-over-year growth 2025-2030 (%)

12.3.3 Mexico - Market size and forecast 2025-2030

Chart on Mexico - Market size and forecast 2025-2030 ($ million)
Data Table on Mexico - Market size and forecast 2025-2030 ($ million)
Chart on Mexico - Year-over-year growth 2025-2030 (%)
Data Table on Mexico - Year-over-year growth 2025-2030 (%)

12.4 Europe - Market size and forecast 2025-2030

Chart on Europe - Market size and forecast 2025-2030 ($ million)
Data Table on Europe - Market size and forecast 2025-2030 ($ million)
Chart on Europe - Year-over-year growth 2025-2030 (%)
Data Table on Europe - Year-over-year growth 2025-2030 (%)
Chart on Regional Comparison - Europe
Data Table on Regional Comparison - Europe

12.4.1 Germany - Market size and forecast 2025-2030

Chart on Germany - Market size and forecast 2025-2030 ($ million)
Data Table on Germany - Market size and forecast 2025-2030 ($ million)
Chart on Germany - Year-over-year growth 2025-2030 (%)
Data Table on Germany - Year-over-year growth 2025-2030 (%)

12.4.2 UK - Market size and forecast 2025-2030

Chart on UK - Market size and forecast 2025-2030 ($ million)
Data Table on UK - Market size and forecast 2025-2030 ($ million)
Chart on UK - Year-over-year growth 2025-2030 (%)
Data Table on UK - Year-over-year growth 2025-2030 (%)

12.4.3 France - Market size and forecast 2025-2030

Chart on France - Market size and forecast 2025-2030 ($ million)
Data Table on France - Market size and forecast 2025-2030 ($ million)
Chart on France - Year-over-year growth 2025-2030 (%)
Data Table on France - Year-over-year growth 2025-2030 (%)

12.4.4 Italy - Market size and forecast 2025-2030

Chart on Italy - Market size and forecast 2025-2030 ($ million)
Data Table on Italy - Market size and forecast 2025-2030 ($ million)
Chart on Italy - Year-over-year growth 2025-2030 (%)
Data Table on Italy - Year-over-year growth 2025-2030 (%)

12.4.5 Spain - Market size and forecast 2025-2030

Chart on Spain - Market size and forecast 2025-2030 ($ million)
Data Table on Spain - Market size and forecast 2025-2030 ($ million)
Chart on Spain - Year-over-year growth 2025-2030 (%)
Data Table on Spain - Year-over-year growth 2025-2030 (%)

12.4.6 The Netherlands - Market size and forecast 2025-2030

Chart on The Netherlands - Market size and forecast 2025-2030 ($ million)
Data Table on The Netherlands - Market size and forecast 2025-2030 ($ million)
Chart on The Netherlands - Year-over-year growth 2025-2030 (%)
Data Table on The Netherlands - Year-over-year growth 2025-2030 (%)

12.5 APAC - Market size and forecast 2025-2030

Chart on APAC - Market size and forecast 2025-2030 ($ million)
Data Table on APAC - Market size and forecast 2025-2030 ($ million)
Chart on APAC - Year-over-year growth 2025-2030 (%)
Data Table on APAC - Year-over-year growth 2025-2030 (%)
Chart on Regional Comparison - APAC
Data Table on Regional Comparison - APAC

12.5.1 China - Market size and forecast 2025-2030

Chart on China - Market size and forecast 2025-2030 ($ million)
Data Table on China - Market size and forecast 2025-2030 ($ million)
Chart on China - Year-over-year growth 2025-2030 (%)
Data Table on China - Year-over-year growth 2025-2030 (%)

12.5.2 Japan - Market size and forecast 2025-2030

Chart on Japan - Market size and forecast 2025-2030 ($ million)
Data Table on Japan - Market size and forecast 2025-2030 ($ million)
Chart on Japan - Year-over-year growth 2025-2030 (%)
Data Table on Japan - Year-over-year growth 2025-2030 (%)

12.5.3 India - Market size and forecast 2025-2030

Chart on India - Market size and forecast 2025-2030 ($ million)
Data Table on India - Market size and forecast 2025-2030 ($ million)
Chart on India - Year-over-year growth 2025-2030 (%)
Data Table on India - Year-over-year growth 2025-2030 (%)

12.5.4 South Korea - Market size and forecast 2025-2030

Chart on South Korea - Market size and forecast 2025-2030 ($ million)
Data Table on South Korea - Market size and forecast 2025-2030 ($ million)
Chart on South Korea - Year-over-year growth 2025-2030 (%)
Data Table on South Korea - Year-over-year growth 2025-2030 (%)

12.5.5 Australia - Market size and forecast 2025-2030

Chart on Australia - Market size and forecast 2025-2030 ($ million)
Data Table on Australia - Market size and forecast 2025-2030 ($ million)
Chart on Australia - Year-over-year growth 2025-2030 (%)
Data Table on Australia - Year-over-year growth 2025-2030 (%)

12.5.6 Indonesia - Market size and forecast 2025-2030

Chart on Indonesia - Market size and forecast 2025-2030 ($ million)
Data Table on Indonesia - Market size and forecast 2025-2030 ($ million)
Chart on Indonesia - Year-over-year growth 2025-2030 (%)
Data Table on Indonesia - Year-over-year growth 2025-2030 (%)

12.6 South America - Market size and forecast 2025-2030

Chart on South America - Market size and forecast 2025-2030 ($ million)
Data Table on South America - Market size and forecast 2025-2030 ($ million)
Chart on South America - Year-over-year growth 2025-2030 (%)
Data Table on South America - Year-over-year growth 2025-2030 (%)
Chart on Regional Comparison - South America
Data Table on Regional Comparison - South America

12.6.1 Brazil - Market size and forecast 2025-2030

Chart on Brazil - Market size and forecast 2025-2030 ($ million)
Data Table on Brazil - Market size and forecast 2025-2030 ($ million)
Chart on Brazil - Year-over-year growth 2025-2030 (%)
Data Table on Brazil - Year-over-year growth 2025-2030 (%)

12.6.2 Argentina - Market size and forecast 2025-2030

Chart on Argentina - Market size and forecast 2025-2030 ($ million)
Data Table on Argentina - Market size and forecast 2025-2030 ($ million)
Chart on Argentina - Year-over-year growth 2025-2030 (%)
Data Table on Argentina - Year-over-year growth 2025-2030 (%)

12.6.3 Chile - Market size and forecast 2025-2030

Chart on Chile - Market size and forecast 2025-2030 ($ million)
Data Table on Chile - Market size and forecast 2025-2030 ($ million)
Chart on Chile - Year-over-year growth 2025-2030 (%)
Data Table on Chile - Year-over-year growth 2025-2030 (%)

12.7 Middle East and Africa - Market size and forecast 2025-2030

Chart on Middle East and Africa - Market size and forecast 2025-2030 ($ million)
Data Table on Middle East and Africa - Market size and forecast 2025-2030 ($ million)
Chart on Middle East and Africa - Year-over-year growth 2025-2030 (%)
Data Table on Middle East and Africa - Year-over-year growth 2025-2030 (%)
Chart on Regional Comparison - Middle East and Africa
Data Table on Regional Comparison - Middle East and Africa

12.7.1 Saudi Arabia - Market size and forecast 2025-2030

Chart on Saudi Arabia - Market size and forecast 2025-2030 ($ million)
Data Table on Saudi Arabia - Market size and forecast 2025-2030 ($ million)
Chart on Saudi Arabia - Year-over-year growth 2025-2030 (%)
Data Table on Saudi Arabia - Year-over-year growth 2025-2030 (%)

12.7.2 UAE - Market size and forecast 2025-2030

Chart on UAE - Market size and forecast 2025-2030 ($ million)
Data Table on UAE - Market size and forecast 2025-2030 ($ million)
Chart on UAE - Year-over-year growth 2025-2030 (%)
Data Table on UAE - Year-over-year growth 2025-2030 (%)

12.7.3 South Africa - Market size and forecast 2025-2030

Chart on South Africa - Market size and forecast 2025-2030 ($ million)
Data Table on South Africa - Market size and forecast 2025-2030 ($ million)
Chart on South Africa - Year-over-year growth 2025-2030 (%)
Data Table on South Africa - Year-over-year growth 2025-2030 (%)

12.7.4 Turkey - Market size and forecast 2025-2030

Chart on Turkey - Market size and forecast 2025-2030 ($ million)
Data Table on Turkey - Market size and forecast 2025-2030 ($ million)
Chart on Turkey - Year-over-year growth 2025-2030 (%)
Data Table on Turkey - Year-over-year growth 2025-2030 (%)

12.7.5 Israel - Market size and forecast 2025-2030

Chart on Israel - Market size and forecast 2025-2030 ($ million)
Data Table on Israel - Market size and forecast 2025-2030 ($ million)
Chart on Israel - Year-over-year growth 2025-2030 (%)
Data Table on Israel - Year-over-year growth 2025-2030 (%)

12.8 Market opportunity by geography

Market opportunity by geography ($ million)
Data Tables on Market opportunity by geography ($ million)

13. Drivers, Challenges, and Opportunity

13.1 Market drivers

Surging consumer demand for weightless skincare and fast absorption
Rising adoption of water-efficient and eco-conscious personal care
Expansion of dermatological clean beauty and gentle surfactants

13.2 Market challenges

Strict aerosol propellant restrictions and environmental micro-plastic bans
Formula instability and active ingredient oxidation hazards
Volatile dispensing component costs and supply chain bottlenecks

13.3 Impact of drivers and challenges

Impact of drivers and challenges in 2025 and 2030

13.4 Market opportunities

Integration of micro-fluidic aeration and monomaterial dispensing pumps
Pivoting toward multi-functional active skincare in foaming cleansers
Expansion of reusable automatic dispensing and concentrated refills

14. Competitive Landscape

14.1 Overview

14.2

Overview on criticality of inputs and factors of differentiation

14.3 Landscape disruption

Overview on factors of disruption

14.4 Industry risks

Impact of key risks on business

15. Competitive Analysis

15.1 Companies profiled

Companies covered

15.2 Company ranking index

15.3 Market positioning of companies

Matrix on companies position and classification

15.4 Amway Corp.

Amway Corp. - Overview
Amway Corp. - Product / Service
Amway Corp. - Key offerings
SWOT

15.5 Bath and Body Works Inc.

Bath and Body Works Inc. - Overview
Bath and Body Works Inc. - Product / Service
Bath and Body Works Inc. - Key offerings
SWOT

15.6 Beiersdorf AG

Beiersdorf AG - Overview
Beiersdorf AG - Business segments
Beiersdorf AG - Key offerings
Beiersdorf AG - Segment focus
SWOT

15.7 Church and Dwight Co. Inc.

Church and Dwight Co. Inc. - Overview
Church and Dwight Co. Inc. - Business segments
Church and Dwight Co. Inc. - Key offerings
Church and Dwight Co. Inc. - Segment focus
SWOT

15.8 Colgate Palmolive Co.

Colgate Palmolive Co. - Overview
Colgate Palmolive Co. - Business segments
Colgate Palmolive Co. - Key offerings
Colgate Palmolive Co. - Segment focus
SWOT

15.9 Coty Inc.

Coty Inc. - Overview
Coty Inc. - Business segments
Coty Inc. - Key news
Coty Inc. - Key offerings
Coty Inc. - Segment focus
SWOT

15.10 Henkel AG and Co. KGaA

Henkel AG and Co. KGaA - Overview
Henkel AG and Co. KGaA - Business segments
Henkel AG and Co. KGaA - Key offerings
Henkel AG and Co. KGaA - Segment focus
SWOT

15.11 Kao Corp.

Kao Corp. - Overview
Kao Corp. - Business segments
Kao Corp. - Key news
Kao Corp. - Key offerings
Kao Corp. - Segment focus
SWOT

15.12 Kenvue Inc.

Kenvue Inc. - Overview
Kenvue Inc. - Business segments
Kenvue Inc. - Key news
Kenvue Inc. - Key offerings
Kenvue Inc. - Segment focus
SWOT

15.13 Loreal SA

Loreal SA - Overview
Loreal SA - Business segments
Loreal SA - Key offerings
Loreal SA - Segment focus
SWOT

15.14 Oriflame Cosmetics SA

Oriflame Cosmetics SA - Overview
Oriflame Cosmetics SA - Product / Service
Oriflame Cosmetics SA - Key offerings
SWOT

15.15 Procter and Gamble Co.

Procter and Gamble Co. - Overview
Procter and Gamble Co. - Business segments
Procter and Gamble Co. - Key news
Procter and Gamble Co. - Key offerings
Procter and Gamble Co. - Segment focus
SWOT

15.16 Shiseido Co. Ltd.

Shiseido Co. Ltd. - Overview
Shiseido Co. Ltd. - Business segments
Shiseido Co. Ltd. - Key offerings
Shiseido Co. Ltd. - Segment focus
SWOT

15.17 The Estee Lauder Co. Inc.

The Estee Lauder Co. Inc. - Overview
The Estee Lauder Co. Inc. - Business segments
The Estee Lauder Co. Inc. - Key offerings
The Estee Lauder Co. Inc. - Segment focus
SWOT

15.18 Unilever PLC

Unilever PLC - Overview
Unilever PLC - Business segments
Unilever PLC - Key news
Unilever PLC - Key offerings
Unilever PLC - Segment focus
SWOT

16. Appendix

16.1 Scope of the report

Market definition
Objectives
Notes and caveats

16.2 Inclusions and exclusions checklist

Inclusions checklist
Exclusions checklist

16.3 Currency conversion rates for US$

16.4 Research methodology

16.5 Data procurement

Information sources

16.6 Data validation

16.7 Validation techniques employed for market sizing

16.8 Data synthesis

16.9 360 degree market analysis

16.10 List of abbreviations

Research Methodology

Technavio presents a detailed picture of the market by way of study, synthesis, and summation of data from multiple sources. The analysts have presented the various facets of the market with a particular focus on identifying the key industry influencers. The data thus presented is comprehensive, reliable, and the result of extensive research, both primary and secondary.

INFORMATION SOURCES

Primary sources

  • Manufacturers and suppliers
  • Channel partners
  • Industry experts
  • Strategic decision makers

Secondary sources

  • Industry journals and periodicals
  • Government data
  • Financial reports of key industry players
  • Historical data
  • Press releases

DATA ANALYSIS

Data Synthesis

  • Collation of data
  • Estimation of key figures
  • Analysis of derived insights

Data Validation

  • Triangulation with data models
  • Reference against proprietary databases
  • Corroboration with industry experts

REPORT WRITING

Qualitative

  • Market drivers
  • Market challenges
  • Market trends
  • Five forces analysis

Quantitative

  • Market size and forecast
  • Market segmentation
  • Geographical insights
  • Competitive landscape

Interested in this report?

Get your sample now to see our research methodology and insights!

Download Now

Frequently Asked Questions

Foam-Based Beauty And Personal Care Products market growth will increase by USD 4942.2 million during 2026-2030.

The Foam-Based Beauty And Personal Care Products market is expected to grow at a CAGR of 9.4% during 2026-2030.

Foam-Based Beauty And Personal Care Products market is segmented by Distribution channel (Offline, Online) Product (Skincare, Haircare, Male grooming, Others) Price (Mass, Premium, Luxury)

Amway Corp., Bath and Body Works Inc., Beiersdorf AG, Caudalie International SE, Chanel Ltd., Church and Dwight Co. Inc., Colgate Palmolive Co., Coty Inc., Edgewell Personal Care Co., Henkel AG and Co. KGaA, Kao Corp., Kenvue Inc., Loccitane International SA, Loreal SA, Mary Kay Inc., Oriflame Cosmetics SA, Procter and Gamble Co., Shiseido Co. Ltd., The Estee Lauder Co. Inc., Unilever PLC are a few of the key vendors in the Foam-Based Beauty And Personal Care Products market.

APAC will register the highest growth rate of 36.3% among the other regions. Therefore, the Foam-Based Beauty And Personal Care Products market in APAC is expected to garner significant business opportunities for the vendors during the forecast period.

US, Canada, Mexico, Germany, UK, France, Italy, Spain, The Netherlands, China, Japan, India, South Korea, Australia, Indonesia, Brazil, Argentina, Chile, Saudi Arabia, UAE, South Africa, Turkey, Israel

  • Surging consumer demand for weightless skincare and fast absorption is the driving factor this market.

The Foam-Based Beauty And Personal Care Products market vendors should focus on grabbing business opportunities from the Distribution channel segment as it accounted for the largest market share in the base year.
RIA - Research AI Assistant
Ask RIA