Drug Discovery Informatics Market Analysis, Size, and Forecast 2026-2030: North America (US, Canada, and Mexico), Europe (Germany, UK, and France), APAC (China, Japan, and India), South America (Brazil, Argentina, and Colombia), Middle East and Africa (Israel, Saudi Arabia, and UAE), Asia, Rest of World (ROW)

Drug Discovery Informatics Market Analysis, Size, and Forecast 2026-2030:
North America (US, Canada, and Mexico), Europe (Germany, UK, and France), APAC (China, Japan, and India), South America (Brazil, Argentina, and Colombia), Middle East and Africa (Israel, Saudi Arabia, and UAE), Asia, Rest of World (ROW)

Published: May 2026 285 Pages SKU: IRTNTR40309

Market Overview at a Glance

$6.03 B
Market Opportunity
12.5%
CAGR 2025 - 2030
26.9%
North America Growth
$3.30 B
Discovery informatics segment 2024

Drug Discovery Informatics Market Size 2026-2030

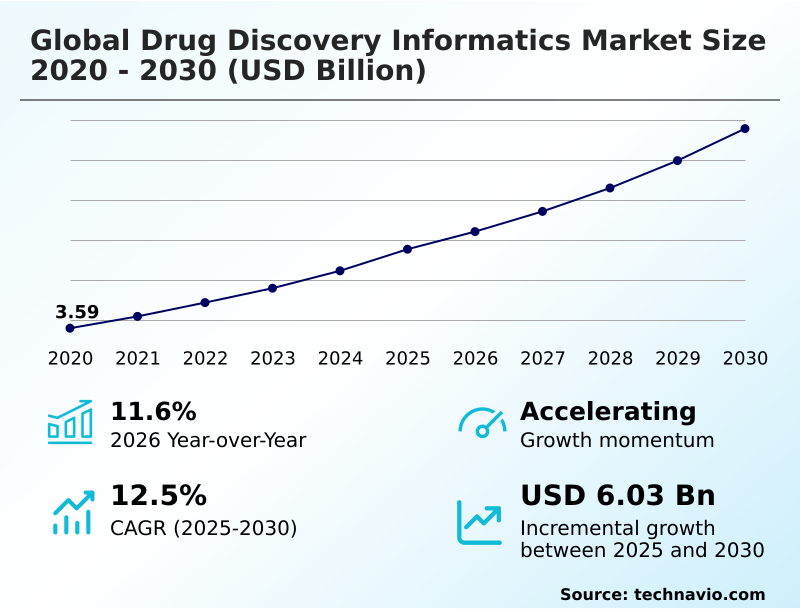
The Drug Discovery Informatics Market size was valued at USD 7.54 billion in 2025, growing at a CAGR of 12.5% during the forecast period 2026-2030.

Major Market Trends & Insights

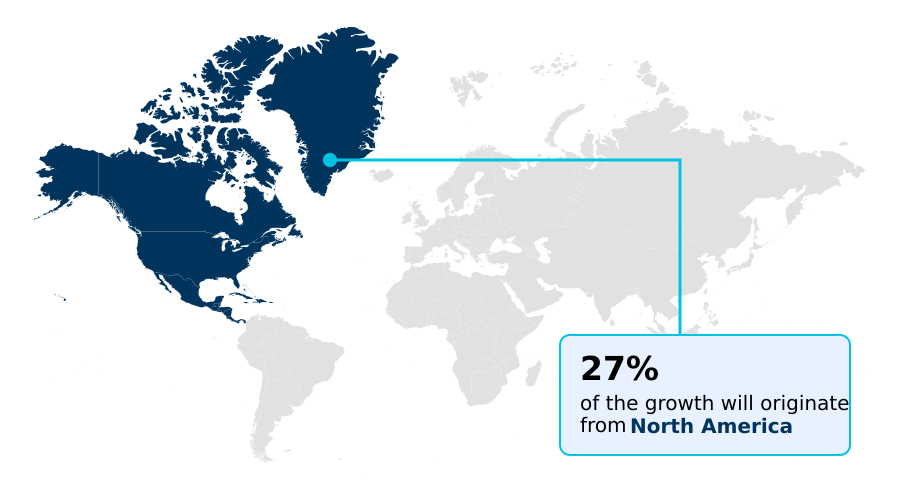
  • North America dominated the market and accounted for a 26.9% growth during the forecast period.
  • By Application - Discovery informatics segment was valued at USD 3.30 billion in 2024
  • By Solution - Software segment accounted for the largest market revenue share in 2024

Market Size & Forecast

  • Historic Market Opportunities 2020-2024: USD 9.98 billion
  • Market Future Opportunities 2025-2030: USD 6.03 billion
  • CAGR from 2025 to 2030 : 12.5%

Market Summary

  • The drug discovery informatics market is shaped by the exponential growth in biological data, with research projects now generating over 10 terabytes of data, a five-fold increase from five years ago. This surge necessitates advanced platforms for effective data integration and analysis.
  • A key driver is the industry's push for data-driven drug discovery to improve efficiency; for instance, leveraging in silico modeling can reduce early-stage candidate attrition by up to 25%. A common operational scenario involves integrating a new electronic laboratory notebook (ELN) with legacy systems, a process that can take months and highlights the challenge of interoperability.
  • Furthermore, the high cost of implementing comprehensive informatics solutions remains a significant barrier, particularly for smaller biotech firms, which often must choose between investing in lab equipment or scientific data management software. This dynamic forces a strategic balance between research ambition and fiscal reality.

What will be the Size of the Drug Discovery Informatics Market during the forecast period?

Get Key Insights on Market Forecast (PDF) Request Free Sample

How is the Drug Discovery Informatics Market Segmented?

The drug discovery informatics industry research report provides comprehensive data (region-wise segment analysis), with forecasts and analysis for the period 2026-2030, as well as historical data from 2020-2024 for the following segments.

  • Application
    • Discovery informatics
    • Development informatics
  • Solution
    • Software
    • Services
  • End-user
    • Pharma and biotech companies
    • Contract research organizations
    • Academic and research institutes
  • Geography
    • North America
      • US
      • Canada
      • Mexico
    • Europe
      • Germany
      • UK
      • France
    • Asia
    • Rest of World (ROW)

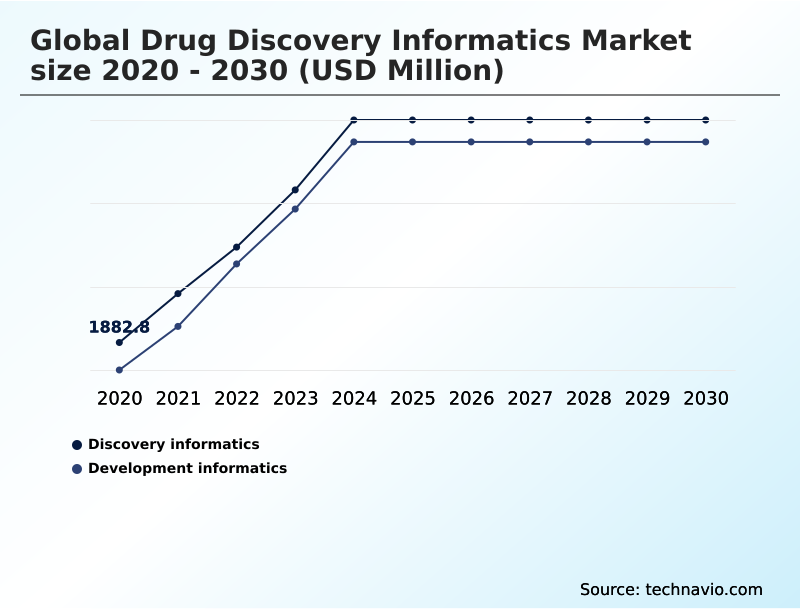
How is the Drug Discovery Informatics Market Segmented by Application?

The discovery informatics segment is estimated to witness significant growth during the forecast period.

The discovery informatics segment is centered on early-stage R&D, where advanced platforms improve hit-to-lead identification rates by over 30%.

These systems utilize in silico modeling and high-throughput screening data to accelerate target validation, reducing manual analysis time by up to 50% compared to traditional methods.

By integrating genomic data and cheminformatics tools, organizations can prioritize promising drug candidates more efficiently.

This data-centric approach, leveraging predictive modeling and structure-based drug design, allows for more effective resource allocation and shortens the preclinical development phase, directly impacting pipeline velocity and research productivity for drug discovery informatics.

Request Free Sample

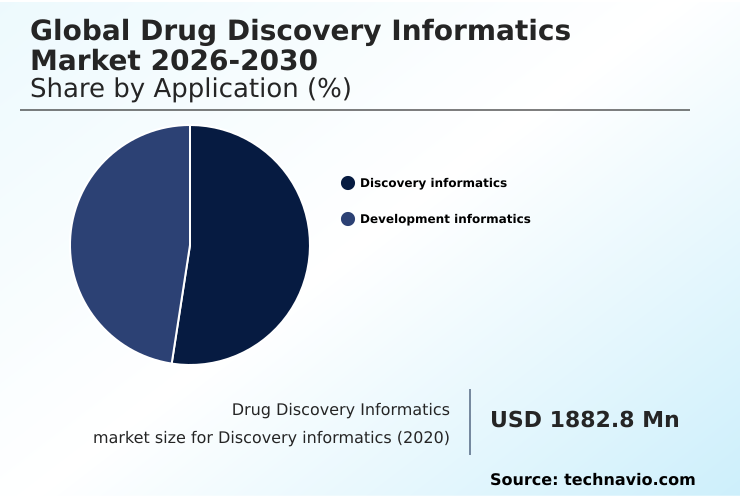
The Discovery informatics segment was valued at USD 3.30 billion in 2024 and showed a gradual increase during the forecast period.

Request Free Sample

How demand for the Drug Discovery Informatics market is rising in the leading region?

North America is estimated to contribute 26.9% to the growth of the global market during the forecast period.Technavio’s analysts have elaborately explained the regional trends and drivers that shape the market during the forecast period.

See How Drug Discovery Informatics Market demand is rising in North America Request Free Sample

The geographic landscape of the drug discovery informatics market is led by North America, which accounts for approximately 27% of the incremental growth.

The region's dominance is anchored by the United States, which represents over 80% of the regional market, driven by heavy R&D investment and a high concentration of pharmaceutical and biotechnology firms.

This contrasts with the Asian market, which, despite having a CAGR of 13.3%, shows more fragmented adoption.

In North America, the adoption of cloud-based infrastructure and AI-driven analytics is nearly ubiquitous in large pharma, while in many Asian markets, the focus remains on foundational laboratory information management system (LIMS) and cheminformatics tools.

This difference impacts collaborative research models and the regional demand for advanced bioinformatics services and target validation.

What are the key Drivers, Trends, and Challenges in the Drug Discovery Informatics Market?

Our researchers analyzed the data with 2025 as the base year, along with the key drivers, trends, and challenges. A holistic analysis of drivers will help companies refine their marketing strategies to gain a competitive advantage.

  • Strategic adoption of informatics is critical for pharmaceutical pipelines, where drug discovery informatics for small molecules now benefits from computational methods that increase screening accuracy by over 20%. The role of AI in preclinical drug discovery is expanding, with machine learning models predicting compound efficacy with 15% greater precision than statistical methods alone, significantly impacting hit-to-lead identification.
  • This evolution highlights the benefits of cloud-based LIMS platforms, which offer scalable scientific data management and enhance collaborative research models across global teams. However, significant hurdles remain, particularly the challenges in drug discovery data integration, as harmonizing disparate data from high-throughput screening and multi-omics data sources can consume up to 40% of a data scientist's time.
  • To address these issues, the ecosystem of open source drug discovery informatics tools is growing, providing academic labs and startups with foundational capabilities for cheminformatics and in silico toxicology, though they often lack the comprehensive support and interoperability standards of commercial end-to-end informatics platforms.

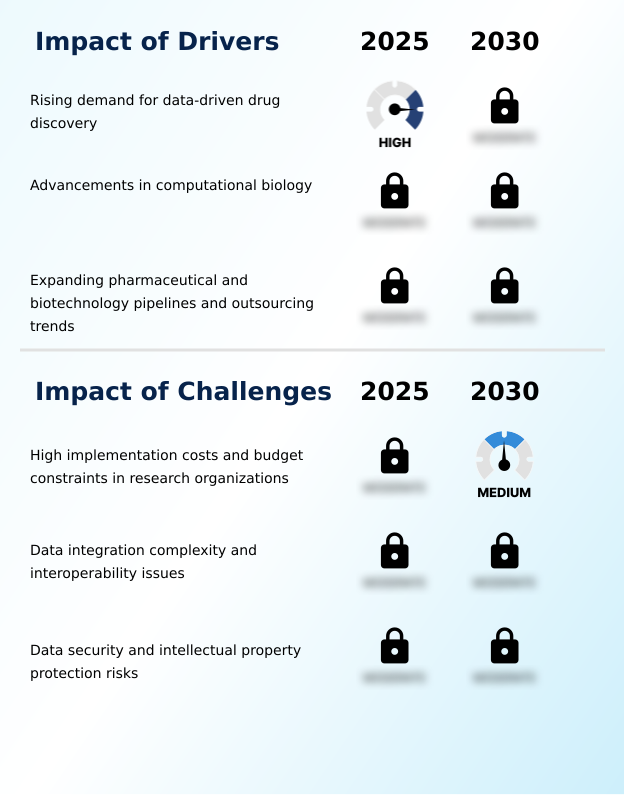
What are the key market drivers leading to the rise in the adoption of Drug Discovery Informatics Industry?

  • The key driver fueling market expansion is the rising demand for data-driven approaches to accelerate and de-risk the drug discovery process.

  • The increasing complexity of pharmaceutical R&D is a primary driver for the drug discovery informatics market, as research pipelines have expanded by an average of 15% in the last two years.
  • This expansion generates massive data volumes, making traditional analysis methods inefficient. Informatics solutions address this by enabling data-driven drug discovery, which can accelerate lead optimization by up to 30% compared to manual processes.
  • The adoption of computational biology and in silico modeling is a direct response to the pressure to reduce costs and improve success rates.
  • As companies pursue more diverse therapeutic targets, the reliance on platforms that support target validation and structure-based drug design becomes essential for maintaining competitive R&D productivity.

What are the market trends shaping the Drug Discovery Informatics Industry?

  • A primary market trend is the deepening integration of artificial intelligence and machine learning into informatics platforms. This enhances predictive modeling and accelerates data analysis across the discovery pipeline.

  • The integration of AI into drug discovery informatics platforms is a dominant trend, with AI-driven approaches now reducing the time for target identification by up to 40%. This is driven by the need to analyze vast, complex datasets, where machine learning algorithms demonstrate a 25% higher accuracy in toxicity prediction compared to conventional statistical models.
  • Consequently, pharmaceutical companies are increasingly adopting AI-driven analytics and end-to-end informatics platforms to improve research productivity and decision-making. The shift is also evident in operational workflows, where automated data integration from various sources, including genomic data and proteomic data, is becoming standard practice, accelerating the entire preclinical development pipeline.

What challenges does the Drug Discovery Informatics Industry face during its growth?

  • A key challenge limiting market growth is the high implementation cost of advanced informatics platforms, coupled with significant budget constraints within research organizations.

  • High implementation costs represent a significant challenge for drug discovery informatics, with comprehensive end-to-end informatics platforms requiring initial investments that are often 50% higher than standalone tools. This financial barrier disproportionately affects smaller biotech firms and academic labs.
  • Another major hurdle is data integration complexity, as researchers report spending up to 40% of their time on data harmonization and cleaning rather than analysis. The lack of standardized interoperability standards between different systems and instruments creates data silos, undermining the effectiveness of advanced machine learning algorithms.
  • This operational friction slows down collaborative research models and limits the full potential of scientific data management systems.

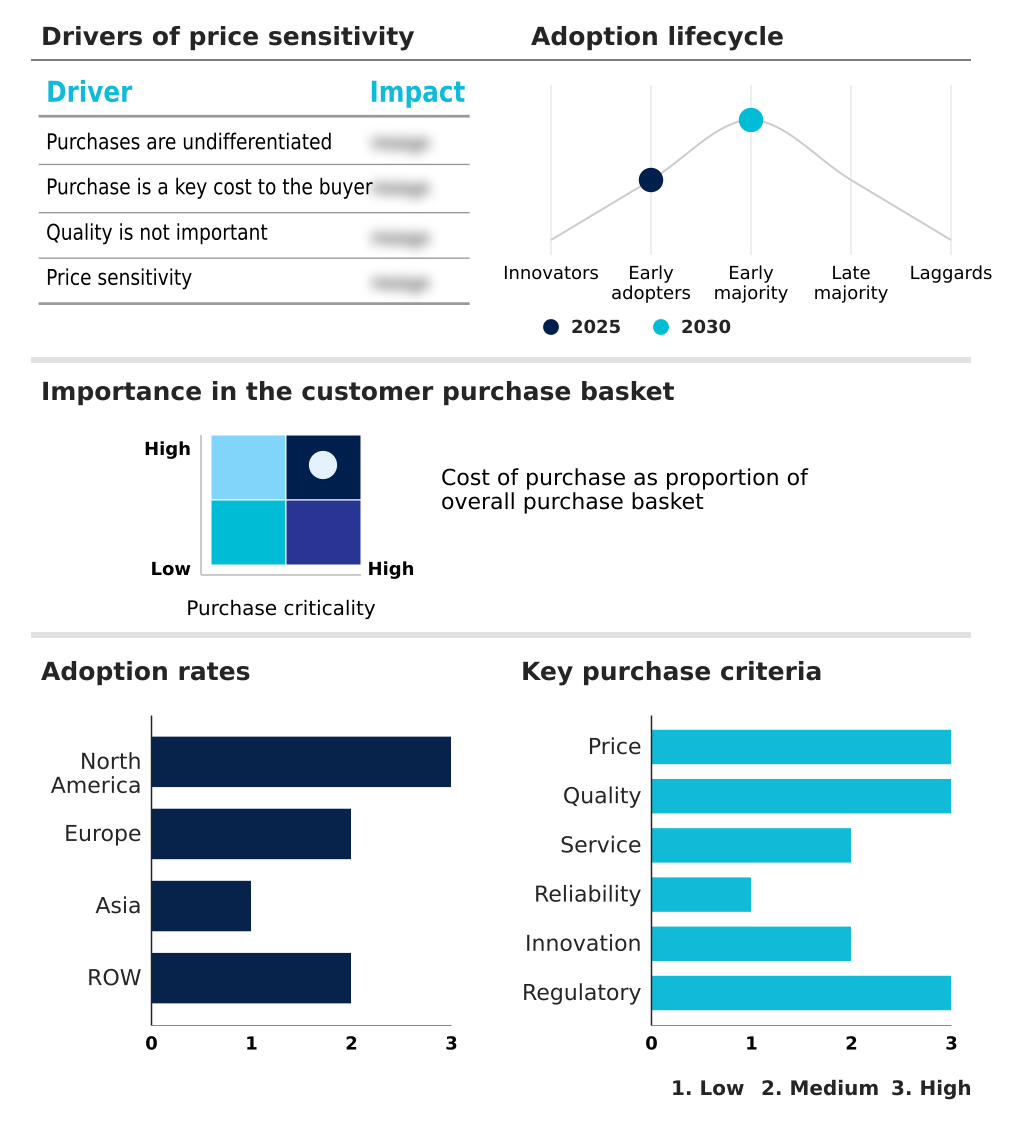
Exclusive Technavio Analysis on Customer Landscape

The drug discovery informatics market forecasting report includes the adoption lifecycle of the market, covering from the innovator’s stage to the laggard’s stage. It focuses on adoption rates in different regions based on penetration. Furthermore, the drug discovery informatics market report also includes key purchase criteria and drivers of price sensitivity to help companies evaluate and develop their market growth analysis strategies.

Customer Landscape of Drug Discovery Informatics Industry

Competitive Landscape

Companies are implementing various strategies, such as strategic alliances, drug discovery informatics market forecast, partnerships, mergers and acquisitions, geographical expansion, and product/service launches, to enhance their presence in the industry.

Accenture PLC - Integrated end-to-end informatics platforms unify scientific data management, streamlining workflows from discovery to preclinical development and improving research productivity in drug discovery informatics.

The industry research and growth report includes detailed analyses of the competitive landscape of the market and information about key companies, including:

  • Accenture PLC
  • Certara Inc.
  • Charles River Laboratories
  • Collaborative Drug Discovery
  • Cresset Biomolecular Ltd.
  • Curia Global Inc.
  • Dassault Systemes SE
  • Dotmatics
  • Eurofins Scientific SE
  • Evotec SE
  • IBM Corp.
  • Jubilant Pharmova Ltd.
  • LabVantage Solutions Inc.
  • OpenEye Scientific
  • Revvity Inc.
  • Schrodinger Inc.
  • Selvita SA
  • Thermo Fisher Scientific Inc.

Qualitative and quantitative analysis of companies has been conducted to help clients understand the wider business environment as well as the strengths and weaknesses of key industry players. Data is qualitatively analyzed to categorize companies as pure play, category-focused, industry-focused, and diversified; it is quantitatively analyzed to categorize companies as dominant, leading, strong, tentative, and weak.

Market Intelligence Radar: High-Impact Developments & Growth Signals

  • In the Health Care Technology industry, the broad adoption of enterprise AI and machine learning frameworks provides a foundation for sophisticated AI-driven analytics in drug discovery informatics, enabling the analysis of complex multi-omics data for enhanced biomarker discovery.
  • The increasing regulatory focus on data governance and interoperability standards is compelling drug discovery informatics platforms to enhance their data harmonization capabilities, directly impacting collaborative research models.
  • A strategic shift toward personalized medicine and value-based care models drives demand for drug discovery informatics tools capable of integrating patient-specific genomic data to support precision target validation and preclinical development.
  • The maturation of secure, compliant cloud-based infrastructure has accelerated the migration of drug discovery informatics systems, improving accessibility and scalability for decentralized clinical trials and real-world evidence gathering.

Dive into Technavio’s robust research methodology, blending expert interviews, extensive data synthesis, and validated models for unparalleled Drug Discovery Informatics Market insights. See full methodology.

Market Scope
Page number 285
Base year 2025
Historic period 2020-2024
Forecast period 2026-2030
Growth momentum & CAGR Accelerate at a CAGR of 12.5%
Market growth 2026-2030 USD 6027.4 million
Market structure Fragmented
YoY growth 2025-2026(%) 11.6%
Key countries US, Canada, Mexico, Germany, UK, France, Italy, Spain, The Netherlands, China, Japan, India, South Korea, Thailand, Indonesia, Brazil, Israel, Saudi Arabia, UAE, Argentina, South Africa, Turkey and Colombia
Competitive landscape Leading Companies, Market Positioning of Companies, Competitive Strategies, and Industry Risks

Request Free Sample

Research Analyst Overview

  • The drug discovery informatics market ecosystem is a complex network where technology providers, including cloud infrastructure suppliers, deliver foundational tools to software vendors. These vendors develop specialized platforms for data-driven drug discovery, which are then adopted by end-users like pharmaceutical firms and contract research organizations (CROs), which constitute over 70% of the user base.
  • Regulatory bodies influence platform design by setting standards for data integrity and validation, while academic institutions often drive innovation. The value chain is heavily dependent on skilled labor, with a 25% higher demand for bioinformaticians compared to traditional IT roles.
  • Distribution is increasingly cloud-based, with SaaS models dominating over 60% of new deployments, facilitating easier adoption and integration of tools like electronic laboratory notebooks (ELN) and LIMS.

What are the Key Data Covered in this Drug Discovery Informatics Market Research and Growth Report?

  • What is the expected growth of the Drug Discovery Informatics Market between 2026 and 2030?

    • The Drug Discovery Informatics Market is expected to grow by USD 6.03 billion during 2026-2030, registering a CAGR of 12.5%. Year-over-year growth in 2026 is estimated at 11.6%%. This acceleration is shaped by rising demand for data-driven drug discovery, which is intensifying demand across multiple end-use verticals covered in the report.

  • What segmentation does the market report cover?

    • The report is segmented by Application (Discovery informatics, and Development informatics), Solution (Software, and Services), End-user (Pharma and biotech companies, Contract research organizations, and Academic and research institutes) and Geography (North America, Europe, Asia, Rest of World (ROW)). Among these, the Discovery informatics segment is estimated to witness significant growth during the forecast period, driven by rising adoption across key application areas. Each segment includes detailed qualitative and quantitative analysis, along with historical data from 2020-2024 and forecasts through 2030 with year-over-year growth rates.

  • Which regions are analyzed in the report?

    • The report covers North America, Europe, Asia and Rest of World (ROW). North America is estimated to contribute 26.9% to market growth during the forecast period. Country-level analysis includes US, Canada, Mexico, Germany, UK, France, Italy, Spain, The Netherlands, China, Japan, India, South Korea, Thailand, Indonesia, Brazil, Israel, Saudi Arabia, UAE, Argentina, South Africa, Turkey and Colombia, with dedicated market size tables and year-over-year growth for each.

  • What are the key growth drivers and market challenges?

    • The primary driver is rising demand for data-driven drug discovery, which is accelerating investment and industry demand. The main challenge is high implementation costs and budget constraints in research organizations, creating operational barriers for key market participants. The report quantifies the impact of each driver and challenge across 2026 and 2030 with comparative analysis.

  • Who are the major players in the Drug Discovery Informatics Market?

    • Key vendors include Accenture PLC, Certara Inc., Charles River Laboratories, Collaborative Drug Discovery, Cresset Biomolecular Ltd., Curia Global Inc., Dassault Systemes SE, Dotmatics, Eurofins Scientific SE, Evotec SE, IBM Corp., Jubilant Pharmova Ltd., LabVantage Solutions Inc., OpenEye Scientific, Revvity Inc., Schrodinger Inc., Selvita SA and Thermo Fisher Scientific Inc.. The report provides qualitative and quantitative analysis categorizing companies as dominant, leading, strong, tentative, and weak based on their market positioning. Company profiles include business segment analysis, SWOT assessment, key offerings, and recent strategic developments.

Market Research Insights

  • The competitive landscape of the drug discovery informatics market is moderately concentrated, with the top five vendors accounting for over 45% of total revenue. Key players like Schrodinger Inc. and Dassault Systemes SE are intensifying competition by embedding AI and machine learning into their core platforms, improving predictive accuracy by an estimated 15% to 20%.
  • These advancements directly address the industry's need for faster hit-to-lead identification and more reliable toxicity prediction. For example, the recent focus on integrated, end-to-end informatics platforms is a direct response to the operational challenge of fragmented data silos.
  • As pharmaceutical R&D pipelines expand, vendors are adapting by offering more flexible, cloud-based solutions to manage the increasing complexity and volume of discovery data.

We can help! Our analysts can customize this drug discovery informatics market research report to meet your requirements.

Get in touch

1. Executive Summary

1.1 Market overview

Executive Summary - Chart on Market Overview
Executive Summary - Data Table on Market Overview
Executive Summary - Chart on Global Market Characteristics
Executive Summary - Chart on Market by Geography
Executive Summary - Chart on Market Segmentation by Application
Executive Summary - Chart on Market Segmentation by Solution
Executive Summary - Chart on Market Segmentation by End-user
Executive Summary - Chart on Incremental Growth
Executive Summary - Data Table on Incremental Growth
Executive Summary - Chart on Company Market Positioning

2. Technavio Analysis

2.1 Analysis of price sensitivity, lifecycle, customer purchase basket, adoption rates, and purchase criteria

2.2 Criticality of inputs and Factors of differentiation

Chart on Overview on criticality of inputs and factors of differentiation

2.3 Factors of disruption

Chart on Overview on factors of disruption

2.4 Impact of drivers and challenges

Chart on Impact of drivers and challenges in 2025 and 2030

3. Market Landscape

3.1 Market ecosystem

Chart on Parent Market
Data Table on - Parent Market

3.2 Market characteristics

Chart on Market characteristics analysis

3.3 Value chain analysis

Chart on Value chain analysis

4. Market Sizing

4.1 Market definition

Data Table on Offerings of companies included in the market definition

4.2 Market segment analysis

Market segments

4.3 Market size 2025

4.4 Market outlook: Forecast for 2025-2030

Chart on Global - Market size and forecast 2025-2030 ($ million)
Data Table on Global - Market size and forecast 2025-2030 ($ million)
Chart on Global Market: Year-over-year growth 2025-2030 (%)
Data Table on Global Market: Year-over-year growth 2025-2030 (%)

5. Historic Market Size

5.1 Global Drug Discovery Informatics Market 2020 - 2024

Historic Market Size - Data Table on Global Drug Discovery Informatics Market 2020 - 2024 ($ million)

5.2 Application segment analysis 2020 - 2024

Historic Market Size - Application Segment 2020 - 2024 ($ million)

5.3 Solution segment analysis 2020 - 2024

Historic Market Size - Solution Segment 2020 - 2024 ($ million)

5.4 End-user segment analysis 2020 - 2024

Historic Market Size - End-user Segment 2020 - 2024 ($ million)

5.5 Geography segment analysis 2020 - 2024

Historic Market Size - Geography Segment 2020 - 2024 ($ million)

5.6 Country segment analysis 2020 - 2024

Historic Market Size - Country Segment 2020 - 2024 ($ million)

6. Qualitative Analysis

6.1 The Impact of AI on Global Drug Discovery Informatics Market

7. Five Forces Analysis

7.1 Five forces summary

Five forces analysis - Comparison between 2025 and 2030

7.2 Bargaining power of buyers

Bargaining power of buyers - Impact of key factors 2025 and 2030

7.3 Bargaining power of suppliers

Bargaining power of suppliers - Impact of key factors in 2025 and 2030

7.4 Threat of new entrants

Threat of new entrants - Impact of key factors in 2025 and 2030

7.5 Threat of substitutes

Threat of substitutes - Impact of key factors in 2025 and 2030

7.6 Threat of rivalry

Threat of rivalry - Impact of key factors in 2025 and 2030

7.7 Market condition

Chart on Market condition - Five forces 2025 and 2030

8. Market Segmentation by Application

8.1 Market segments

Chart on Application - Market share 2025-2030 (%)
Data Table on Application - Market share 2025-2030 (%)

8.2 Comparison by Application

Chart on Comparison by Application
Data Table on Comparison by Application

8.3 Discovery informatics - Market size and forecast 2025-2030

Chart on Discovery informatics - Market size and forecast 2025-2030 ($ million)
Data Table on Discovery informatics - Market size and forecast 2025-2030 ($ million)
Chart on Discovery informatics - Year-over-year growth 2025-2030 (%)
Data Table on Discovery informatics - Year-over-year growth 2025-2030 (%)

8.4 Development informatics - Market size and forecast 2025-2030

Chart on Development informatics - Market size and forecast 2025-2030 ($ million)
Data Table on Development informatics - Market size and forecast 2025-2030 ($ million)
Chart on Development informatics - Year-over-year growth 2025-2030 (%)
Data Table on Development informatics - Year-over-year growth 2025-2030 (%)

8.5 Market opportunity by Application

Market opportunity by Application ($ million)
Data Table on Market opportunity by Application ($ million)

9. Market Segmentation by Solution

9.1 Market segments

Chart on Solution - Market share 2025-2030 (%)
Data Table on Solution - Market share 2025-2030 (%)

9.2 Comparison by Solution

Chart on Comparison by Solution
Data Table on Comparison by Solution

9.3 Software - Market size and forecast 2025-2030

Chart on Software - Market size and forecast 2025-2030 ($ million)
Data Table on Software - Market size and forecast 2025-2030 ($ million)
Chart on Software - Year-over-year growth 2025-2030 (%)
Data Table on Software - Year-over-year growth 2025-2030 (%)

9.4 Services - Market size and forecast 2025-2030

Chart on Services - Market size and forecast 2025-2030 ($ million)
Data Table on Services - Market size and forecast 2025-2030 ($ million)
Chart on Services - Year-over-year growth 2025-2030 (%)
Data Table on Services - Year-over-year growth 2025-2030 (%)

9.5 Market opportunity by Solution

Market opportunity by Solution ($ million)
Data Table on Market opportunity by Solution ($ million)

10. Market Segmentation by End-user

10.1 Market segments

Chart on End-user - Market share 2025-2030 (%)
Data Table on End-user - Market share 2025-2030 (%)

10.2 Comparison by End-user

Chart on Comparison by End-user
Data Table on Comparison by End-user

10.3 Pharma and biotech companies - Market size and forecast 2025-2030

Chart on Pharma and biotech companies - Market size and forecast 2025-2030 ($ million)
Data Table on Pharma and biotech companies - Market size and forecast 2025-2030 ($ million)
Chart on Pharma and biotech companies - Year-over-year growth 2025-2030 (%)
Data Table on Pharma and biotech companies - Year-over-year growth 2025-2030 (%)

10.4 Contract research organizations - Market size and forecast 2025-2030

Chart on Contract research organizations - Market size and forecast 2025-2030 ($ million)
Data Table on Contract research organizations - Market size and forecast 2025-2030 ($ million)
Chart on Contract research organizations - Year-over-year growth 2025-2030 (%)
Data Table on Contract research organizations - Year-over-year growth 2025-2030 (%)

10.5 Academic and research institutes - Market size and forecast 2025-2030

Chart on Academic and research institutes - Market size and forecast 2025-2030 ($ million)
Data Table on Academic and research institutes - Market size and forecast 2025-2030 ($ million)
Chart on Academic and research institutes - Year-over-year growth 2025-2030 (%)
Data Table on Academic and research institutes - Year-over-year growth 2025-2030 (%)

10.6 Market opportunity by End-user

Market opportunity by End-user ($ million)
Data Table on Market opportunity by End-user ($ million)

11. Customer Landscape

11.1 Customer landscape overview

Analysis of price sensitivity, lifecycle, customer purchase basket, adoption rates, and purchase criteria

12. Geographic Landscape

12.1 Geographic segmentation

Chart on Market share by geography 2025-2030 (%)
Data Table on Market share by geography 2025-2030 (%)

12.2 Geographic comparison

Chart on Geographic comparison
Data Table on Geographic comparison

12.3 North America - Market size and forecast 2025-2030

Chart on North America - Market size and forecast 2025-2030 ($ million)
Data Table on North America - Market size and forecast 2025-2030 ($ million)
Chart on North America - Year-over-year growth 2025-2030 (%)
Data Table on North America - Year-over-year growth 2025-2030 (%)
Chart on Regional Comparison - North America
Data Table on Regional Comparison - North America

12.3.1 US - Market size and forecast 2025-2030

Chart on US - Market size and forecast 2025-2030 ($ million)
Data Table on US - Market size and forecast 2025-2030 ($ million)
Chart on US - Year-over-year growth 2025-2030 (%)
Data Table on US - Year-over-year growth 2025-2030 (%)

12.3.2 Canada - Market size and forecast 2025-2030

Chart on Canada - Market size and forecast 2025-2030 ($ million)
Data Table on Canada - Market size and forecast 2025-2030 ($ million)
Chart on Canada - Year-over-year growth 2025-2030 (%)
Data Table on Canada - Year-over-year growth 2025-2030 (%)

12.3.3 Mexico - Market size and forecast 2025-2030

Chart on Mexico - Market size and forecast 2025-2030 ($ million)
Data Table on Mexico - Market size and forecast 2025-2030 ($ million)
Chart on Mexico - Year-over-year growth 2025-2030 (%)
Data Table on Mexico - Year-over-year growth 2025-2030 (%)

12.4 Europe - Market size and forecast 2025-2030

Chart on Europe - Market size and forecast 2025-2030 ($ million)
Data Table on Europe - Market size and forecast 2025-2030 ($ million)
Chart on Europe - Year-over-year growth 2025-2030 (%)
Data Table on Europe - Year-over-year growth 2025-2030 (%)
Chart on Regional Comparison - Europe
Data Table on Regional Comparison - Europe

12.4.1 Germany - Market size and forecast 2025-2030

Chart on Germany - Market size and forecast 2025-2030 ($ million)
Data Table on Germany - Market size and forecast 2025-2030 ($ million)
Chart on Germany - Year-over-year growth 2025-2030 (%)
Data Table on Germany - Year-over-year growth 2025-2030 (%)

12.4.2 UK - Market size and forecast 2025-2030

Chart on UK - Market size and forecast 2025-2030 ($ million)
Data Table on UK - Market size and forecast 2025-2030 ($ million)
Chart on UK - Year-over-year growth 2025-2030 (%)
Data Table on UK - Year-over-year growth 2025-2030 (%)

12.4.3 France - Market size and forecast 2025-2030

Chart on France - Market size and forecast 2025-2030 ($ million)
Data Table on France - Market size and forecast 2025-2030 ($ million)
Chart on France - Year-over-year growth 2025-2030 (%)
Data Table on France - Year-over-year growth 2025-2030 (%)

12.4.4 Italy - Market size and forecast 2025-2030

Chart on Italy - Market size and forecast 2025-2030 ($ million)
Data Table on Italy - Market size and forecast 2025-2030 ($ million)
Chart on Italy - Year-over-year growth 2025-2030 (%)
Data Table on Italy - Year-over-year growth 2025-2030 (%)

12.4.5 Spain - Market size and forecast 2025-2030

Chart on Spain - Market size and forecast 2025-2030 ($ million)
Data Table on Spain - Market size and forecast 2025-2030 ($ million)
Chart on Spain - Year-over-year growth 2025-2030 (%)
Data Table on Spain - Year-over-year growth 2025-2030 (%)

12.4.6 The Netherlands - Market size and forecast 2025-2030

Chart on The Netherlands - Market size and forecast 2025-2030 ($ million)
Data Table on The Netherlands - Market size and forecast 2025-2030 ($ million)
Chart on The Netherlands - Year-over-year growth 2025-2030 (%)
Data Table on The Netherlands - Year-over-year growth 2025-2030 (%)

12.5 Asia - Market size and forecast 2025-2030

Chart on Asia - Market size and forecast 2025-2030 ($ million)
Data Table on Asia - Market size and forecast 2025-2030 ($ million)
Chart on Asia - Year-over-year growth 2025-2030 (%)
Data Table on Asia - Year-over-year growth 2025-2030 (%)
Chart on Regional Comparison - Asia
Data Table on Regional Comparison - Asia

12.5.1 China - Market size and forecast 2025-2030

Chart on China - Market size and forecast 2025-2030 ($ million)
Data Table on China - Market size and forecast 2025-2030 ($ million)
Chart on China - Year-over-year growth 2025-2030 (%)
Data Table on China - Year-over-year growth 2025-2030 (%)

12.5.2 Japan - Market size and forecast 2025-2030

Chart on Japan - Market size and forecast 2025-2030 ($ million)
Data Table on Japan - Market size and forecast 2025-2030 ($ million)
Chart on Japan - Year-over-year growth 2025-2030 (%)
Data Table on Japan - Year-over-year growth 2025-2030 (%)

12.5.3 India - Market size and forecast 2025-2030

Chart on India - Market size and forecast 2025-2030 ($ million)
Data Table on India - Market size and forecast 2025-2030 ($ million)
Chart on India - Year-over-year growth 2025-2030 (%)
Data Table on India - Year-over-year growth 2025-2030 (%)

12.5.4 South Korea - Market size and forecast 2025-2030

Chart on South Korea - Market size and forecast 2025-2030 ($ million)
Data Table on South Korea - Market size and forecast 2025-2030 ($ million)
Chart on South Korea - Year-over-year growth 2025-2030 (%)
Data Table on South Korea - Year-over-year growth 2025-2030 (%)

12.5.5 Thailand - Market size and forecast 2025-2030

Chart on Thailand - Market size and forecast 2025-2030 ($ million)
Data Table on Thailand - Market size and forecast 2025-2030 ($ million)
Chart on Thailand - Year-over-year growth 2025-2030 (%)
Data Table on Thailand - Year-over-year growth 2025-2030 (%)

12.5.6 Indonesia - Market size and forecast 2025-2030

Chart on Indonesia - Market size and forecast 2025-2030 ($ million)
Data Table on Indonesia - Market size and forecast 2025-2030 ($ million)
Chart on Indonesia - Year-over-year growth 2025-2030 (%)
Data Table on Indonesia - Year-over-year growth 2025-2030 (%)

12.6 Rest of World (ROW) - Market size and forecast 2025-2030

Chart on Rest of World (ROW) - Market size and forecast 2025-2030 ($ million)
Data Table on Rest of World (ROW) - Market size and forecast 2025-2030 ($ million)
Chart on Rest of World (ROW) - Year-over-year growth 2025-2030 (%)
Data Table on Rest of World (ROW) - Year-over-year growth 2025-2030 (%)
Chart on Regional Comparison - Rest of World (ROW)
Data Table on Regional Comparison - Rest of World (ROW)

12.6.1 Brazil - Market size and forecast 2025-2030

Chart on Brazil - Market size and forecast 2025-2030 ($ million)
Data Table on Brazil - Market size and forecast 2025-2030 ($ million)
Chart on Brazil - Year-over-year growth 2025-2030 (%)
Data Table on Brazil - Year-over-year growth 2025-2030 (%)

12.6.2 Israel - Market size and forecast 2025-2030

Chart on Israel - Market size and forecast 2025-2030 ($ million)
Data Table on Israel - Market size and forecast 2025-2030 ($ million)
Chart on Israel - Year-over-year growth 2025-2030 (%)
Data Table on Israel - Year-over-year growth 2025-2030 (%)

12.6.3 Saudi Arabia - Market size and forecast 2025-2030

Chart on Saudi Arabia - Market size and forecast 2025-2030 ($ million)
Data Table on Saudi Arabia - Market size and forecast 2025-2030 ($ million)
Chart on Saudi Arabia - Year-over-year growth 2025-2030 (%)
Data Table on Saudi Arabia - Year-over-year growth 2025-2030 (%)

12.6.4 UAE - Market size and forecast 2025-2030

Chart on UAE - Market size and forecast 2025-2030 ($ million)
Data Table on UAE - Market size and forecast 2025-2030 ($ million)
Chart on UAE - Year-over-year growth 2025-2030 (%)
Data Table on UAE - Year-over-year growth 2025-2030 (%)

12.6.5 Argentina - Market size and forecast 2025-2030

Chart on Argentina - Market size and forecast 2025-2030 ($ million)
Data Table on Argentina - Market size and forecast 2025-2030 ($ million)
Chart on Argentina - Year-over-year growth 2025-2030 (%)
Data Table on Argentina - Year-over-year growth 2025-2030 (%)

12.6.6 South Africa - Market size and forecast 2025-2030

Chart on South Africa - Market size and forecast 2025-2030 ($ million)
Data Table on South Africa - Market size and forecast 2025-2030 ($ million)
Chart on South Africa - Year-over-year growth 2025-2030 (%)
Data Table on South Africa - Year-over-year growth 2025-2030 (%)

12.6.7 Turkey - Market size and forecast 2025-2030

Chart on Turkey - Market size and forecast 2025-2030 ($ million)
Data Table on Turkey - Market size and forecast 2025-2030 ($ million)
Chart on Turkey - Year-over-year growth 2025-2030 (%)
Data Table on Turkey - Year-over-year growth 2025-2030 (%)

12.6.8 Colombia - Market size and forecast 2025-2030

Chart on Colombia - Market size and forecast 2025-2030 ($ million)
Data Table on Colombia - Market size and forecast 2025-2030 ($ million)
Chart on Colombia - Year-over-year growth 2025-2030 (%)
Data Table on Colombia - Year-over-year growth 2025-2030 (%)

12.7 Market opportunity by geography

Market opportunity by geography ($ million)
Data Tables on Market opportunity by geography ($ million)

13. Drivers, Challenges, and Opportunity

13.1 Market drivers

Rising demand for data-driven drug discovery
Advancements in computational biology
Expanding pharmaceutical and biotechnology pipelines and outsourcing trends

13.2 Market challenges

High implementation costs and budget constraints in research organizations
Data integration complexity and interoperability issues
Data security and intellectual property protection risks

13.3 Impact of drivers and challenges

Impact of drivers and challenges in 2025 and 2030

13.4 Market opportunities

Integration of AI and ML into informatics platforms
Growing adoption of cloud-based drug discovery informatics solutions
Increased focus on integrated end-to-end discovery informatics platforms

14. Competitive Landscape

14.1 Overview

14.2

Overview on criticality of inputs and factors of differentiation

14.3 Landscape disruption

Overview on factors of disruption

14.4 Industry risks

Impact of key risks on business

15. Competitive Analysis

15.1 Companies profiled

Companies covered

15.2 Company ranking index

15.3 Market positioning of companies

Matrix on companies position and classification

15.4 Certara Inc.

Certara Inc. - Overview
Certara Inc. - Business segments
Certara Inc. - Key offerings
Certara Inc. - Segment focus
SWOT

15.5 Charles River Laboratories

Charles River Laboratories - Overview
Charles River Laboratories - Business segments
Charles River Laboratories - Key offerings
Charles River Laboratories - Segment focus
SWOT

15.6 Collaborative Drug Discovery

Collaborative Drug Discovery - Overview
Collaborative Drug Discovery - Product / Service
Collaborative Drug Discovery - Key offerings
SWOT

15.7 Cresset Biomolecular Ltd.

Cresset Biomolecular Ltd. - Overview
Cresset Biomolecular Ltd. - Product / Service
Cresset Biomolecular Ltd. - Key offerings
SWOT

15.8 Dassault Systemes SE

Dassault Systemes SE - Overview
Dassault Systemes SE - Business segments
Dassault Systemes SE - Key news
Dassault Systemes SE - Key offerings
Dassault Systemes SE - Segment focus
SWOT

15.9 Dotmatics

Dotmatics - Overview
Dotmatics - Product / Service
Dotmatics - Key offerings
SWOT

15.10 Evotec SE

Evotec SE - Overview
Evotec SE - Business segments
Evotec SE - Key news
Evotec SE - Key offerings
Evotec SE - Segment focus
SWOT

15.11 IBM Corp.

IBM Corp. - Overview
IBM Corp. - Business segments
IBM Corp. - Key news
IBM Corp. - Key offerings
IBM Corp. - Segment focus
SWOT

15.12 Jubilant Pharmova Ltd.

Jubilant Pharmova Ltd. - Overview
Jubilant Pharmova Ltd. - Business segments
Jubilant Pharmova Ltd. - Key offerings
Jubilant Pharmova Ltd. - Segment focus
SWOT

15.13 LabVantage Solutions Inc.

LabVantage Solutions Inc. - Overview
LabVantage Solutions Inc. - Product / Service
LabVantage Solutions Inc. - Key offerings
SWOT

15.14 OpenEye Scientific

OpenEye Scientific - Overview
OpenEye Scientific - Product / Service
OpenEye Scientific - Key offerings
SWOT

15.15 Revvity Inc.

Revvity Inc. - Overview
Revvity Inc. - Business segments
Revvity Inc. - Key offerings
Revvity Inc. - Segment focus
SWOT

15.16 Schrodinger Inc.

Schrodinger Inc. - Overview
Schrodinger Inc. - Business segments
Schrodinger Inc. - Key offerings
Schrodinger Inc. - Segment focus
SWOT

15.17 Selvita SA

Selvita SA - Overview
Selvita SA - Business segments
Selvita SA - Key offerings
Selvita SA - Segment focus
SWOT

15.18 Thermo Fisher Scientific Inc.

Thermo Fisher Scientific Inc. - Overview
Thermo Fisher Scientific Inc. - Business segments
Thermo Fisher Scientific Inc. - Key news
Thermo Fisher Scientific Inc. - Key offerings
Thermo Fisher Scientific Inc. - Segment focus
SWOT

16. Appendix

16.1 Scope of the report

Market definition
Objectives
Notes and caveats

16.2 Inclusions and exclusions checklist

Inclusions checklist
Exclusions checklist

16.3 Currency conversion rates for US$

16.4 Research methodology

16.5 Data procurement

Information sources

16.6 Data validation

16.7 Validation techniques employed for market sizing

16.8 Data synthesis

16.9 360 degree market analysis

16.10 List of abbreviations

Research Methodology

Technavio presents a detailed picture of the market by way of study, synthesis, and summation of data from multiple sources. The analysts have presented the various facets of the market with a particular focus on identifying the key industry influencers. The data thus presented is comprehensive, reliable, and the result of extensive research, both primary and secondary.

INFORMATION SOURCES

Primary sources

  • Manufacturers and suppliers
  • Channel partners
  • Industry experts
  • Strategic decision makers

Secondary sources

  • Industry journals and periodicals
  • Government data
  • Financial reports of key industry players
  • Historical data
  • Press releases

DATA ANALYSIS

Data Synthesis

  • Collation of data
  • Estimation of key figures
  • Analysis of derived insights

Data Validation

  • Triangulation with data models
  • Reference against proprietary databases
  • Corroboration with industry experts

REPORT WRITING

Qualitative

  • Market drivers
  • Market challenges
  • Market trends
  • Five forces analysis

Quantitative

  • Market size and forecast
  • Market segmentation
  • Geographical insights
  • Competitive landscape

Interested in this report?

Get your sample now to see our research methodology and insights!

Download Now

Frequently Asked Questions

Drug Discovery Informatics market growth will increase by USD 6027.4 million during 2026-2030.

The Drug Discovery Informatics market is expected to grow at a CAGR of 12.5% during 2026-2030.

Drug Discovery Informatics market is segmented by Application (Discovery informatics, Development informatics) Solution (Software, Services) End-user (Pharma and biotech companies, Contract research organizations, Academic and research institutes)

Accenture PLC, Certara Inc., Charles River Laboratories, Collaborative Drug Discovery, Cresset Biomolecular Ltd., Curia Global Inc., Dassault Systemes SE, Dotmatics, Eurofins Scientific SE, Evotec SE, IBM Corp., Jubilant Pharmova Ltd., LabVantage Solutions Inc., OpenEye Scientific, Revvity Inc., Schrodinger Inc., Selvita SA, Thermo Fisher Scientific Inc. are a few of the key vendors in the Drug Discovery Informatics market.

North America will register the highest growth rate of 26.9% among the other regions. Therefore, the Drug Discovery Informatics market in North America is expected to garner significant business opportunities for the vendors during the forecast period.

US, Canada, Mexico, Germany, UK, France, Italy, Spain, The Netherlands, China, Japan, India, South Korea, Thailand, Indonesia, Brazil, Israel, Saudi Arabia, UAE, Argentina, South Africa, Turkey, Colombia

  • Rising demand for data-driven drug discovery is the driving factor this market.

The Drug Discovery Informatics market vendors should focus on grabbing business opportunities from the Application segment as it accounted for the largest market share in the base year.
RIA - Research AI Assistant
Ask RIA