Digital Pathology Workflow Software Market Analysis, Size, and Forecast 2026-2030: North America (US, Canada, and Mexico), Europe (Germany, UK, and France), APAC (China, Japan, and India), South America (Brazil, Argentina, and Colombia), Middle East and Africa (Saudi Arabia, UAE, and South Africa), and Rest of World (ROW)

Digital Pathology Workflow Software Market Analysis, Size, and Forecast 2026-2030:
North America (US, Canada, and Mexico), Europe (Germany, UK, and France), APAC (China, Japan, and India), South America (Brazil, Argentina, and Colombia), Middle East and Africa (Saudi Arabia, UAE, and South Africa), and Rest of World (ROW)

Published: May 2026 308 Pages SKU: IRTNTR81296

Market Overview at a Glance

$167.7 Mn
Market Opportunity
14.1%
CAGR 2025 - 2030
40.2%
North America Growth
$95.5 Mn
Cloud based segment 2024

Digital Pathology Workflow Software Market Size and Growth Forecast 2026-2030

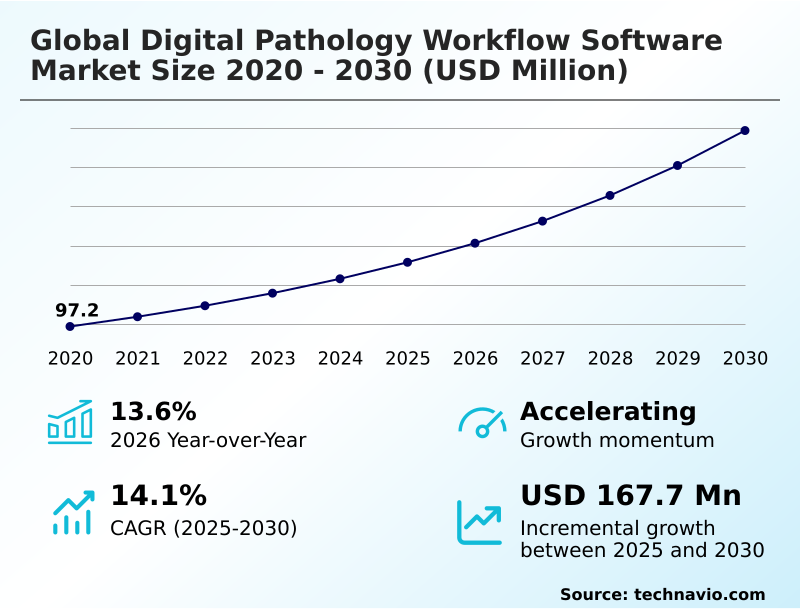
The Digital Pathology Workflow Software Market size was valued at USD 178.9 million in 2025 growing at a CAGR of 14.1% during the forecast period 2026-2030.

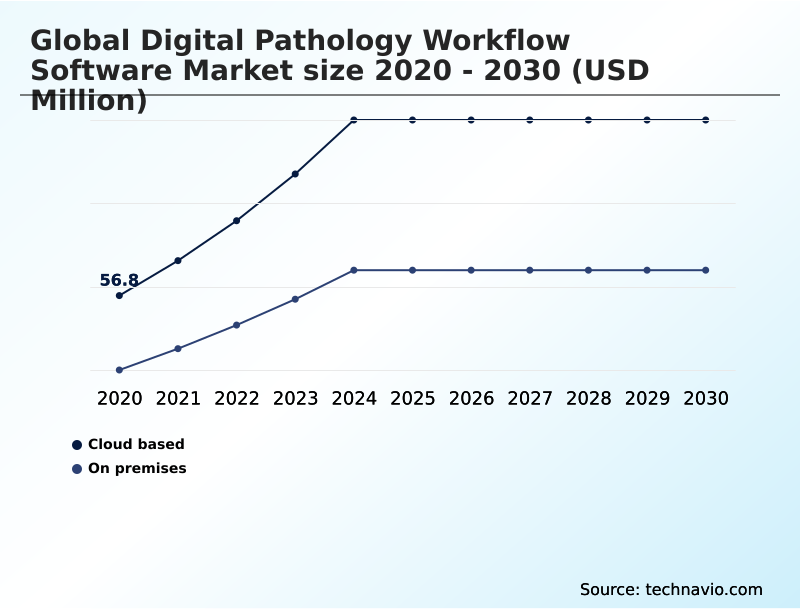
North America accounts for 40.2% of incremental growth during the forecast period. The Cloud based segment by Deployment was valued at USD 95.5 million in 2024, while the Disease diagnosis segment holds the largest revenue share by Application.

The market is projected to grow by USD 249.4 million from 2020 to 2030, with USD 167.7 million of the growth expected during the forecast period of 2025 to 2030.

Get Key Insights on Market Forecast (PDF) Request Free Sample

Digital Pathology Workflow Software Market Overview

The digital pathology workflow software market is defined by a systemic shift from manual microscopy to integrated digital environments. This transition is driven by the need for greater efficiency and diagnostic precision, compelling laboratories to adopt computational pathology and AI-powered diagnostics. The architecture for these systems must support whole-slide imaging and ensure seamless LIS/LIMS integration for a unified anatomic pathology workflow. North America is set to capture over 40% of the market's incremental growth, leading in digital pathology adoption rates. For instance, a multi-site academic medical center implementing a unified platform for multi-site workflow orchestration and a vendor-neutral archive can achieve standardized diagnostic protocols, leveraging telepathology for expert consultations across state lines. This ensures data consistency through DICOM for pathology standards. However, the high initial investment in digital slide scanners and image management systems, alongside the complexities of pathology information system integration, requires a clear return-on-investment analysis before adoption.

Drivers, Trends, and Challenges in the Digital Pathology Workflow Software Market

The digital pathology workflow software market is expanding, with a notable year-over-year growth of 13.6%, as healthcare providers weigh the cost of implementing digital pathology workflow against long-term operational gains.

Boardroom decisions increasingly center on the ROI calculation for digital pathology systems, where upfront capital for high-throughput slide scanning equipment is balanced against efficiency improvements from AI for prostate cancer grading in pathology and other automated analyses.

A critical factor is the choice of infrastructure, with cloud storage solutions for whole slide images offering scalability but demanding rigorous security requirements for cloud pathology platforms to comply with data privacy regulations like GDPR.

For instance, a US-based laboratory network must ensure its strategy for integrating digital pathology with LIS is fully compliant with CLIA '88 regulations, which govern laboratory testing.

The move toward open ecosystems is also crucial, with growing demand for open source tools for pathology image analysis and vendor-neutral archive for digital pathology benefits, enabling best-of-breed technology adoption in digital pathology workflow for multi-site labs.

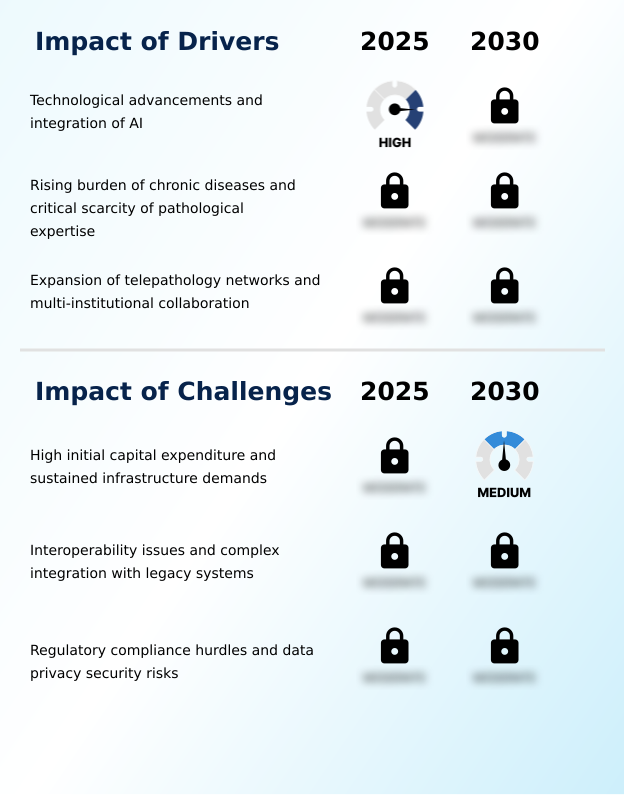
Primary Growth Driver: Technological advancements, particularly the integration of artificial intelligence, are the primary drivers of market growth.

The market's expansion is fundamentally driven by the critical scarcity of pathological expertise coupled with a rising caseload of complex diseases. This imbalance creates significant demand for solutions that improve pathology workflow efficiency and enable pathology lab automation.

North America, which is poised to contribute 40.2% of the market's incremental growth, exemplifies this trend as large healthcare networks invest heavily in digital infrastructure to optimize resource allocation.

The integration of AI-assisted cancer diagnosis into routine workflows allows these institutions to manage high volumes and provide expert-level analysis more consistently.

This technological intervention directly addresses the operational pressures on diagnostic laboratories, making software a critical tool for maintaining quality and speed in patient care.

Emerging Market Trend: The market is experiencing a significant migration toward cloud-native architectures, accompanied by the growing adoption of software-as-a-service delivery models.

A defining market trend is the move toward integrative diagnostics, where digital pathology converges with other data streams like genomics and radiology. This evolution is transforming disease diagnosis, which accounts for over half of all applications, by creating a more holistic view of patient pathology.

Software is evolving into an integrative diagnostics platform capable of correlating histopathology image analysis with molecular data, which is crucial for personalized medicine. This shift is supported by AI in histopathology, which automates complex biomarker quantification.

As laboratories generate massive datasets from whole-slide imaging, the development of open-source tools for pathology image analysis is accelerating innovation and enabling researchers to build and validate novel algorithms, further enhancing the capabilities of these sophisticated systems.

Key Industry Challenge: High initial capital expenditures and sustained infrastructure demands present a key challenge to industry growth.

A primary market challenge is the high cost of implementing digital pathology workflow, which includes not only software licenses but also capital-intensive hardware such as high-throughput slide scanning systems. This financial barrier is compounded by the technical complexities of LIS/LIMS integration and the need to ensure software is scanner-agnostic to avoid vendor lock-in.

For many institutions, justifying the investment requires a detailed digital pathology ROI analysis, which can be difficult to model accurately. Furthermore, the persistent threat to cybersecurity for pathology data necessitates significant and ongoing expenditure on security infrastructure to comply with stringent regulations like GDPR, adding another layer of cost and complexity to full-scale digital adoption.

Explore Full Market Dynamics Analysis Request Free Sample

Digital Pathology Workflow Software Market Segmentation

The digital pathology workflow software industry research report provides comprehensive data including region-wise segment analysis, with forecasts and analysis for the period 2026-2030, as well as historical data from 2020-2024 for the following segments.

Market Segment by Deployment
  • Cloud based
  • On premises
Market Segment by Application
  • Disease diagnosis
  • Drug discovery and development
  • Academic research and training
  • Others
Market Segment by End-user
  • Hospitals and reference laboratories
  • Clinical laboratories
  • Pharmaceutical companies
  • Others
Market Segment by Geography
North America
US, Canada, Mexico
Europe
Germany, UK, France, Italy, The Netherlands, Spain
APAC
China, Japan, India, South Korea, Australia, Indonesia
South America
Brazil, Argentina, Colombia
Middle East and Africa
Saudi Arabia, UAE, South Africa, Israel, Turkey

Deployment Segment Analysis

The cloud based segment is estimated to witness significant growth during the forecast period.

The market's segmentation reflects a decisive shift toward cloud-based deployment, which is projected to constitute over 61% of the market by 2025.

This model offers procurement decision-makers enhanced scalability for pathology data storage solutions and facilitates the adoption of SaaS pathology solutions, aligning with operational expenditure budget models.

Cloud-native pathology platforms are critical for enabling multi-site workflow orchestration and supporting telepathology network setups.

These architectures provide the necessary framework for centralized image management systems and robust cybersecurity for pathology data, which are essential for compliance with regulations like HIPAA.

This approach simplifies the deployment of AI-powered diagnostics while addressing the total cost of ownership implications associated with on-premises pathology servers, making it a strategic choice for institutions pursuing a modern enterprise imaging strategy.

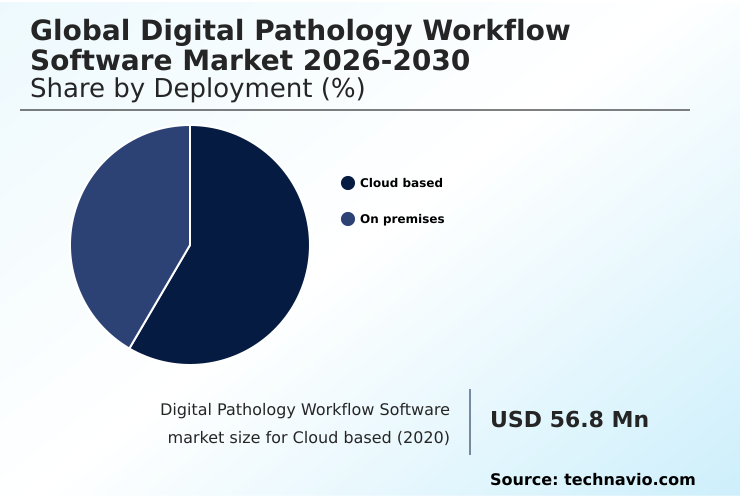
The Cloud based segment was valued at USD 95.5 million in 2024 and showed a gradual increase during the forecast period.

Digital Pathology Workflow Software Market by Region: North America Leads with 40.2% Growth Share

North America is estimated to contribute 40.2% to the growth of the global market during the forecast period.

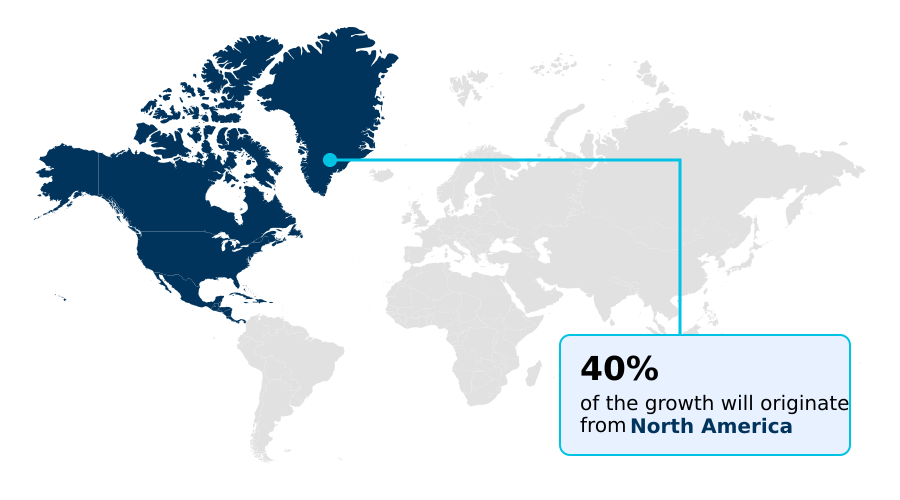
The geographic landscape of the digital pathology workflow software market is characterized by mature adoption in North America, which accounts for 40.2% of the incremental growth, and accelerated expansion in APAC, which exhibits the highest regional CAGR of 15.1%.

In North America, growth is sustained by large-scale health systems implementing advanced enterprise imaging strategies and telepathology network setups to address pathologist shortages.

Meanwhile, APAC's rapid growth is fueled by government-led healthcare modernization and the adoption of digital pathology for clinical trials.

The successful deployment of these technologies globally hinges on adherence to interoperability standards like DICOM and the establishment of scanner-agnostic software ecosystems.

This ensures that data from whole slide image viewers and other systems can be shared seamlessly across international research collaborations and clinical networks.

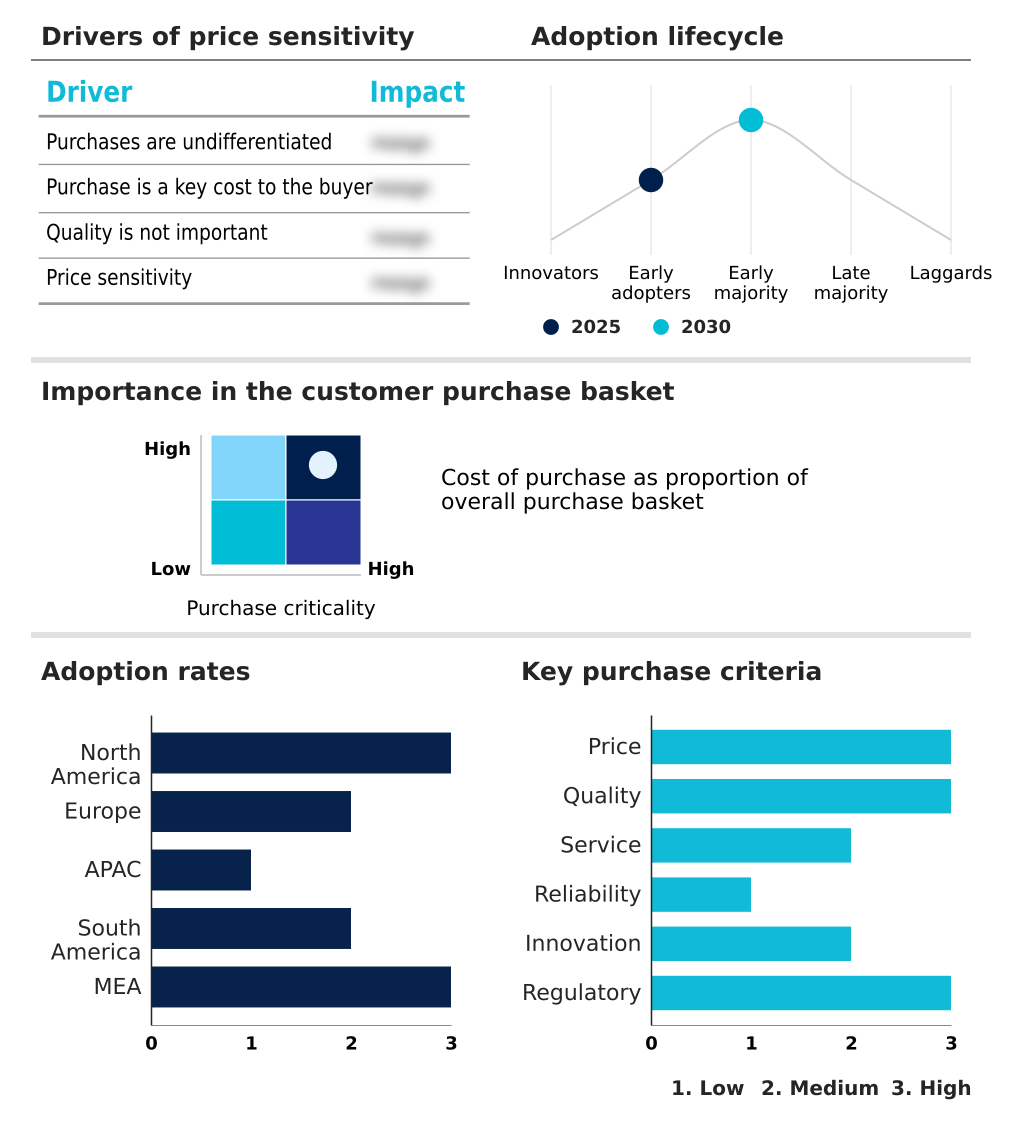
Customer Landscape Analysis for the Digital Pathology Workflow Software Market

The digital pathology workflow software market forecasting report includes the adoption lifecycle of the market, covering from the innovator’s stage to the laggard’s stage. It focuses on adoption rates in different regions based on penetration. Furthermore, the digital pathology workflow software market report also includes key purchase criteria and drivers of price sensitivity to help companies evaluate and develop their market growth analysis strategies.

Competitive Landscape of the Digital Pathology Workflow Software Market

Companies are implementing various strategies, such as strategic alliances, partnerships, mergers and acquisitions, geographical expansion, and product/service launches, to enhance their presence in the digital pathology workflow software market industry.

3DHISTECH Ltd. - AI-driven computational pathology platforms are enabling quantitative biomarker analysis and predictive diagnostics, enhancing precision oncology workflows and informing therapeutic decisions.

The industry research and growth report includes detailed analyses of the competitive landscape of the market and information about key companies, including:

  • 3DHISTECH Ltd.
  • Aiforia Technologies PLC
  • Corista
  • Dedalus Group
  • F. Hoffmann La Roche Ltd.
  • FUJIFILM Holdings Corp.
  • Gestalt Diagnostics
  • Hamamatsu Photonics KK
  • Huron Digital Pathology
  • Ibex Medical Analytics
  • Indica Labs LLC.
  • Koninklijke Philips NV
  • Leica Biosystems Nussloch GmbH
  • Mikroscan Technologies Inc.
  • Paige AI Inc.
  • PathAI Inc.
  • Proscia Inc.
  • Sectra AB
  • Tribun Health
  • Visiopharm AS

Qualitative and quantitative analysis of companies has been conducted to help clients understand the wider business environment as well as the strengths and weaknesses of key industry players. Data is qualitatively analyzed to categorize companies as pure play, category-focused, industry-focused, and diversified; it is quantitatively analyzed to categorize companies as dominant, leading, strong, tentative, and weak.

Recent Developments in the Digital Pathology Workflow Software Market

  • In May 2025, PathAI introduced an upgraded version of its AISight platform featuring enhanced deep-learning algorithms for predictive biomarker quantification, designed to assist clinicians in selecting appropriate targeted therapies.
  • In April 2025, Fujifilm Healthcare Americas Corporation launched an updated version of its Synapse pathology platform, which focused specifically on cloud-native capabilities to support the growing requirements of distributed laboratory networks.
  • In July 2025, Philips announced a strategic partnership with several molecular biology firms to integrate genomic profiling data directly into its digital pathology viewer, enabling a combined analysis of cellular patterns and genetic markers.
  • In October 2025, Sectra introduced a new module for its digital pathology platform that utilizes an open application programming interface (API) to facilitate the rapid deployment of third-party clinical algorithms across its user base.

Research Analyst Overview: Digital Pathology Workflow Software Market

The strategic migration toward cloud-native pathology platforms is redefining laboratory infrastructure, with this deployment model accounting for over 61% of the market. This shift forces boardroom-level decisions regarding CAPEX versus OPEX, influencing the long-term enterprise imaging strategy and total cost of ownership.

The adoption of SaaS pathology solutions streamlines updates and enhances accessibility but introduces rigorous data governance challenges, particularly under regulations like Europe's IVDR, which mandates strict diagnostic algorithm validation for any regulatory-cleared AI modules used in an anatomic pathology workflow.

Consequently, a key vendor qualification criterion is the provider's ability to demonstrate a clear pathway for validating its computational pathology tools. This includes ensuring their image management system adheres to interoperability standards and can be integrated into a compliant, high-throughput slide scanning environment, which is fundamental for modern histopathology image analysis.

Dive into Technavio’s robust research methodology, blending expert interviews, extensive data synthesis, and validated models for unparalleled Digital Pathology Workflow Software Market insights. See full methodology.

Request Free Sample

Market Scope
Page number 308
Base year 2025
Historic period 2020-2024
Forecast period 2026-2030
Growth momentum & CAGR Accelerate at a CAGR of 14.1%
Market growth 2026-2030 USD 167.7 million
Market structure Fragmented
YoY growth 2025-2026(%) 13.6%
Key countries US, Canada, Mexico, Germany, UK, France, Italy, The Netherlands, Spain, China, Japan, India, South Korea, Australia, Indonesia, Brazil, Argentina, Colombia, Saudi Arabia, UAE, South Africa, Israel and Turkey
Competitive landscape Leading Companies, Market Positioning of Companies, Competitive Strategies, and Industry Risks

Digital Pathology Workflow Software Market: Key Questions Answered in This Report

  • What is the expected growth of the Digital Pathology Workflow Software Market between 2026 and 2030?

    • The Digital Pathology Workflow Software Market is expected to grow by USD 167.7 million during 2026-2030, registering a CAGR of 14.1%. Year-over-year growth in 2026 is estimated at 13.6%%. This acceleration is shaped by technological advancements and integration of ai, which is intensifying demand across multiple end-use verticals covered in the report.

  • What segmentation does the market report cover?

    • The report is segmented by Deployment (Cloud based, and On premises), Application (Disease diagnosis, Drug discovery and development, Academic research and training, and Others), End-user (Hospitals and reference laboratories, Clinical laboratories, Pharmaceutical companies, and Others) and Geography (North America, Europe, APAC, South America, Middle East and Africa). Among these, the Cloud based segment is estimated to witness significant growth during the forecast period, driven by rising adoption across key application areas. Each segment includes detailed qualitative and quantitative analysis, along with historical data from 2020-2024 and forecasts through 2030 with year-over-year growth rates.

  • Which regions are analyzed in the report?

    • The report covers North America, Europe, APAC, South America and Middle East and Africa. North America is estimated to contribute 40.2% to market growth during the forecast period. Country-level analysis includes US, Canada, Mexico, Germany, UK, France, Italy, The Netherlands, Spain, China, Japan, India, South Korea, Australia, Indonesia, Brazil, Argentina, Colombia, Saudi Arabia, UAE, South Africa, Israel and Turkey, with dedicated market size tables and year-over-year growth for each.

  • What are the key growth drivers and market challenges?

    • The primary driver is technological advancements and integration of ai, which is accelerating investment and industry demand. The main challenge is high initial capital expenditure and sustained infrastructure demands, creating operational barriers for key market participants. The report quantifies the impact of each driver and challenge across 2026 and 2030 with comparative analysis.

  • Who are the major players in the Digital Pathology Workflow Software Market?

    • Key vendors include 3DHISTECH Ltd., Aiforia Technologies PLC, Corista, Dedalus Group, F. Hoffmann La Roche Ltd., FUJIFILM Holdings Corp., Gestalt Diagnostics, Hamamatsu Photonics KK, Huron Digital Pathology, Ibex Medical Analytics, Indica Labs LLC., Koninklijke Philips NV, Leica Biosystems Nussloch GmbH, Mikroscan Technologies Inc., Paige AI Inc., PathAI Inc., Proscia Inc., Sectra AB, Tribun Health and Visiopharm AS. The report provides qualitative and quantitative analysis categorizing companies as dominant, leading, strong, tentative, and weak based on their market positioning. Company profiles include business segment analysis, SWOT assessment, key offerings, and recent strategic developments.

Digital Pathology Workflow Software Market Research Insights

The market dynamics are heavily influenced by the strategic choice between cloud vs on-premise pathology deployments. The decision impacts not only data accessibility but also compliance with security frameworks like those mandated for pathology EMR integration. A key factor shaping procurement is the availability of FDA-approved pathology AI, which is transforming diagnostic capabilities.

For example, a clinical laboratory's decision to adopt a specific platform is increasingly tied to the software's ability to integrate regulatory-cleared AI modules for specific tasks such as prostate cancer grading.

This move toward AI-assisted cancer diagnosis requires robust pathology data storage solutions and a clear strategy for diagnostic algorithm validation to meet stringent standards like those set by the FDA for Software as a Medical Device (SaMD), ultimately impacting pathology lab automation and overall workflow efficiency.

We can help! Our analysts can customize this digital pathology workflow software market research report to meet your requirements.

Get in touch

1. Executive Summary

1.1 Market overview

Executive Summary - Chart on Market Overview
Executive Summary - Data Table on Market Overview
Executive Summary - Chart on Global Market Characteristics
Executive Summary - Chart on Market by Geography
Executive Summary - Chart on Market Segmentation by Deployment
Executive Summary - Chart on Market Segmentation by Application
Executive Summary - Chart on Market Segmentation by End-user
Executive Summary - Chart on Incremental Growth
Executive Summary - Data Table on Incremental Growth
Executive Summary - Chart on Company Market Positioning

2. Technavio Analysis

2.1 Analysis of price sensitivity, lifecycle, customer purchase basket, adoption rates, and purchase criteria

2.2 Criticality of inputs and Factors of differentiation

Chart on Overview on criticality of inputs and factors of differentiation

2.3 Factors of disruption

Chart on Overview on factors of disruption

2.4 Impact of drivers and challenges

Chart on Impact of drivers and challenges in 2025 and 2030

3. Market Landscape

3.1 Market ecosystem

Chart on Parent Market
Data Table on - Parent Market

3.2 Market characteristics

Chart on Market characteristics analysis

3.3 Value chain analysis

Chart on Value chain analysis

4. Market Sizing

4.1 Market definition

Data Table on Offerings of companies included in the market definition

4.2 Market segment analysis

Market segments

4.3 Market size 2025

4.4 Market outlook: Forecast for 2025-2030

Chart on Global - Market size and forecast 2025-2030 ($ million)
Data Table on Global - Market size and forecast 2025-2030 ($ million)
Chart on Global Market: Year-over-year growth 2025-2030 (%)
Data Table on Global Market: Year-over-year growth 2025-2030 (%)

5. Historic Market Size

5.1 Global Digital Pathology Workflow Software Market 2020 - 2024

Historic Market Size - Data Table on Global Digital Pathology Workflow Software Market 2020 - 2024 ($ million)

5.2 Deployment segment analysis 2020 - 2024

Historic Market Size - Deployment Segment 2020 - 2024 ($ million)

5.3 Application segment analysis 2020 - 2024

Historic Market Size - Application Segment 2020 - 2024 ($ million)

5.4 End-user segment analysis 2020 - 2024

Historic Market Size - End-user Segment 2020 - 2024 ($ million)

5.5 Geography segment analysis 2020 - 2024

Historic Market Size - Geography Segment 2020 - 2024 ($ million)

5.6 Country segment analysis 2020 - 2024

Historic Market Size - Country Segment 2020 - 2024 ($ million)

6. Qualitative Analysis

6.1 The AI impact on Global Digital Pathology Workflow Software Market

7. Five Forces Analysis

7.1 Five forces summary

Five forces analysis - Comparison between 2025 and 2030

7.2 Bargaining power of buyers

Bargaining power of buyers - Impact of key factors 2025 and 2030

7.3 Bargaining power of suppliers

Bargaining power of suppliers - Impact of key factors in 2025 and 2030

7.4 Threat of new entrants

Threat of new entrants - Impact of key factors in 2025 and 2030

7.5 Threat of substitutes

Threat of substitutes - Impact of key factors in 2025 and 2030

7.6 Threat of rivalry

Threat of rivalry - Impact of key factors in 2025 and 2030

7.7 Market condition

Chart on Market condition - Five forces 2025 and 2030

8. Market Segmentation by Deployment

8.1 Market segments

Chart on Deployment - Market share 2025-2030 (%)
Data Table on Deployment - Market share 2025-2030 (%)

8.2 Comparison by Deployment

Chart on Comparison by Deployment
Data Table on Comparison by Deployment

8.3 Cloud based - Market size and forecast 2025-2030

Chart on Cloud based - Market size and forecast 2025-2030 ($ million)
Data Table on Cloud based - Market size and forecast 2025-2030 ($ million)
Chart on Cloud based - Year-over-year growth 2025-2030 (%)
Data Table on Cloud based - Year-over-year growth 2025-2030 (%)

8.4 On premises - Market size and forecast 2025-2030

Chart on On premises - Market size and forecast 2025-2030 ($ million)
Data Table on On premises - Market size and forecast 2025-2030 ($ million)
Chart on On premises - Year-over-year growth 2025-2030 (%)
Data Table on On premises - Year-over-year growth 2025-2030 (%)

8.5 Market opportunity by Deployment

Market opportunity by Deployment ($ million)
Data Table on Market opportunity by Deployment ($ million)

9. Market Segmentation by Application

9.1 Market segments

Chart on Application - Market share 2025-2030 (%)
Data Table on Application - Market share 2025-2030 (%)

9.2 Comparison by Application

Chart on Comparison by Application
Data Table on Comparison by Application

9.3 Disease diagnosis - Market size and forecast 2025-2030

Chart on Disease diagnosis - Market size and forecast 2025-2030 ($ million)
Data Table on Disease diagnosis - Market size and forecast 2025-2030 ($ million)
Chart on Disease diagnosis - Year-over-year growth 2025-2030 (%)
Data Table on Disease diagnosis - Year-over-year growth 2025-2030 (%)

9.4 Drug discovery and development - Market size and forecast 2025-2030

Chart on Drug discovery and development - Market size and forecast 2025-2030 ($ million)
Data Table on Drug discovery and development - Market size and forecast 2025-2030 ($ million)
Chart on Drug discovery and development - Year-over-year growth 2025-2030 (%)
Data Table on Drug discovery and development - Year-over-year growth 2025-2030 (%)

9.5 Academic research and training - Market size and forecast 2025-2030

Chart on Academic research and training - Market size and forecast 2025-2030 ($ million)
Data Table on Academic research and training - Market size and forecast 2025-2030 ($ million)
Chart on Academic research and training - Year-over-year growth 2025-2030 (%)
Data Table on Academic research and training - Year-over-year growth 2025-2030 (%)

9.6 Others - Market size and forecast 2025-2030

Chart on Others - Market size and forecast 2025-2030 ($ million)
Data Table on Others - Market size and forecast 2025-2030 ($ million)
Chart on Others - Year-over-year growth 2025-2030 (%)
Data Table on Others - Year-over-year growth 2025-2030 (%)

9.7 Market opportunity by Application

Market opportunity by Application ($ million)
Data Table on Market opportunity by Application ($ million)

10. Market Segmentation by End-user

10.1 Market segments

Chart on End-user - Market share 2025-2030 (%)
Data Table on End-user - Market share 2025-2030 (%)

10.2 Comparison by End-user

Chart on Comparison by End-user
Data Table on Comparison by End-user

10.3 Hospitals and reference laboratories - Market size and forecast 2025-2030

Chart on Hospitals and reference laboratories - Market size and forecast 2025-2030 ($ million)
Data Table on Hospitals and reference laboratories - Market size and forecast 2025-2030 ($ million)
Chart on Hospitals and reference laboratories - Year-over-year growth 2025-2030 (%)
Data Table on Hospitals and reference laboratories - Year-over-year growth 2025-2030 (%)

10.4 Clinical laboratories - Market size and forecast 2025-2030

Chart on Clinical laboratories - Market size and forecast 2025-2030 ($ million)
Data Table on Clinical laboratories - Market size and forecast 2025-2030 ($ million)
Chart on Clinical laboratories - Year-over-year growth 2025-2030 (%)
Data Table on Clinical laboratories - Year-over-year growth 2025-2030 (%)

10.5 Pharmaceutical companies - Market size and forecast 2025-2030

Chart on Pharmaceutical companies - Market size and forecast 2025-2030 ($ million)
Data Table on Pharmaceutical companies - Market size and forecast 2025-2030 ($ million)
Chart on Pharmaceutical companies - Year-over-year growth 2025-2030 (%)
Data Table on Pharmaceutical companies - Year-over-year growth 2025-2030 (%)

10.6 Others - Market size and forecast 2025-2030

Chart on Others - Market size and forecast 2025-2030 ($ million)
Data Table on Others - Market size and forecast 2025-2030 ($ million)
Chart on Others - Year-over-year growth 2025-2030 (%)
Data Table on Others - Year-over-year growth 2025-2030 (%)

10.7 Market opportunity by End-user

Market opportunity by End-user ($ million)
Data Table on Market opportunity by End-user ($ million)

11. Customer Landscape

11.1 Customer landscape overview

Analysis of price sensitivity, lifecycle, customer purchase basket, adoption rates, and purchase criteria

12. Geographic Landscape

12.1 Geographic segmentation

Chart on Market share by geography 2025-2030 (%)
Data Table on Market share by geography 2025-2030 (%)

12.2 Geographic comparison

Chart on Geographic comparison
Data Table on Geographic comparison

12.3 North America - Market size and forecast 2025-2030

Chart on North America - Market size and forecast 2025-2030 ($ million)
Data Table on North America - Market size and forecast 2025-2030 ($ million)
Chart on North America - Year-over-year growth 2025-2030 (%)
Data Table on North America - Year-over-year growth 2025-2030 (%)
Chart on Regional Comparison - North America
Data Table on Regional Comparison - North America

12.3.1 US - Market size and forecast 2025-2030

Chart on US - Market size and forecast 2025-2030 ($ million)
Data Table on US - Market size and forecast 2025-2030 ($ million)
Chart on US - Year-over-year growth 2025-2030 (%)
Data Table on US - Year-over-year growth 2025-2030 (%)

12.3.2 Canada - Market size and forecast 2025-2030

Chart on Canada - Market size and forecast 2025-2030 ($ million)
Data Table on Canada - Market size and forecast 2025-2030 ($ million)
Chart on Canada - Year-over-year growth 2025-2030 (%)
Data Table on Canada - Year-over-year growth 2025-2030 (%)

12.3.3 Mexico - Market size and forecast 2025-2030

Chart on Mexico - Market size and forecast 2025-2030 ($ million)
Data Table on Mexico - Market size and forecast 2025-2030 ($ million)
Chart on Mexico - Year-over-year growth 2025-2030 (%)
Data Table on Mexico - Year-over-year growth 2025-2030 (%)

12.4 Europe - Market size and forecast 2025-2030

Chart on Europe - Market size and forecast 2025-2030 ($ million)
Data Table on Europe - Market size and forecast 2025-2030 ($ million)
Chart on Europe - Year-over-year growth 2025-2030 (%)
Data Table on Europe - Year-over-year growth 2025-2030 (%)
Chart on Regional Comparison - Europe
Data Table on Regional Comparison - Europe

12.4.1 Germany - Market size and forecast 2025-2030

Chart on Germany - Market size and forecast 2025-2030 ($ million)
Data Table on Germany - Market size and forecast 2025-2030 ($ million)
Chart on Germany - Year-over-year growth 2025-2030 (%)
Data Table on Germany - Year-over-year growth 2025-2030 (%)

12.4.2 UK - Market size and forecast 2025-2030

Chart on UK - Market size and forecast 2025-2030 ($ million)
Data Table on UK - Market size and forecast 2025-2030 ($ million)
Chart on UK - Year-over-year growth 2025-2030 (%)
Data Table on UK - Year-over-year growth 2025-2030 (%)

12.4.3 France - Market size and forecast 2025-2030

Chart on France - Market size and forecast 2025-2030 ($ million)
Data Table on France - Market size and forecast 2025-2030 ($ million)
Chart on France - Year-over-year growth 2025-2030 (%)
Data Table on France - Year-over-year growth 2025-2030 (%)

12.4.4 Italy - Market size and forecast 2025-2030

Chart on Italy - Market size and forecast 2025-2030 ($ million)
Data Table on Italy - Market size and forecast 2025-2030 ($ million)
Chart on Italy - Year-over-year growth 2025-2030 (%)
Data Table on Italy - Year-over-year growth 2025-2030 (%)

12.4.5 The Netherlands - Market size and forecast 2025-2030

Chart on The Netherlands - Market size and forecast 2025-2030 ($ million)
Data Table on The Netherlands - Market size and forecast 2025-2030 ($ million)
Chart on The Netherlands - Year-over-year growth 2025-2030 (%)
Data Table on The Netherlands - Year-over-year growth 2025-2030 (%)

12.4.6 Spain - Market size and forecast 2025-2030

Chart on Spain - Market size and forecast 2025-2030 ($ million)
Data Table on Spain - Market size and forecast 2025-2030 ($ million)
Chart on Spain - Year-over-year growth 2025-2030 (%)
Data Table on Spain - Year-over-year growth 2025-2030 (%)

12.5 APAC - Market size and forecast 2025-2030

Chart on APAC - Market size and forecast 2025-2030 ($ million)
Data Table on APAC - Market size and forecast 2025-2030 ($ million)
Chart on APAC - Year-over-year growth 2025-2030 (%)
Data Table on APAC - Year-over-year growth 2025-2030 (%)
Chart on Regional Comparison - APAC
Data Table on Regional Comparison - APAC

12.5.1 China - Market size and forecast 2025-2030

Chart on China - Market size and forecast 2025-2030 ($ million)
Data Table on China - Market size and forecast 2025-2030 ($ million)
Chart on China - Year-over-year growth 2025-2030 (%)
Data Table on China - Year-over-year growth 2025-2030 (%)

12.5.2 Japan - Market size and forecast 2025-2030

Chart on Japan - Market size and forecast 2025-2030 ($ million)
Data Table on Japan - Market size and forecast 2025-2030 ($ million)
Chart on Japan - Year-over-year growth 2025-2030 (%)
Data Table on Japan - Year-over-year growth 2025-2030 (%)

12.5.3 India - Market size and forecast 2025-2030

Chart on India - Market size and forecast 2025-2030 ($ million)
Data Table on India - Market size and forecast 2025-2030 ($ million)
Chart on India - Year-over-year growth 2025-2030 (%)
Data Table on India - Year-over-year growth 2025-2030 (%)

12.5.4 South Korea - Market size and forecast 2025-2030

Chart on South Korea - Market size and forecast 2025-2030 ($ million)
Data Table on South Korea - Market size and forecast 2025-2030 ($ million)
Chart on South Korea - Year-over-year growth 2025-2030 (%)
Data Table on South Korea - Year-over-year growth 2025-2030 (%)

12.5.5 Australia - Market size and forecast 2025-2030

Chart on Australia - Market size and forecast 2025-2030 ($ million)
Data Table on Australia - Market size and forecast 2025-2030 ($ million)
Chart on Australia - Year-over-year growth 2025-2030 (%)
Data Table on Australia - Year-over-year growth 2025-2030 (%)

12.5.6 Indonesia - Market size and forecast 2025-2030

Chart on Indonesia - Market size and forecast 2025-2030 ($ million)
Data Table on Indonesia - Market size and forecast 2025-2030 ($ million)
Chart on Indonesia - Year-over-year growth 2025-2030 (%)
Data Table on Indonesia - Year-over-year growth 2025-2030 (%)

12.6 South America - Market size and forecast 2025-2030

Chart on South America - Market size and forecast 2025-2030 ($ million)
Data Table on South America - Market size and forecast 2025-2030 ($ million)
Chart on South America - Year-over-year growth 2025-2030 (%)
Data Table on South America - Year-over-year growth 2025-2030 (%)
Chart on Regional Comparison - South America
Data Table on Regional Comparison - South America

12.6.1 Brazil - Market size and forecast 2025-2030

Chart on Brazil - Market size and forecast 2025-2030 ($ million)
Data Table on Brazil - Market size and forecast 2025-2030 ($ million)
Chart on Brazil - Year-over-year growth 2025-2030 (%)
Data Table on Brazil - Year-over-year growth 2025-2030 (%)

12.6.2 Argentina - Market size and forecast 2025-2030

Chart on Argentina - Market size and forecast 2025-2030 ($ million)
Data Table on Argentina - Market size and forecast 2025-2030 ($ million)
Chart on Argentina - Year-over-year growth 2025-2030 (%)
Data Table on Argentina - Year-over-year growth 2025-2030 (%)

12.6.3 Colombia - Market size and forecast 2025-2030

Chart on Colombia - Market size and forecast 2025-2030 ($ million)
Data Table on Colombia - Market size and forecast 2025-2030 ($ million)
Chart on Colombia - Year-over-year growth 2025-2030 (%)
Data Table on Colombia - Year-over-year growth 2025-2030 (%)

12.7 Middle East and Africa - Market size and forecast 2025-2030

Chart on Middle East and Africa - Market size and forecast 2025-2030 ($ million)
Data Table on Middle East and Africa - Market size and forecast 2025-2030 ($ million)
Chart on Middle East and Africa - Year-over-year growth 2025-2030 (%)
Data Table on Middle East and Africa - Year-over-year growth 2025-2030 (%)
Chart on Regional Comparison - Middle East and Africa
Data Table on Regional Comparison - Middle East and Africa

12.7.1 Saudi Arabia - Market size and forecast 2025-2030

Chart on Saudi Arabia - Market size and forecast 2025-2030 ($ million)
Data Table on Saudi Arabia - Market size and forecast 2025-2030 ($ million)
Chart on Saudi Arabia - Year-over-year growth 2025-2030 (%)
Data Table on Saudi Arabia - Year-over-year growth 2025-2030 (%)

12.7.2 UAE - Market size and forecast 2025-2030

Chart on UAE - Market size and forecast 2025-2030 ($ million)
Data Table on UAE - Market size and forecast 2025-2030 ($ million)
Chart on UAE - Year-over-year growth 2025-2030 (%)
Data Table on UAE - Year-over-year growth 2025-2030 (%)

12.7.3 South Africa - Market size and forecast 2025-2030

Chart on South Africa - Market size and forecast 2025-2030 ($ million)
Data Table on South Africa - Market size and forecast 2025-2030 ($ million)
Chart on South Africa - Year-over-year growth 2025-2030 (%)
Data Table on South Africa - Year-over-year growth 2025-2030 (%)

12.7.4 Israel - Market size and forecast 2025-2030

Chart on Israel - Market size and forecast 2025-2030 ($ million)
Data Table on Israel - Market size and forecast 2025-2030 ($ million)
Chart on Israel - Year-over-year growth 2025-2030 (%)
Data Table on Israel - Year-over-year growth 2025-2030 (%)

12.7.5 Turkey - Market size and forecast 2025-2030

Chart on Turkey - Market size and forecast 2025-2030 ($ million)
Data Table on Turkey - Market size and forecast 2025-2030 ($ million)
Chart on Turkey - Year-over-year growth 2025-2030 (%)
Data Table on Turkey - Year-over-year growth 2025-2030 (%)

12.8 Market opportunity by geography

Market opportunity by geography ($ million)
Data Tables on Market opportunity by geography ($ million)

13. Drivers, Challenges, and Opportunity

13.1 Market drivers

Technological advancements and integration of AI
Rising burden of chronic diseases and critical scarcity of pathological expertise
Expansion of telepathology networks and multi-institutional collaboration

13.2 Market challenges

High initial capital expenditure and sustained infrastructure demands
Interoperability issues and complex integration with legacy systems
Regulatory compliance hurdles and data privacy security risks

13.3 Impact of drivers and challenges

Impact of drivers and challenges in 2025 and 2030

13.4 Market opportunities

Migration toward cloud-native architectures and software as service delivery models
Integration of multimodal data and emergence of integrative diagnostics
Shift toward open ecosystems and company-neutral software architectures

14. Competitive Landscape

14.1 Overview

14.2

Overview on criticality of inputs and factors of differentiation

14.3 Landscape disruption

Overview on factors of disruption

14.4 Industry risks

Impact of key risks on business

15. Competitive Analysis

15.1 Companies profiled

Companies covered

15.2 Company ranking index

15.3 Market positioning of companies

Matrix on companies position and classification

15.4 Aiforia Technologies PLC

Aiforia Technologies PLC - Overview
Aiforia Technologies PLC - Product / Service
Aiforia Technologies PLC - Key offerings
SWOT

15.5 Corista

Corista - Overview
Corista - Product / Service
Corista - Key offerings
SWOT

15.6 F. Hoffmann La Roche Ltd.

F. Hoffmann La Roche Ltd. - Overview
F. Hoffmann La Roche Ltd. - Business segments
F. Hoffmann La Roche Ltd. - Key news
F. Hoffmann La Roche Ltd. - Key offerings
F. Hoffmann La Roche Ltd. - Segment focus
SWOT

15.7 FUJIFILM Holdings Corp.

FUJIFILM Holdings Corp. - Overview
FUJIFILM Holdings Corp. - Business segments
FUJIFILM Holdings Corp. - Key news
FUJIFILM Holdings Corp. - Key offerings
FUJIFILM Holdings Corp. - Segment focus
SWOT

15.8 Gestalt Diagnostics

Gestalt Diagnostics - Overview
Gestalt Diagnostics - Product / Service
Gestalt Diagnostics - Key offerings
SWOT

15.9 Ibex Medical Analytics

Ibex Medical Analytics - Overview
Ibex Medical Analytics - Product / Service
Ibex Medical Analytics - Key offerings
SWOT

15.10 Indica Labs LLC.

Indica Labs LLC. - Overview
Indica Labs LLC. - Product / Service
Indica Labs LLC. - Key offerings
SWOT

15.11 Koninklijke Philips NV

Koninklijke Philips NV - Overview
Koninklijke Philips NV - Business segments
Koninklijke Philips NV - Key news
Koninklijke Philips NV - Key offerings
Koninklijke Philips NV - Segment focus
SWOT

15.12 Leica Biosystems Nussloch GmbH

Leica Biosystems Nussloch GmbH - Overview
Leica Biosystems Nussloch GmbH - Product / Service
Leica Biosystems Nussloch GmbH - Key offerings
SWOT

15.13 Paige AI Inc.

Paige AI Inc. - Overview
Paige AI Inc. - Product / Service
Paige AI Inc. - Key offerings
SWOT

15.14 PathAI Inc.

PathAI Inc. - Overview
PathAI Inc. - Product / Service
PathAI Inc. - Key offerings
SWOT

15.15 Proscia Inc.

Proscia Inc. - Overview
Proscia Inc. - Product / Service
Proscia Inc. - Key offerings
SWOT

15.16 Sectra AB

Sectra AB - Overview
Sectra AB - Business segments
Sectra AB - Key offerings
Sectra AB - Segment focus
SWOT

15.17 Tribun Health

Tribun Health - Overview
Tribun Health - Product / Service
Tribun Health - Key offerings
SWOT

15.18 Visiopharm AS

Visiopharm AS - Overview
Visiopharm AS - Product / Service
Visiopharm AS - Key news
Visiopharm AS - Key offerings
SWOT

16. Appendix

16.1 Scope of the report

Market definition
Objectives
Notes and caveats

16.2 Inclusions and exclusions checklist

Inclusions checklist
Exclusions checklist

16.3 Currency conversion rates for US$

16.4 Research methodology

16.5 Data procurement

Information sources

16.6 Data validation

16.7 Validation techniques employed for market sizing

16.8 Data synthesis

16.9 360 degree market analysis

16.10 List of abbreviations

Research Methodology

Technavio presents a detailed picture of the market by way of study, synthesis, and summation of data from multiple sources. The analysts have presented the various facets of the market with a particular focus on identifying the key industry influencers. The data thus presented is comprehensive, reliable, and the result of extensive research, both primary and secondary.

INFORMATION SOURCES

Primary sources

  • Manufacturers and suppliers
  • Channel partners
  • Industry experts
  • Strategic decision makers

Secondary sources

  • Industry journals and periodicals
  • Government data
  • Financial reports of key industry players
  • Historical data
  • Press releases

DATA ANALYSIS

Data Synthesis

  • Collation of data
  • Estimation of key figures
  • Analysis of derived insights

Data Validation

  • Triangulation with data models
  • Reference against proprietary databases
  • Corroboration with industry experts

REPORT WRITING

Qualitative

  • Market drivers
  • Market challenges
  • Market trends
  • Five forces analysis

Quantitative

  • Market size and forecast
  • Market segmentation
  • Geographical insights
  • Competitive landscape

Interested in this report?

Get your sample now to see our research methodology and insights!

Download Now

Frequently Asked Questions

Digital Pathology Workflow Software market growth will increase by USD 167.7 million during 2026-2030.

The Digital Pathology Workflow Software market is expected to grow at a CAGR of 14.1% during 2026-2030.

Digital Pathology Workflow Software market is segmented by Deployment (Cloud based, On premises) Application (Disease diagnosis, Drug discovery and development, Academic research and training, Others) End-user (Hospitals and reference laboratories, Clinical laboratories, Pharmaceutical companies, Others)

3DHISTECH Ltd., Aiforia Technologies PLC, Corista, Dedalus Group, F. Hoffmann La Roche Ltd., FUJIFILM Holdings Corp., Gestalt Diagnostics, Hamamatsu Photonics KK, Huron Digital Pathology, Ibex Medical Analytics, Indica Labs LLC., Koninklijke Philips NV, Leica Biosystems Nussloch GmbH, Mikroscan Technologies Inc., Paige AI Inc., PathAI Inc., Proscia Inc., Sectra AB, Tribun Health, Visiopharm AS are a few of the key vendors in the Digital Pathology Workflow Software market.

North America will register the highest growth rate of 40.2% among the other regions. Therefore, the Digital Pathology Workflow Software market in North America is expected to garner significant business opportunities for the vendors during the forecast period.

US, Canada, Mexico, Germany, UK, France, Italy, The Netherlands, Spain, China, Japan, India, South Korea, Australia, Indonesia, Brazil, Argentina, Colombia, Saudi Arabia, UAE, South Africa, Israel, Turkey

  • Technological advancements and integration of AI is the driving factor this market.

The Digital Pathology Workflow Software market vendors should focus on grabbing business opportunities from the Deployment segment as it accounted for the largest market share in the base year.
RIA - Research AI Assistant
Ask RIA