Decorative Accessories Market Analysis, Size, and Forecast 2026-2030: North America (US, Canada, and Mexico), APAC (China, India, and Japan), Europe (Germany, UK, and France), Middle East and Africa (Saudi Arabia, UAE, and South Africa), South America (Brazil, Argentina, and Colombia), and Rest of World (ROW)

Decorative Accessories Market Analysis, Size, and Forecast 2026-2030:
North America (US, Canada, and Mexico), APAC (China, India, and Japan), Europe (Germany, UK, and France), Middle East and Africa (Saudi Arabia, UAE, and South Africa), South America (Brazil, Argentina, and Colombia), and Rest of World (ROW)

Published: May 2026 311 Pages SKU: IRTNTR81404

Market Overview at a Glance

$40.59 B
Market Opportunity
5.8%
CAGR 2025 - 2030
34.8%
APAC Growth
$39.76 B
Lamp and lighting accessories segment 2024

Decorative Accessories Market Size and Growth Forecast 2026-2030

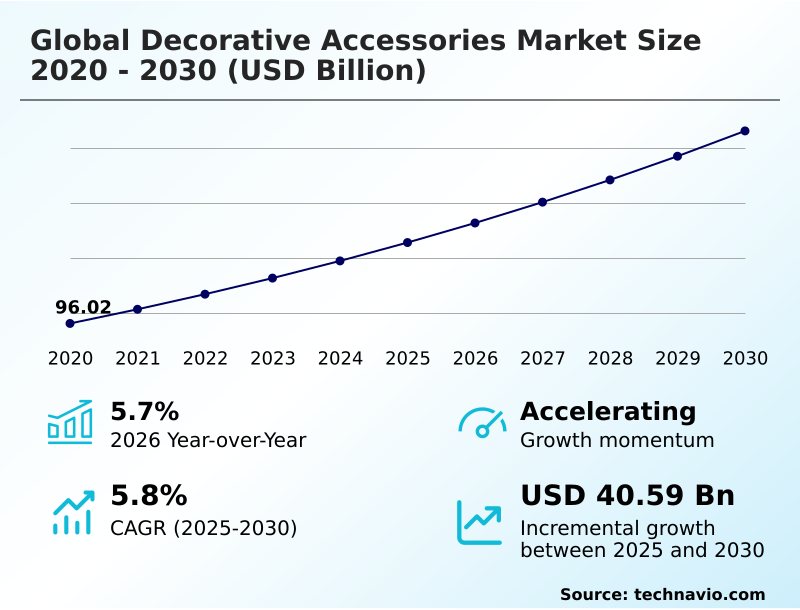
The Decorative Accessories Market size was valued at USD 125.44 billion in 2025 growing at a CAGR of 5.8% during the forecast period 2026-2030.

APAC accounts for 34.8% of incremental growth during the forecast period. The Lamp and lighting accessories segment by Product Type was valued at USD 39.76 billion in 2024, while the Metal segment holds the largest revenue share by Material.

The market is projected to grow by USD 70.01 billion from 2020 to 2030, with USD 40.59 billion of the growth expected during the forecast period of 2025 to 2030.

Get Key Insights on Market Forecast (PDF) Request Free Sample

Decorative Accessories Market Overview

The decorative accessories market is shaped by a consumer shift towards personal expression and environmental consciousness. With the APAC region contributing nearly 35% of incremental growth, driven by rapid urbanization, demand is surging for products that enhance compact living spaces while reflecting sustainable materials. This has pushed manufacturers to innovate beyond traditional aesthetics, embracing artisanal ceramics and reclaimed wood accessories. A key dynamic is the adoption of circular economy models, where lifecycle management becomes a critical vendor qualification criterion. For instance, a boutique hotel chain now employs generative AI design platforms to create unique, 3D-printed decor for each property, sourcing from suppliers with verifiable fair-trade certification. This strategy not only allows for extreme hyper-personalization but also aligns with corporate ESG mandates under frameworks like the Global Reporting Initiative, reducing waste by producing statement pieces on-demand and strengthening brand identity through heritage craftsmanship.

Drivers, Trends, and Challenges in the Decorative Accessories Market

The impact of urbanization on home decor trends is a primary force shaping the decorative accessories market, as smaller living spaces in metropolitan areas necessitate multi-functional and visually impactful items. This demographic shift amplifies the consumer demand for sustainable home accessories, compelling manufacturers to rethink material science and supply chains. However, meeting this demand presents challenges.

For example, a small artisanal cooperative specializing in hand-painted ceramics may struggle with the high costs of obtaining fair-trade certifications, making it difficult to compete with larger players despite offering authentic products. The role of social media in interior design purchases further complicates the landscape, creating hyper-accelerated trend cycles and putting immense pressure on inventory management.

These digital dynamics are a key reason the online channel's growth significantly outpaces that of traditional offline retail. Compounding these issues are systemic risks, including persistent supply chain challenges in the decorative accessories market and the rising tide of intellectual property infringement in furniture and decor design, which devalues original work.

Stricter regulations, such as the US Environmental Protection Agency's recent restrictions on chemical stabilizers in resins, add another layer of complexity, forcing costly product reformulations and heightening the need for robust compliance frameworks.

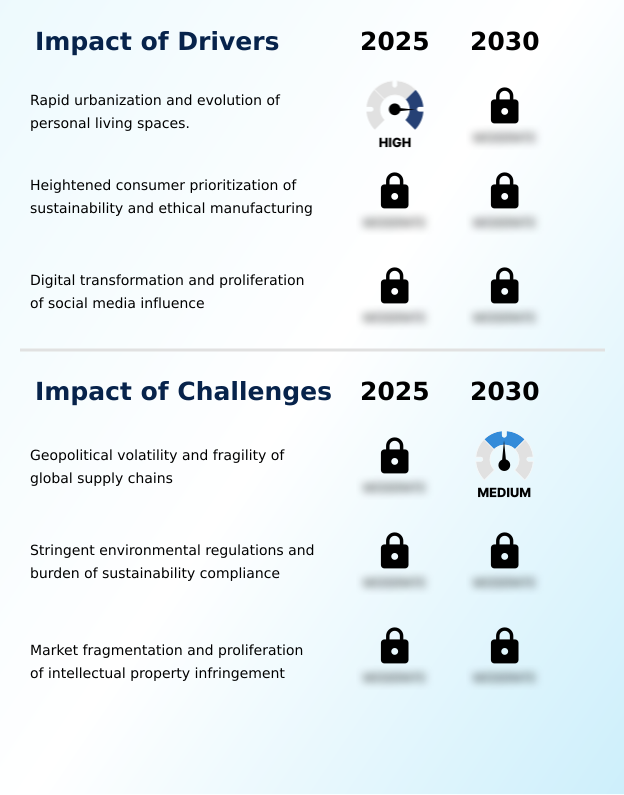
Primary Growth Driver: Rapid urbanization and the concurrent evolution of personal living spaces function as key drivers for the market.

Market growth is fundamentally driven by rapid urbanization and a corresponding evolution in consumer values. With APAC accounting for 34.8% of the market's incremental growth, the demand for accessories suited to compact urban dwellings is a significant catalyst.

This urban consumer is also increasingly ethically-minded, fueling the shift toward sustainable materials and transparent production. This is compelling manufacturers to adopt circular economy models and invest in ethical sourcing networks.

The influence of digital platforms further accelerates these shifts, as social media disseminates trends like biophilic design globally, while augmented reality visualization tools on e-commerce sites de-risk online purchases, driving conversion for items with rich organic textures.

Emerging Market Trend: A key market trend involves the integration of biophilic principles and natural aesthetics. This movement reflects a growing consumer desire to connect indoor environments with the natural world.

Market trends are defined by a divergence between technology-driven customization and a return to authentic craftsmanship. The push for hyper-personalization is being met with digital customization tools, including generative AI design platforms that allow consumers to create bespoke accessories.

This is particularly prevalent in the fast-growing APAC market, where technological adoption is high and contributes to a regional growth rate of 6.6%. Concurrently, a counter-trend sees a resurgence in demand for maximalism decor, celebrating heritage craftsmanship and handcrafted details.

This has elevated the importance of artisanal ceramics and unique statement pieces, moving consumer preferences away from mass-produced, fast-fashion home decor toward items with narrative and heirloom quality.

Key Industry Challenge: Geopolitical volatility and the inherent fragility of global supply chains present a primary challenge affecting industry growth and stability.

Significant structural challenges constrain the market, led by supply chain fragility and intense market fragmentation. Geopolitical instability disrupts the flow of raw materials, impacting the availability of key components for products like hand-woven textiles. Domestically, stringent environmental mandates, such as regulations governing the composition of eco-friendly glazes on ceramics, impose significant compliance costs, particularly on smaller artisans.

Furthermore, the proliferation of digital marketplaces has exacerbated the problem of intellectual property infringement, devaluing original design work from independent creators of sculptural lighting and other unique items. While frameworks from organizations like the World Intellectual Property Organization (WIPO) aim to combat counterfeiting, the sheer volume of unauthorized replicas makes enforcement a persistent and costly battle, stifling innovation.

Explore Full Market Dynamics Analysis Request Free Sample

Decorative Accessories Market Segmentation

The decorative accessories industry research report provides comprehensive data including region-wise segment analysis, with forecasts and analysis for the period 2026-2030, as well as historical data from 2020-2024 for the following segments.

Market Segment by Product type
  • Lamp and lighting accessories
  • Pottery and vases
  • Pillows and cushions
  • Rugs and carpets
  • Others
Market Segment by Material
  • Metal
  • Glass and ceramic
  • Wood
  • Textile
  • Others
Market Segment by Distribution channel
  • Offline
  • Online
Market Segment by Geography
North America
US, Canada, Mexico
APAC
China, India, Japan, South Korea, Australia, Indonesia
Europe
Germany, UK, France, Italy, The Netherlands, Spain
Middle East and Africa
Saudi Arabia, UAE, South Africa, Israel, Turkey
South America
Brazil, Argentina, Colombia

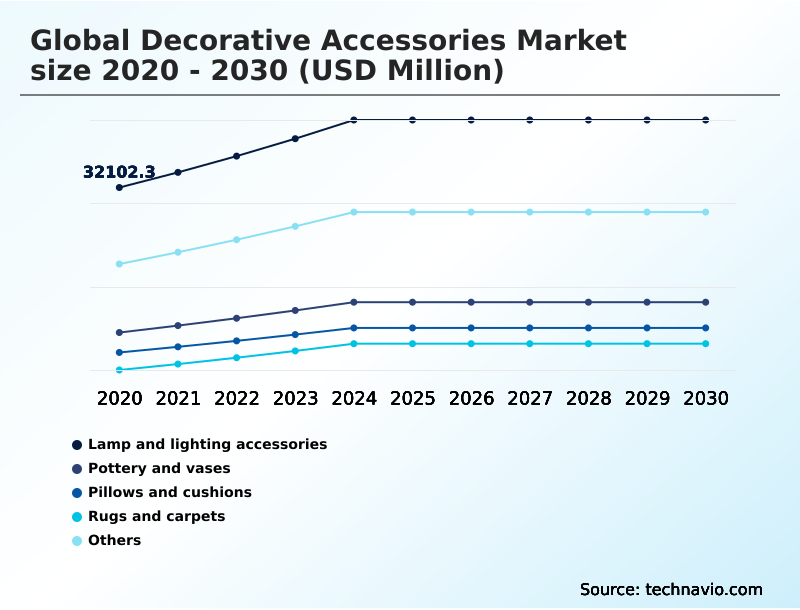
Product Type Segment Analysis

The lamp and lighting accessories segment is estimated to witness significant growth during the forecast period.

The lamp and lighting accessories segment, a leading category by market share, is evolving beyond simple illumination to become a focal point of interior design strategy.

Procurement decisions are increasingly influenced by the dual demands for functionality and artistic expression, with sculptural lighting serving as a primary example of fixtures that function as art.

The integration of smart ornamentation allows for advanced control over ambiance, aligning with the trend toward hyper-personalization. A significant shift in materials is evident, with manufacturers incorporating innovative bio-based polymers and recycled components, meeting stringent environmental standards like RoHS.

Furthermore, the adoption of modular design principles offers consumers greater flexibility, reinforcing the trend toward contemporary aesthetics in residential and commercial spaces.

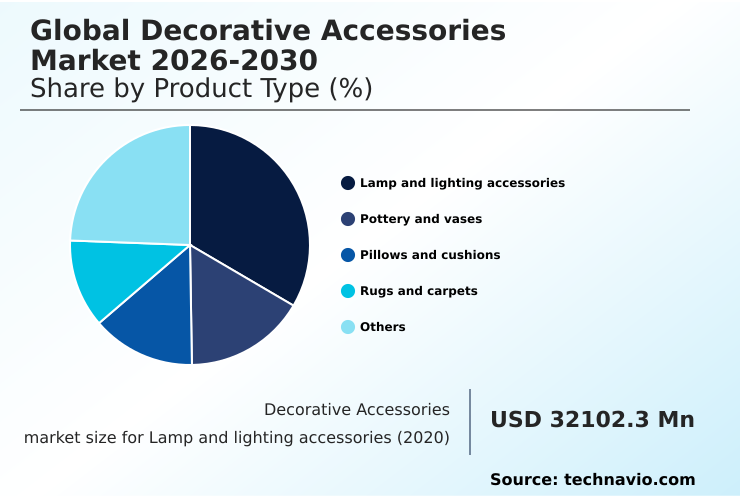
The Lamp and lighting accessories segment was valued at USD 39.76 billion in 2024 and showed a gradual increase during the forecast period.

Decorative Accessories Market by Region: APAC Leads with 34.8% Growth Share

APAC is estimated to contribute 34.8% to the growth of the global market during the forecast period.

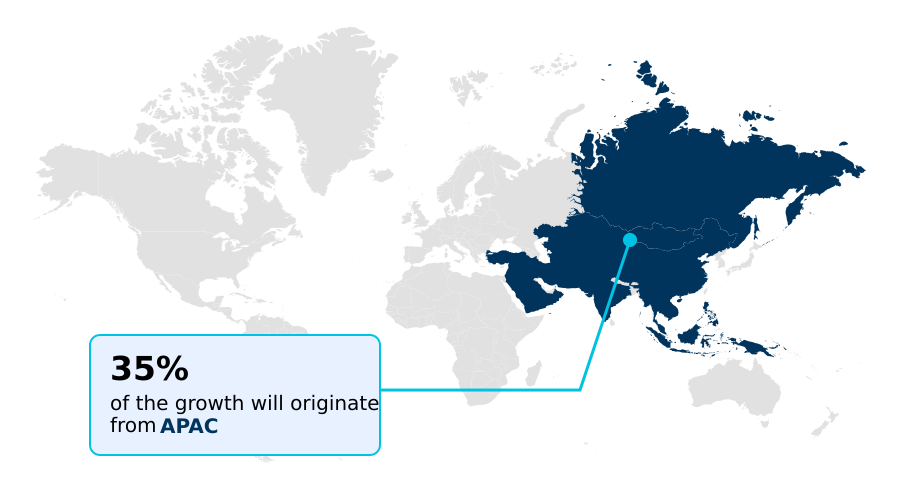
The geographic landscape of the decorative accessories market is increasingly centered on APAC, which commands over a third of the market opportunity and is forecast to expand at a rate of 6.6%.

This growth is fueled by a rising middle class in China and India demanding modern home personalization, blending global contemporary aesthetics with traditional cultural motifs.

In contrast, the mature markets of North America and Europe, while growing more slowly, are setting global standards for sustainability.

European consumers, in particular, are driving demand for biophilic design and products with clear ethical sourcing networks, pushing brands to comply with stringent regulations like REACH.

This regional divergence creates a complex operational environment where success depends on catering to both the volume-driven, trend-focused APAC market and the value-driven, eco-conscious Western markets.

Customer Landscape Analysis for the Decorative Accessories Market

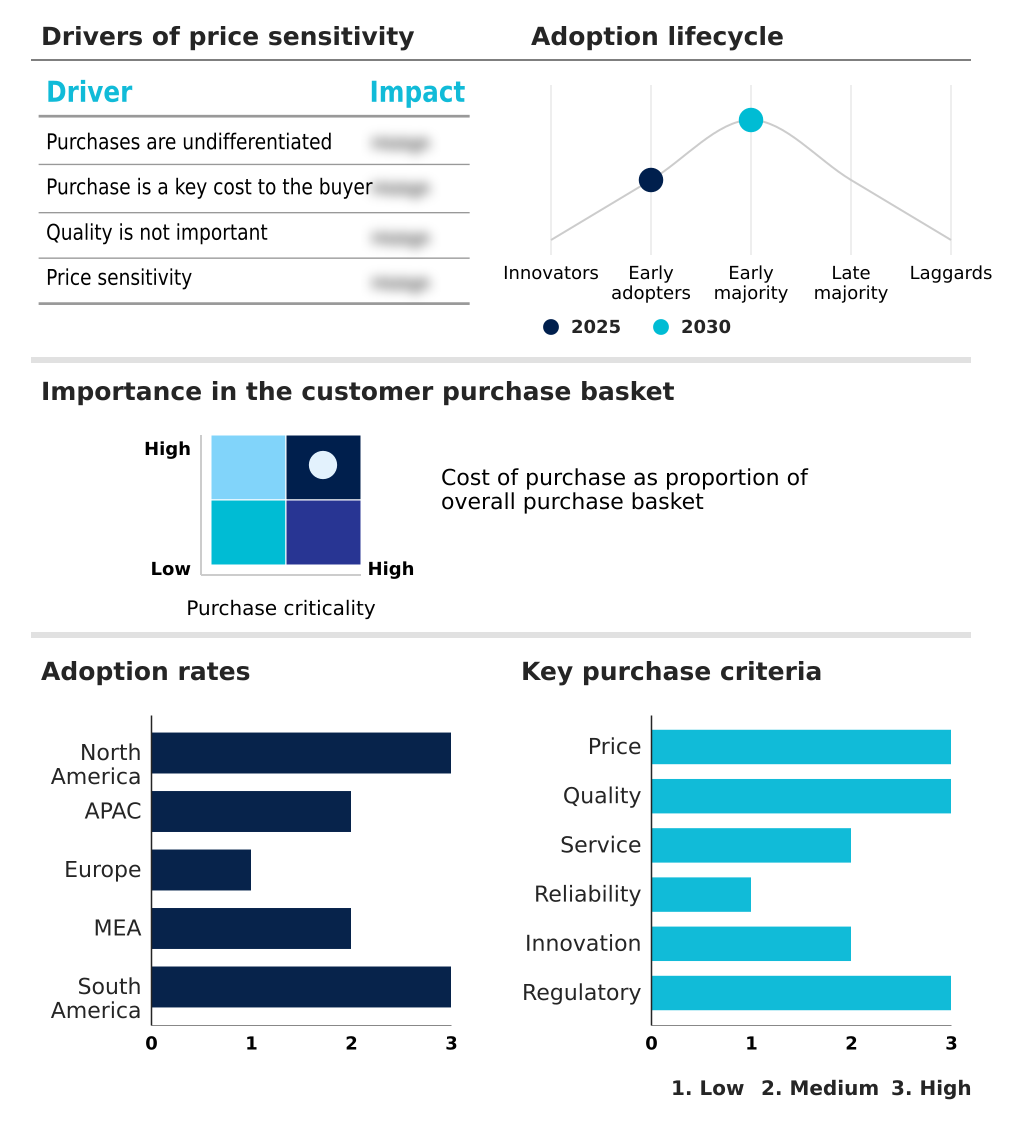
The decorative accessories market forecasting report includes the adoption lifecycle of the market, covering from the innovator’s stage to the laggard’s stage. It focuses on adoption rates in different regions based on penetration. Furthermore, the decorative accessories market report also includes key purchase criteria and drivers of price sensitivity to help companies evaluate and develop their market growth analysis strategies.

Competitive Landscape of the Decorative Accessories Market

Companies are implementing various strategies, such as strategic alliances, partnerships, mergers and acquisitions, geographical expansion, and product/service launches, to enhance their presence in the decorative accessories market industry.

Amazon.com Inc. - Offers a vast catalog of decorative accessories, including wall art and textiles, through its globally recognized e-commerce and subscription service segments.

The industry research and growth report includes detailed analyses of the competitive landscape of the market and information about key companies, including:

  • Amazon.com Inc.
  • Ashley Furniture Industries
  • Crate and Barrel
  • Ethan Allen Interiors Inc.
  • Georg Jensen AS
  • H and M Hennes and Mauritz GBC
  • Inter IKEA Holding BV
  • LaZBoy Inc.
  • Maisons du Monde
  • MillerKnoll Inc.
  • Pier 1 Imports Online Inc.
  • Restoration Hardware Inc.
  • Swarovski AG
  • Target Corp.
  • Urban Outfitters Inc.
  • Villeroy and Boch AG
  • Walmart Inc.
  • Wayfair Inc.
  • Wedgwood
  • Williams Sonoma Inc.

Qualitative and quantitative analysis of companies has been conducted to help clients understand the wider business environment as well as the strengths and weaknesses of key industry players. Data is qualitatively analyzed to categorize companies as pure play, category-focused, industry-focused, and diversified; it is quantitatively analyzed to categorize companies as dominant, leading, strong, tentative, and weak.

Recent Developments in the Decorative Accessories Market

  • In March 2025, the International Maritime Organization enacted stringent new carbon intensity regulations for commercial shipping, impacting global logistics and delivery lead times for consumer goods.
  • In May 2025, Williams Sonoma Inc. launched an initiative to increase Forest Stewardship Council certification for its decorative wooden accents, emphasizing its commitment to ethical sourcing.
  • In June 2025, H and M Hennes and Mauritz GBC announced a partnership with a textile recycling firm to produce an autumn accessory line using circular fibers and non-toxic dyes.
  • In August 2025, the US Environmental Protection Agency finalized new restrictions on chemical stabilizers in decorative plastic and resin items, requiring product reformulations across the industry.

Research Analyst Overview: Decorative Accessories Market

Boardroom-level strategy in the decorative accessories market is increasingly centered on navigating the twin pressures of sustainability compliance and technological disruption. While the lamp and lighting accessories segment remains a dominant revenue contributor, its growth is now contingent on integrating smart ornamentation and adhering to circular economy principles.

Investment decisions must now account for the total cost of ownership of establishing ethical sourcing networks and securing fair-trade certification, which are becoming non-negotiable for consumers in key Western markets. A critical operational focus is the adoption of sustainable materials, such as bio-based polymers and upcycled glass, in alignment with standards like those from the Forest Stewardship Council (FSC).

This shift away from linear production is essential for risk mitigation. The rise of generative AI design and on-demand 3D-printed decor offers a path to mitigate inventory risk associated with maximalism decor trends, enabling hyper-personalization while reducing waste. Firms that successfully integrate biophilic design principles with advanced manufacturing will capture a significant competitive advantage.

Dive into Technavio’s robust research methodology, blending expert interviews, extensive data synthesis, and validated models for unparalleled Decorative Accessories Market insights. See full methodology.

Request Free Sample

Market Scope
Page number 311
Base year 2025
Historic period 2020-2024
Forecast period 2026-2030
Growth momentum & CAGR Accelerate at a CAGR of 5.8%
Market growth 2026-2030 USD 40592.7 million
Market structure Fragmented
YoY growth 2025-2026(%) 5.7%
Key countries US, Canada, Mexico, China, India, Japan, South Korea, Australia, Indonesia, Germany, UK, France, Italy, The Netherlands, Spain, Saudi Arabia, UAE, South Africa, Israel, Turkey, Brazil, Argentina and Colombia
Competitive landscape Leading Companies, Market Positioning of Companies, Competitive Strategies, and Industry Risks

Decorative Accessories Market: Key Questions Answered in This Report

  • What is the expected growth of the Decorative Accessories Market between 2026 and 2030?

    • The Decorative Accessories Market is expected to grow by USD 40.59 billion during 2026-2030, registering a CAGR of 5.8%. Year-over-year growth in 2026 is estimated at 5.7%%. This acceleration is shaped by rapid urbanization and evolution of personal living spaces., which is intensifying demand across multiple end-use verticals covered in the report.

  • What segmentation does the market report cover?

    • The report is segmented by Product Type (Lamp and lighting accessories, Pottery and vases, Pillows and cushions, Rugs and carpets, and Others), Material (Metal, Glass and ceramic, Wood, Textile, and Others), Distribution Channel (Offline, and Online) and Geography (North America, APAC, Europe, Middle East and Africa, South America). Among these, the Lamp and lighting accessories segment is estimated to witness significant growth during the forecast period, driven by rising adoption across key application areas. Each segment includes detailed qualitative and quantitative analysis, along with historical data from 2020-2024 and forecasts through 2030 with year-over-year growth rates.

  • Which regions are analyzed in the report?

    • The report covers North America, APAC, Europe, Middle East and Africa and South America. APAC is estimated to contribute 34.8% to market growth during the forecast period. Country-level analysis includes US, Canada, Mexico, China, India, Japan, South Korea, Australia, Indonesia, Germany, UK, France, Italy, The Netherlands, Spain, Saudi Arabia, UAE, South Africa, Israel, Turkey, Brazil, Argentina and Colombia, with dedicated market size tables and year-over-year growth for each.

  • What are the key growth drivers and market challenges?

    • The primary driver is rapid urbanization and evolution of personal living spaces., which is accelerating investment and industry demand. The main challenge is geopolitical volatility and fragility of global supply chains, creating operational barriers for key market participants. The report quantifies the impact of each driver and challenge across 2026 and 2030 with comparative analysis.

  • Who are the major players in the Decorative Accessories Market?

    • Key vendors include Amazon.com Inc., Ashley Furniture Industries, Crate and Barrel, Ethan Allen Interiors Inc., Georg Jensen AS, H and M Hennes and Mauritz GBC, Inter IKEA Holding BV, LaZBoy Inc., Maisons du Monde, MillerKnoll Inc., Pier 1 Imports Online Inc., Restoration Hardware Inc., Swarovski AG, Target Corp., Urban Outfitters Inc., Villeroy and Boch AG, Walmart Inc., Wayfair Inc., Wedgwood and Williams Sonoma Inc.. The report provides qualitative and quantitative analysis categorizing companies as dominant, leading, strong, tentative, and weak based on their market positioning. Company profiles include business segment analysis, SWOT assessment, key offerings, and recent strategic developments.

Decorative Accessories Market Research Insights

The decorative accessories market is expanding at a steady 5.7% year-over-year rate, a dynamic driven by the consumer quest for curated collections and handcrafted details. This is not merely about aesthetics; it is a shift toward values-based purchasing, where the story behind an object matters.

The rise of direct-to-consumer models has empowered smaller artisans, but the entire industry faces structural pressures from new International Maritime Organization carbon regulations, which complicate logistics for globally sourced goods. In response, many brands are leveraging augmented reality visualization to enhance the experiential retail journey online, allowing customers to virtually place mixed-media pieces in their homes.

This digital pivot is crucial for navigating supply chain disruptions while meeting demand for unique, personalized environments.

We can help! Our analysts can customize this decorative accessories market research report to meet your requirements.

Get in touch

1. Executive Summary

1.1 Market overview

Executive Summary - Chart on Market Overview
Executive Summary - Data Table on Market Overview
Executive Summary - Chart on Global Market Characteristics
Executive Summary - Chart on Market by Geography
Executive Summary - Chart on Market Segmentation by Product Type
Executive Summary - Chart on Market Segmentation by Material
Executive Summary - Chart on Market Segmentation by Distribution Channel
Executive Summary - Chart on Incremental Growth
Executive Summary - Data Table on Incremental Growth
Executive Summary - Chart on Company Market Positioning

2. Technavio Analysis

2.1 Analysis of price sensitivity, lifecycle, customer purchase basket, adoption rates, and purchase criteria

2.2 Criticality of inputs and Factors of differentiation

Chart on Overview on criticality of inputs and factors of differentiation

2.3 Factors of disruption

Chart on Overview on factors of disruption

2.4 Impact of drivers and challenges

Chart on Impact of drivers and challenges in 2025 and 2030

3. Market Landscape

3.1 Market ecosystem

Chart on Parent Market
Data Table on - Parent Market

3.2 Market characteristics

Chart on Market characteristics analysis

3.3 Value chain analysis

Chart on Value chain analysis

4. Market Sizing

4.1 Market definition

Data Table on Offerings of companies included in the market definition

4.2 Market segment analysis

Market segments

4.3 Market size 2025

4.4 Market outlook: Forecast for 2025-2030

Chart on Global - Market size and forecast 2025-2030 ($ million)
Data Table on Global - Market size and forecast 2025-2030 ($ million)
Chart on Global Market: Year-over-year growth 2025-2030 (%)
Data Table on Global Market: Year-over-year growth 2025-2030 (%)

5. Historic Market Size

5.1 Global Decorative Accessories Market 2020 - 2024

Historic Market Size - Data Table on Global Decorative Accessories Market 2020 - 2024 ($ million)

5.2 Product Type segment analysis 2020 - 2024

Historic Market Size - Product Type Segment 2020 - 2024 ($ million)

5.3 Material segment analysis 2020 - 2024

Historic Market Size - Material Segment 2020 - 2024 ($ million)

5.4 Distribution Channel segment analysis 2020 - 2024

Historic Market Size - Distribution Channel Segment 2020 - 2024 ($ million)

5.5 Geography segment analysis 2020 - 2024

Historic Market Size - Geography Segment 2020 - 2024 ($ million)

5.6 Country segment analysis 2020 - 2024

Historic Market Size - Country Segment 2020 - 2024 ($ million)

6. Qualitative Analysis

6.1 The AI impact on Global Decorative Accessories Market

6.2 Impact of geopolitical conflicts on Global Decorative Accessories Market

7. Five Forces Analysis

7.1 Five forces summary

Five forces analysis - Comparison between 2025 and 2030

7.2 Bargaining power of buyers

Bargaining power of buyers - Impact of key factors 2025 and 2030

7.3 Bargaining power of suppliers

Bargaining power of suppliers - Impact of key factors in 2025 and 2030

7.4 Threat of new entrants

Threat of new entrants - Impact of key factors in 2025 and 2030

7.5 Threat of substitutes

Threat of substitutes - Impact of key factors in 2025 and 2030

7.6 Threat of rivalry

Threat of rivalry - Impact of key factors in 2025 and 2030

7.7 Market condition

Chart on Market condition - Five forces 2025 and 2030

8. Market Segmentation by Product Type

8.1 Market segments

Chart on Product Type - Market share 2025-2030 (%)
Data Table on Product Type - Market share 2025-2030 (%)

8.2 Comparison by Product Type

Chart on Comparison by Product Type
Data Table on Comparison by Product Type

8.3 Lamp and lighting accessories - Market size and forecast 2025-2030

Chart on Lamp and lighting accessories - Market size and forecast 2025-2030 ($ million)
Data Table on Lamp and lighting accessories - Market size and forecast 2025-2030 ($ million)
Chart on Lamp and lighting accessories - Year-over-year growth 2025-2030 (%)
Data Table on Lamp and lighting accessories - Year-over-year growth 2025-2030 (%)

8.4 Pottery and vases - Market size and forecast 2025-2030

Chart on Pottery and vases - Market size and forecast 2025-2030 ($ million)
Data Table on Pottery and vases - Market size and forecast 2025-2030 ($ million)
Chart on Pottery and vases - Year-over-year growth 2025-2030 (%)
Data Table on Pottery and vases - Year-over-year growth 2025-2030 (%)

8.5 Pillows and cushions - Market size and forecast 2025-2030

Chart on Pillows and cushions - Market size and forecast 2025-2030 ($ million)
Data Table on Pillows and cushions - Market size and forecast 2025-2030 ($ million)
Chart on Pillows and cushions - Year-over-year growth 2025-2030 (%)
Data Table on Pillows and cushions - Year-over-year growth 2025-2030 (%)

8.6 Rugs and carpets - Market size and forecast 2025-2030

Chart on Rugs and carpets - Market size and forecast 2025-2030 ($ million)
Data Table on Rugs and carpets - Market size and forecast 2025-2030 ($ million)
Chart on Rugs and carpets - Year-over-year growth 2025-2030 (%)
Data Table on Rugs and carpets - Year-over-year growth 2025-2030 (%)

8.7 Others - Market size and forecast 2025-2030

Chart on Others - Market size and forecast 2025-2030 ($ million)
Data Table on Others - Market size and forecast 2025-2030 ($ million)
Chart on Others - Year-over-year growth 2025-2030 (%)
Data Table on Others - Year-over-year growth 2025-2030 (%)

8.8 Market opportunity by Product Type

Market opportunity by Product Type ($ million)
Data Table on Market opportunity by Product Type ($ million)

9. Market Segmentation by Material

9.1 Market segments

Chart on Material - Market share 2025-2030 (%)
Data Table on Material - Market share 2025-2030 (%)

9.2 Comparison by Material

Chart on Comparison by Material
Data Table on Comparison by Material

9.3 Metal - Market size and forecast 2025-2030

Chart on Metal - Market size and forecast 2025-2030 ($ million)
Data Table on Metal - Market size and forecast 2025-2030 ($ million)
Chart on Metal - Year-over-year growth 2025-2030 (%)
Data Table on Metal - Year-over-year growth 2025-2030 (%)

9.4 Glass and ceramic - Market size and forecast 2025-2030

Chart on Glass and ceramic - Market size and forecast 2025-2030 ($ million)
Data Table on Glass and ceramic - Market size and forecast 2025-2030 ($ million)
Chart on Glass and ceramic - Year-over-year growth 2025-2030 (%)
Data Table on Glass and ceramic - Year-over-year growth 2025-2030 (%)

9.5 Wood - Market size and forecast 2025-2030

Chart on Wood - Market size and forecast 2025-2030 ($ million)
Data Table on Wood - Market size and forecast 2025-2030 ($ million)
Chart on Wood - Year-over-year growth 2025-2030 (%)
Data Table on Wood - Year-over-year growth 2025-2030 (%)

9.6 Textile - Market size and forecast 2025-2030

Chart on Textile - Market size and forecast 2025-2030 ($ million)
Data Table on Textile - Market size and forecast 2025-2030 ($ million)
Chart on Textile - Year-over-year growth 2025-2030 (%)
Data Table on Textile - Year-over-year growth 2025-2030 (%)

9.7 Others - Market size and forecast 2025-2030

Chart on Others - Market size and forecast 2025-2030 ($ million)
Data Table on Others - Market size and forecast 2025-2030 ($ million)
Chart on Others - Year-over-year growth 2025-2030 (%)
Data Table on Others - Year-over-year growth 2025-2030 (%)

9.8 Market opportunity by Material

Market opportunity by Material ($ million)
Data Table on Market opportunity by Material ($ million)

10. Market Segmentation by Distribution Channel

10.1 Market segments

Chart on Distribution Channel - Market share 2025-2030 (%)
Data Table on Distribution Channel - Market share 2025-2030 (%)

10.2 Comparison by Distribution Channel

Chart on Comparison by Distribution Channel
Data Table on Comparison by Distribution Channel

10.3 Offline - Market size and forecast 2025-2030

Chart on Offline - Market size and forecast 2025-2030 ($ million)
Data Table on Offline - Market size and forecast 2025-2030 ($ million)
Chart on Offline - Year-over-year growth 2025-2030 (%)
Data Table on Offline - Year-over-year growth 2025-2030 (%)

10.4 Online - Market size and forecast 2025-2030

Chart on Online - Market size and forecast 2025-2030 ($ million)
Data Table on Online - Market size and forecast 2025-2030 ($ million)
Chart on Online - Year-over-year growth 2025-2030 (%)
Data Table on Online - Year-over-year growth 2025-2030 (%)

10.5 Market opportunity by Distribution Channel

Market opportunity by Distribution Channel ($ million)
Data Table on Market opportunity by Distribution Channel ($ million)

11. Customer Landscape

11.1 Customer landscape overview

Analysis of price sensitivity, lifecycle, customer purchase basket, adoption rates, and purchase criteria

12. Geographic Landscape

12.1 Geographic segmentation

Chart on Market share by geography 2025-2030 (%)
Data Table on Market share by geography 2025-2030 (%)

12.2 Geographic comparison

Chart on Geographic comparison
Data Table on Geographic comparison

12.3 North America - Market size and forecast 2025-2030

Chart on North America - Market size and forecast 2025-2030 ($ million)
Data Table on North America - Market size and forecast 2025-2030 ($ million)
Chart on North America - Year-over-year growth 2025-2030 (%)
Data Table on North America - Year-over-year growth 2025-2030 (%)
Chart on Regional Comparison - North America
Data Table on Regional Comparison - North America

12.3.1 US - Market size and forecast 2025-2030

Chart on US - Market size and forecast 2025-2030 ($ million)
Data Table on US - Market size and forecast 2025-2030 ($ million)
Chart on US - Year-over-year growth 2025-2030 (%)
Data Table on US - Year-over-year growth 2025-2030 (%)

12.3.2 Canada - Market size and forecast 2025-2030

Chart on Canada - Market size and forecast 2025-2030 ($ million)
Data Table on Canada - Market size and forecast 2025-2030 ($ million)
Chart on Canada - Year-over-year growth 2025-2030 (%)
Data Table on Canada - Year-over-year growth 2025-2030 (%)

12.3.3 Mexico - Market size and forecast 2025-2030

Chart on Mexico - Market size and forecast 2025-2030 ($ million)
Data Table on Mexico - Market size and forecast 2025-2030 ($ million)
Chart on Mexico - Year-over-year growth 2025-2030 (%)
Data Table on Mexico - Year-over-year growth 2025-2030 (%)

12.4 APAC - Market size and forecast 2025-2030

Chart on APAC - Market size and forecast 2025-2030 ($ million)
Data Table on APAC - Market size and forecast 2025-2030 ($ million)
Chart on APAC - Year-over-year growth 2025-2030 (%)
Data Table on APAC - Year-over-year growth 2025-2030 (%)
Chart on Regional Comparison - APAC
Data Table on Regional Comparison - APAC

12.4.1 China - Market size and forecast 2025-2030

Chart on China - Market size and forecast 2025-2030 ($ million)
Data Table on China - Market size and forecast 2025-2030 ($ million)
Chart on China - Year-over-year growth 2025-2030 (%)
Data Table on China - Year-over-year growth 2025-2030 (%)

12.4.2 India - Market size and forecast 2025-2030

Chart on India - Market size and forecast 2025-2030 ($ million)
Data Table on India - Market size and forecast 2025-2030 ($ million)
Chart on India - Year-over-year growth 2025-2030 (%)
Data Table on India - Year-over-year growth 2025-2030 (%)

12.4.3 Japan - Market size and forecast 2025-2030

Chart on Japan - Market size and forecast 2025-2030 ($ million)
Data Table on Japan - Market size and forecast 2025-2030 ($ million)
Chart on Japan - Year-over-year growth 2025-2030 (%)
Data Table on Japan - Year-over-year growth 2025-2030 (%)

12.4.4 South Korea - Market size and forecast 2025-2030

Chart on South Korea - Market size and forecast 2025-2030 ($ million)
Data Table on South Korea - Market size and forecast 2025-2030 ($ million)
Chart on South Korea - Year-over-year growth 2025-2030 (%)
Data Table on South Korea - Year-over-year growth 2025-2030 (%)

12.4.5 Australia - Market size and forecast 2025-2030

Chart on Australia - Market size and forecast 2025-2030 ($ million)
Data Table on Australia - Market size and forecast 2025-2030 ($ million)
Chart on Australia - Year-over-year growth 2025-2030 (%)
Data Table on Australia - Year-over-year growth 2025-2030 (%)

12.4.6 Indonesia - Market size and forecast 2025-2030

Chart on Indonesia - Market size and forecast 2025-2030 ($ million)
Data Table on Indonesia - Market size and forecast 2025-2030 ($ million)
Chart on Indonesia - Year-over-year growth 2025-2030 (%)
Data Table on Indonesia - Year-over-year growth 2025-2030 (%)

12.5 Europe - Market size and forecast 2025-2030

Chart on Europe - Market size and forecast 2025-2030 ($ million)
Data Table on Europe - Market size and forecast 2025-2030 ($ million)
Chart on Europe - Year-over-year growth 2025-2030 (%)
Data Table on Europe - Year-over-year growth 2025-2030 (%)
Chart on Regional Comparison - Europe
Data Table on Regional Comparison - Europe

12.5.1 Germany - Market size and forecast 2025-2030

Chart on Germany - Market size and forecast 2025-2030 ($ million)
Data Table on Germany - Market size and forecast 2025-2030 ($ million)
Chart on Germany - Year-over-year growth 2025-2030 (%)
Data Table on Germany - Year-over-year growth 2025-2030 (%)

12.5.2 UK - Market size and forecast 2025-2030

Chart on UK - Market size and forecast 2025-2030 ($ million)
Data Table on UK - Market size and forecast 2025-2030 ($ million)
Chart on UK - Year-over-year growth 2025-2030 (%)
Data Table on UK - Year-over-year growth 2025-2030 (%)

12.5.3 France - Market size and forecast 2025-2030

Chart on France - Market size and forecast 2025-2030 ($ million)
Data Table on France - Market size and forecast 2025-2030 ($ million)
Chart on France - Year-over-year growth 2025-2030 (%)
Data Table on France - Year-over-year growth 2025-2030 (%)

12.5.4 Italy - Market size and forecast 2025-2030

Chart on Italy - Market size and forecast 2025-2030 ($ million)
Data Table on Italy - Market size and forecast 2025-2030 ($ million)
Chart on Italy - Year-over-year growth 2025-2030 (%)
Data Table on Italy - Year-over-year growth 2025-2030 (%)

12.5.5 The Netherlands - Market size and forecast 2025-2030

Chart on The Netherlands - Market size and forecast 2025-2030 ($ million)
Data Table on The Netherlands - Market size and forecast 2025-2030 ($ million)
Chart on The Netherlands - Year-over-year growth 2025-2030 (%)
Data Table on The Netherlands - Year-over-year growth 2025-2030 (%)

12.5.6 Spain - Market size and forecast 2025-2030

Chart on Spain - Market size and forecast 2025-2030 ($ million)
Data Table on Spain - Market size and forecast 2025-2030 ($ million)
Chart on Spain - Year-over-year growth 2025-2030 (%)
Data Table on Spain - Year-over-year growth 2025-2030 (%)

12.6 Middle East and Africa - Market size and forecast 2025-2030

Chart on Middle East and Africa - Market size and forecast 2025-2030 ($ million)
Data Table on Middle East and Africa - Market size and forecast 2025-2030 ($ million)
Chart on Middle East and Africa - Year-over-year growth 2025-2030 (%)
Data Table on Middle East and Africa - Year-over-year growth 2025-2030 (%)
Chart on Regional Comparison - Middle East and Africa
Data Table on Regional Comparison - Middle East and Africa

12.6.1 Saudi Arabia - Market size and forecast 2025-2030

Chart on Saudi Arabia - Market size and forecast 2025-2030 ($ million)
Data Table on Saudi Arabia - Market size and forecast 2025-2030 ($ million)
Chart on Saudi Arabia - Year-over-year growth 2025-2030 (%)
Data Table on Saudi Arabia - Year-over-year growth 2025-2030 (%)

12.6.2 UAE - Market size and forecast 2025-2030

Chart on UAE - Market size and forecast 2025-2030 ($ million)
Data Table on UAE - Market size and forecast 2025-2030 ($ million)
Chart on UAE - Year-over-year growth 2025-2030 (%)
Data Table on UAE - Year-over-year growth 2025-2030 (%)

12.6.3 South Africa - Market size and forecast 2025-2030

Chart on South Africa - Market size and forecast 2025-2030 ($ million)
Data Table on South Africa - Market size and forecast 2025-2030 ($ million)
Chart on South Africa - Year-over-year growth 2025-2030 (%)
Data Table on South Africa - Year-over-year growth 2025-2030 (%)

12.6.4 Israel - Market size and forecast 2025-2030

Chart on Israel - Market size and forecast 2025-2030 ($ million)
Data Table on Israel - Market size and forecast 2025-2030 ($ million)
Chart on Israel - Year-over-year growth 2025-2030 (%)
Data Table on Israel - Year-over-year growth 2025-2030 (%)

12.6.5 Turkey - Market size and forecast 2025-2030

Chart on Turkey - Market size and forecast 2025-2030 ($ million)
Data Table on Turkey - Market size and forecast 2025-2030 ($ million)
Chart on Turkey - Year-over-year growth 2025-2030 (%)
Data Table on Turkey - Year-over-year growth 2025-2030 (%)

12.7 South America - Market size and forecast 2025-2030

Chart on South America - Market size and forecast 2025-2030 ($ million)
Data Table on South America - Market size and forecast 2025-2030 ($ million)
Chart on South America - Year-over-year growth 2025-2030 (%)
Data Table on South America - Year-over-year growth 2025-2030 (%)
Chart on Regional Comparison - South America
Data Table on Regional Comparison - South America

12.7.1 Brazil - Market size and forecast 2025-2030

Chart on Brazil - Market size and forecast 2025-2030 ($ million)
Data Table on Brazil - Market size and forecast 2025-2030 ($ million)
Chart on Brazil - Year-over-year growth 2025-2030 (%)
Data Table on Brazil - Year-over-year growth 2025-2030 (%)

12.7.2 Argentina - Market size and forecast 2025-2030

Chart on Argentina - Market size and forecast 2025-2030 ($ million)
Data Table on Argentina - Market size and forecast 2025-2030 ($ million)
Chart on Argentina - Year-over-year growth 2025-2030 (%)
Data Table on Argentina - Year-over-year growth 2025-2030 (%)

12.7.3 Colombia - Market size and forecast 2025-2030

Chart on Colombia - Market size and forecast 2025-2030 ($ million)
Data Table on Colombia - Market size and forecast 2025-2030 ($ million)
Chart on Colombia - Year-over-year growth 2025-2030 (%)
Data Table on Colombia - Year-over-year growth 2025-2030 (%)

12.8 Market opportunity by geography

Market opportunity by geography ($ million)
Data Tables on Market opportunity by geography ($ million)

13. Drivers, Challenges, and Opportunity

13.1 Market drivers

Rapid urbanization and evolution of personal living spaces.
Heightened consumer prioritization of sustainability and ethical manufacturing
Digital transformation and proliferation of social media influence

13.2 Market challenges

Geopolitical volatility and fragility of global supply chains
Stringent environmental regulations and burden of sustainability compliance
Market fragmentation and proliferation of intellectual property infringement

13.3 Impact of drivers and challenges

Impact of drivers and challenges in 2025 and 2030

13.4 Market opportunities

Integration of biophilic principles and natural aesthetics
Advancements in digital customization and smart ornamentation
Resurgence of maximalism and culturally rich artisanal craft

14. Competitive Landscape

14.1 Overview

14.2

Overview on criticality of inputs and factors of differentiation

14.3 Landscape disruption

Overview on factors of disruption

14.4 Industry risks

Impact of key risks on business

15. Competitive Analysis

15.1 Companies profiled

Companies covered

15.2 Company ranking index

15.3 Market positioning of companies

Matrix on companies position and classification

15.4 Amazon.com Inc.

Amazon.com Inc. - Overview
Amazon.com Inc. - Business segments
Amazon.com Inc. - Key news
Amazon.com Inc. - Key offerings
Amazon.com Inc. - Segment focus
SWOT

15.5 Ashley Furniture Industries

Ashley Furniture Industries - Overview
Ashley Furniture Industries - Product / Service
Ashley Furniture Industries - Key offerings
SWOT

15.6 Crate and Barrel

Crate and Barrel - Overview
Crate and Barrel - Product / Service
Crate and Barrel - Key offerings
SWOT

15.7 Ethan Allen Interiors Inc.

Ethan Allen Interiors Inc. - Overview
Ethan Allen Interiors Inc. - Business segments
Ethan Allen Interiors Inc. - Key news
Ethan Allen Interiors Inc. - Key offerings
Ethan Allen Interiors Inc. - Segment focus
SWOT

15.8 Georg Jensen AS

Georg Jensen AS - Overview
Georg Jensen AS - Product / Service
Georg Jensen AS - Key offerings
SWOT

15.9 H and M Hennes and Mauritz GBC

H and M Hennes and Mauritz GBC - Overview
H and M Hennes and Mauritz GBC - Business segments
H and M Hennes and Mauritz GBC - Key offerings
H and M Hennes and Mauritz GBC - Segment focus
SWOT

15.10 Inter IKEA Holding BV

Inter IKEA Holding BV - Overview
Inter IKEA Holding BV - Product / Service
Inter IKEA Holding BV - Key offerings
SWOT

15.11 LaZBoy Inc.

LaZBoy Inc. - Overview
LaZBoy Inc. - Business segments
LaZBoy Inc. - Key offerings
LaZBoy Inc. - Segment focus
SWOT

15.12 Maisons du Monde

Maisons du Monde - Overview
Maisons du Monde - Product / Service
Maisons du Monde - Key offerings
SWOT

15.13 MillerKnoll Inc.

MillerKnoll Inc. - Overview
MillerKnoll Inc. - Business segments
MillerKnoll Inc. - Key offerings
MillerKnoll Inc. - Segment focus
SWOT

15.14 Pier 1 Imports Online Inc.

Pier 1 Imports Online Inc. - Overview
Pier 1 Imports Online Inc. - Product / Service
Pier 1 Imports Online Inc. - Key offerings
SWOT

15.15 Restoration Hardware Inc.

Restoration Hardware Inc. - Overview
Restoration Hardware Inc. - Product / Service
Restoration Hardware Inc. - Key offerings
SWOT

15.16 Swarovski AG

Swarovski AG - Overview
Swarovski AG - Product / Service
Swarovski AG - Key offerings
SWOT

15.17 Target Corp.

Target Corp. - Overview
Target Corp. - Product / Service
Target Corp. - Key offerings
SWOT

15.18 Urban Outfitters Inc.

Urban Outfitters Inc. - Overview
Urban Outfitters Inc. - Business segments
Urban Outfitters Inc. - Key offerings
Urban Outfitters Inc. - Segment focus
SWOT

16. Appendix

16.1 Scope of the report

Market definition
Objectives
Notes and caveats

16.2 Inclusions and exclusions checklist

Inclusions checklist
Exclusions checklist

16.3 Currency conversion rates for US$

16.4 Research methodology

16.5 Data procurement

Information sources

16.6 Data validation

16.7 Validation techniques employed for market sizing

16.8 Data synthesis

16.9 360 degree market analysis

16.10 List of abbreviations

Research Methodology

Technavio presents a detailed picture of the market by way of study, synthesis, and summation of data from multiple sources. The analysts have presented the various facets of the market with a particular focus on identifying the key industry influencers. The data thus presented is comprehensive, reliable, and the result of extensive research, both primary and secondary.

INFORMATION SOURCES

Primary sources

  • Manufacturers and suppliers
  • Channel partners
  • Industry experts
  • Strategic decision makers

Secondary sources

  • Industry journals and periodicals
  • Government data
  • Financial reports of key industry players
  • Historical data
  • Press releases

DATA ANALYSIS

Data Synthesis

  • Collation of data
  • Estimation of key figures
  • Analysis of derived insights

Data Validation

  • Triangulation with data models
  • Reference against proprietary databases
  • Corroboration with industry experts

REPORT WRITING

Qualitative

  • Market drivers
  • Market challenges
  • Market trends
  • Five forces analysis

Quantitative

  • Market size and forecast
  • Market segmentation
  • Geographical insights
  • Competitive landscape

Interested in this report?

Get your sample now to see our research methodology and insights!

Download Now

Frequently Asked Questions

Decorative Accessories market growth will increase by USD 40592.7 million during 2026-2030.

The Decorative Accessories market is expected to grow at a CAGR of 5.8% during 2026-2030.

Decorative Accessories market is segmented by Product type (Lamp and lighting accessories, Pottery and vases, Pillows and cushions, Rugs and carpets, Others) Material (Metal, Glass and ceramic, Wood, Textile, Others) Distribution channel (Offline, Online)

Amazon.com Inc., Ashley Furniture Industries, Crate and Barrel, Ethan Allen Interiors Inc., Georg Jensen AS, H and M Hennes and Mauritz GBC, Inter IKEA Holding BV, LaZBoy Inc., Maisons du Monde, MillerKnoll Inc., Pier 1 Imports Online Inc., Restoration Hardware Inc., Swarovski AG, Target Corp., Urban Outfitters Inc., Villeroy and Boch AG, Walmart Inc., Wayfair Inc., Wedgwood, Williams Sonoma Inc. are a few of the key vendors in the Decorative Accessories market.

APAC will register the highest growth rate of 34.8% among the other regions. Therefore, the Decorative Accessories market in APAC is expected to garner significant business opportunities for the vendors during the forecast period.

US, Canada, Mexico, China, India, Japan, South Korea, Australia, Indonesia, Germany, UK, France, Italy, The Netherlands, Spain, Saudi Arabia, UAE, South Africa, Israel, Turkey, Brazil, Argentina, Colombia

  • Rapid urbanization and evolution of personal living spaces. is the driving factor this market.

The Decorative Accessories market vendors should focus on grabbing business opportunities from the Product type segment as it accounted for the largest market share in the base year.
RIA - Research AI Assistant
Ask RIA