Cylindrical Cells Market Analysis, Size, and Forecast 2026-2030: APAC (China, Japan, and South Korea), North America (US, Canada, and Mexico), Europe (Germany, France, and UK), Middle East and Africa (Saudi Arabia, South Africa, and UAE), South America (Brazil and Argentina), and Rest of World (ROW)

Cylindrical Cells Market Analysis, Size, and Forecast 2026-2030:
APAC (China, Japan, and South Korea), North America (US, Canada, and Mexico), Europe (Germany, France, and UK), Middle East and Africa (Saudi Arabia, South Africa, and UAE), South America (Brazil and Argentina), and Rest of World (ROW)

Published: May 2026 311 Pages SKU: IRTNTR81457

Market Overview at a Glance

$7.76 B
Market Opportunity
7.4%
CAGR 2025 - 2030
53.7%
APAC Growth
$7.47 B
NMC segment 2024

Cylindrical Cells Market Size 2026-2030

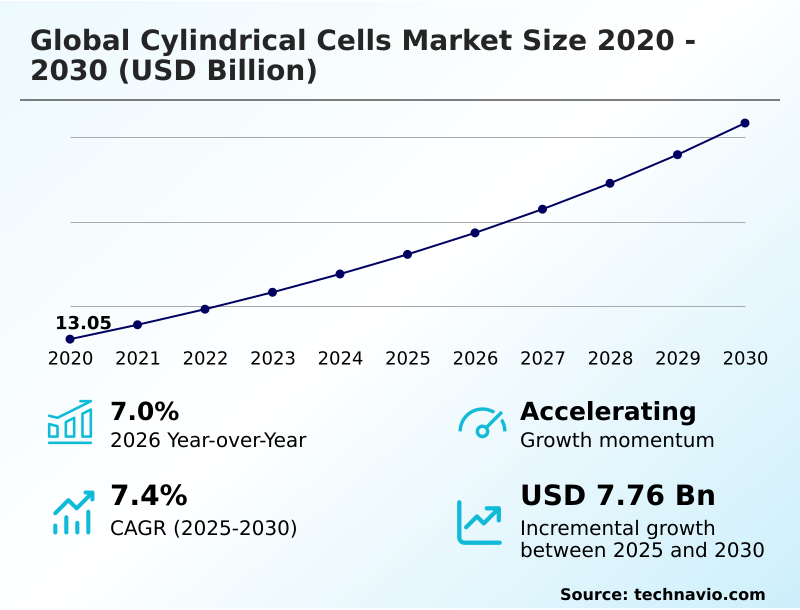
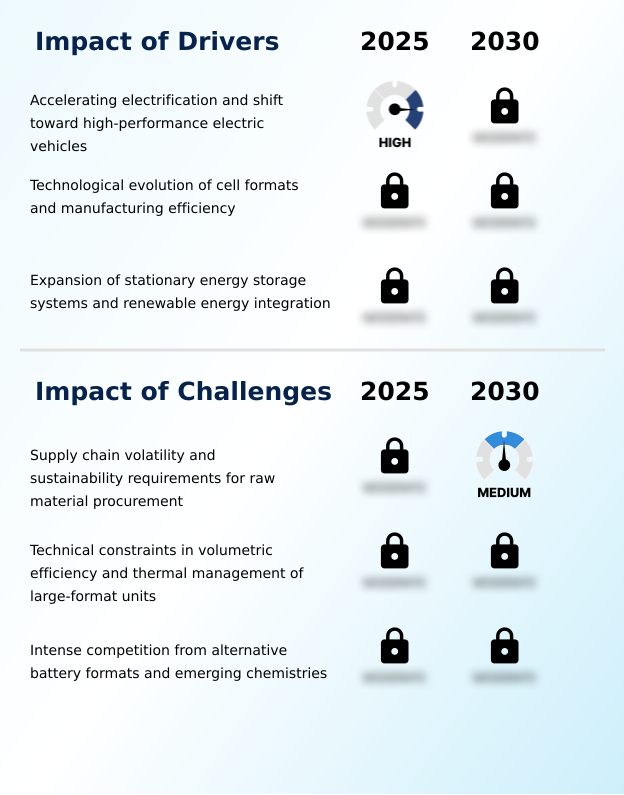
The cylindrical cells market size is valued to increase by USD 7.76 billion, at a CAGR of 7.4% from 2025 to 2030. Accelerating electrification and shift toward high-performance electric vehicles will drive the cylindrical cells market.

Major Market Trends & Insights

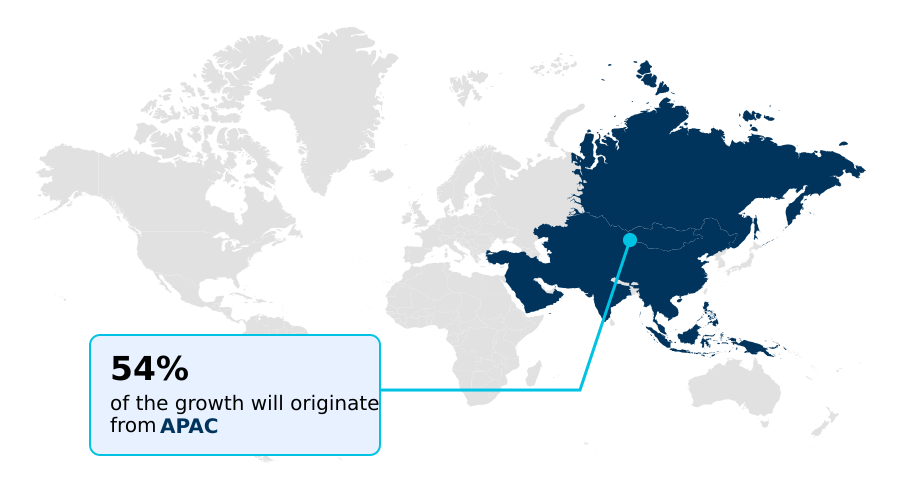
  • APAC dominated the market and accounted for a 53.7% growth during the forecast period.
  • By Type - NMC segment was valued at USD 7.47 billion in 2024
  • By Application - Automotive segment accounted for the largest market revenue share in 2024

Market Size & Forecast

  • Market Opportunities: USD 12.77 billion
  • Market Future Opportunities: USD 7.76 billion
  • CAGR from 2025 to 2030 : 7.4%

Market Summary

  • The cylindrical cells market is defined by the production of electrochemical energy storage units with a distinct rigid, tubular geometry. These units are central to advancing high-performance power solutions across key industries, including electric mobility and renewable energy integration.
  • Market dynamics are shaped by a strong push toward technological evolution, such as the development of high-nickel cathodes and silicon-carbon composite materials to boost specific energy. The industry is also driven by manufacturing efficiencies achieved through innovations like dry electrode coating and high-speed continuous motion assembly, which are critical for achieving high-volume scalability.
  • As an example of operational improvement, one manufacturing scenario involves optimizing the jelly roll configuration within a new cell design to enhance thermal stability, which can extend the operational life of a battery pack in high-demand applications like heavy-duty transport.
  • However, the market grapples with challenges from competing formats like prismatic cells and the technical complexities of thermal management in larger cell formats, which require sophisticated battery management systems.

What will be the Size of the Cylindrical Cells Market during the forecast period?

Get Key Insights on Market Forecast (PDF) Get Free Sample

How is the Cylindrical Cells Market Segmented?

The cylindrical cells industry research report provides comprehensive data (region-wise segment analysis), with forecasts and estimates in "USD million" for the period 2026-2030, as well as historical data from 2020-2024 for the following segments.

  • Type
    • NMC
    • LFP
    • LCO
    • Others
  • Application
    • Automotive
    • Consumer electronics
    • Industrial equipment
    • Energy storage systems
    • Others
  • Product
    • 18650 format
    • 21700 and 2170 format
    • 46xx series
    • Others
  • Geography
    • APAC
      • China
      • Japan
      • South Korea
    • North America
      • US
      • Canada
      • Mexico
    • Europe
      • Germany
      • France
      • UK
    • Middle East and Africa
      • Saudi Arabia
      • South Africa
      • UAE
    • South America
      • Brazil
      • Argentina
    • Rest of World (ROW)

By Type Insights

The nmc segment is estimated to witness significant growth during the forecast period.

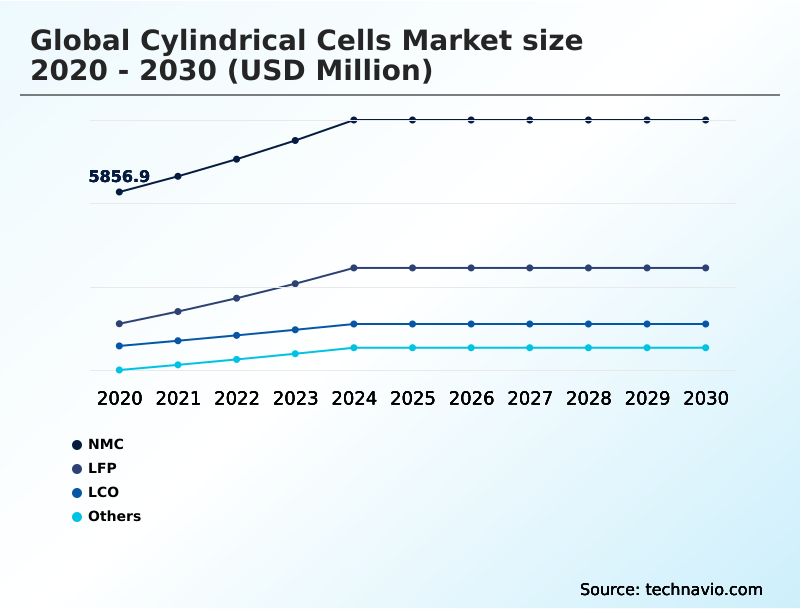
The global cylindrical cells market 2026-2030 is segmented by type, application, and geography. Key chemistries such as NMC chemistry and LFP chemistry dominate different application segments.

The NMC segment, featuring high-nickel cathodes, is crucial for high-performance electric mobility, where high volumetric energy density is paramount. This chemistry involves a precise formulation of the anode, cathode, and separator.

Conversely, LFP chemistry is favored in stationary energy storage and certain industrial equipment due to its lower cost and enhanced safety profile.

Applications range from consumer electronics to large-scale grid systems, each demanding specific performance characteristics like high power output and structural integrity, with recent advancements in cell-to-pack integration improving overall system efficiency by 15%.

Get Free Sample

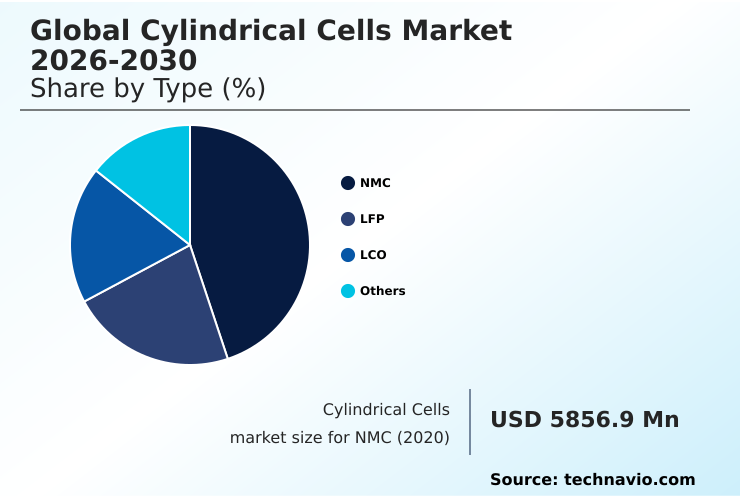
The NMC segment was valued at USD 7.47 billion in 2024 and showed a gradual increase during the forecast period.

Get Free Sample

Regional Analysis

APAC is estimated to contribute 53.7% to the growth of the global market during the forecast period.Technavio’s analysts have elaborately explained the regional trends and drivers that shape the market during the forecast period.

See How Cylindrical Cells Market Demand is Rising in APAC Get Free Sample

The APAC region, contributing over 53% of the incremental growth, leads the global cylindrical cells market 2026-2030, driven by its dominance in manufacturing and consumption.

North America is accelerating its onshoring efforts, establishing new gigafactories to secure supply chains for the automotive sector and for stationary energy storage. Europe is enforcing stringent sustainability mandates, pushing for localized production and high recycling rates.

Chemistries like LCO chemistry and NCA chemistry remain relevant in specialized sectors such as medical devices and emergency lighting. The 18650 format continues to be a workhorse in various applications.

Regions with unique demands, like heavy-duty transport, are exploring LTO chemistry for its durability and thermal stability. Meanwhile, research hubs are advancing technologies like direct lithium extraction and sulfidic based electrolytes, which could reshape regional resource dependencies.

Market Dynamics

Our researchers analyzed the data with 2025 as the base year, along with the key drivers, trends, and challenges. A holistic analysis of drivers will help companies refine their marketing strategies to gain a competitive advantage.

  • A comprehensive understanding of the global cylindrical cells market 2026-2030 requires analyzing several interconnected factors. The debate over cylindrical vs prismatic cell efficiency continues, with each format offering distinct advantages in packaging and thermal performance. The 4680 cell manufacturing process, particularly the implementation of dry electrode coating production costs, is a key area of focus for achieving cost-per-kWh targets.
  • Concurrently, mitigating silicon anode battery degradation is critical for next-generation, high-energy-density cells. Improving thermal management in battery packs remains a central engineering challenge, directly influencing safety and longevity. From an economic perspective, the NMC vs LFP cost performance trade-off guides procurement strategies for different vehicle segments.
  • The technical advantages of tabless electrode benefits for EVs are clear, but scaling production presents hurdles. On the sustainability front, battery recycling and circular economy initiatives are gaining traction, supported by digital battery passport implementation. Sourcing sustainable cobalt for batteries continues to be a major ESG concern.
  • Looking forward, solid-state battery commercialization challenges and the quest to improve sodium-ion battery energy density will define the long-term competitive landscape. Strategic decisions now revolve around balancing energy density and cycle life, optimizing BMS for cell longevity, and addressing challenges in scaling up gigafactories to meet soaring demand.

What are the key market drivers leading to the rise in the adoption of Cylindrical Cells Industry?

  • The accelerating pace of electrification, coupled with a decisive shift toward high-performance electric vehicles, serves as the primary driver for market expansion.

  • The automotive sector's expansion is a major market driver, with formats like the 2170 format becoming standard for their balance of specific energy and mechanical stability.
  • Innovations in high-speed continuous motion assembly have reduced production costs by up to 25%, accelerating adoption in both passenger and light electric vehicles. The push for cobalt-free chemistry is also gaining momentum, addressing supply chain and ethical concerns.
  • Advanced cell-to-chassis design concepts are further enhancing vehicle performance. Beyond vehicles, these cells are vital for professional power tools and systems supporting electric vehicle charging and grid stabilization.
  • The efficiency of the thermal management system and the potential for automated disassembly at end-of-life are also key factors propelling market growth.

What are the market trends shaping the Cylindrical Cells Industry?

  • The adoption of large-format cylindrical designs and tabless electrode technology represents a key emerging trend. This shift is reshaping battery pack architecture and performance expectations.

  • A primary trend is the industry's shift toward larger designs like the 4680 format, which, combined with tabless electrode design principles, is enhancing electrochemical energy storage. This evolution in the jelly roll configuration enables better thermal performance and fast-charging capability, critical for high-performance electric vehicles.
  • Innovations such as dry electrode coating are improving high-volume scalability, with some pilot lines demonstrating a 20% reduction in manufacturing energy consumption. Furthermore, the adoption of a digital battery passport is set to transform lifecycle management, supporting the circular economy and expanding use cases into demanding sectors like aerospace applications.
  • This convergence of cell-to-pack technology and manufacturing innovation is paving the way for more efficient and sustainable battery systems that support renewable energy integration and deliver a longer cycle life.

What challenges does the Cylindrical Cells Industry face during its growth?

  • Significant industry growth is constrained by supply chain volatility and the rigorous sustainability requirements associated with raw material procurement.

  • Intense competition from alternative formats like prismatic cells and pouch cells presents a significant challenge, as they offer different advantages in space utilization for applications like warehouse automation. The long-term viability is also tested by emerging technologies such as solid-state batteries and sodium-ion batteries, which promise superior safety and a better power-to-weight ratio.
  • Within cylindrical cells, managing the thermal gradient during high discharge rates remains a technical hurdle, requiring sophisticated battery management systems and current interrupt devices to ensure safety. This is especially true for residential backup power and telecommunications backup systems.
  • Failure to innovate could see market share shift, with some OEMs reporting a 10% efficiency gain by adopting alternative cell architectures for material handling systems.

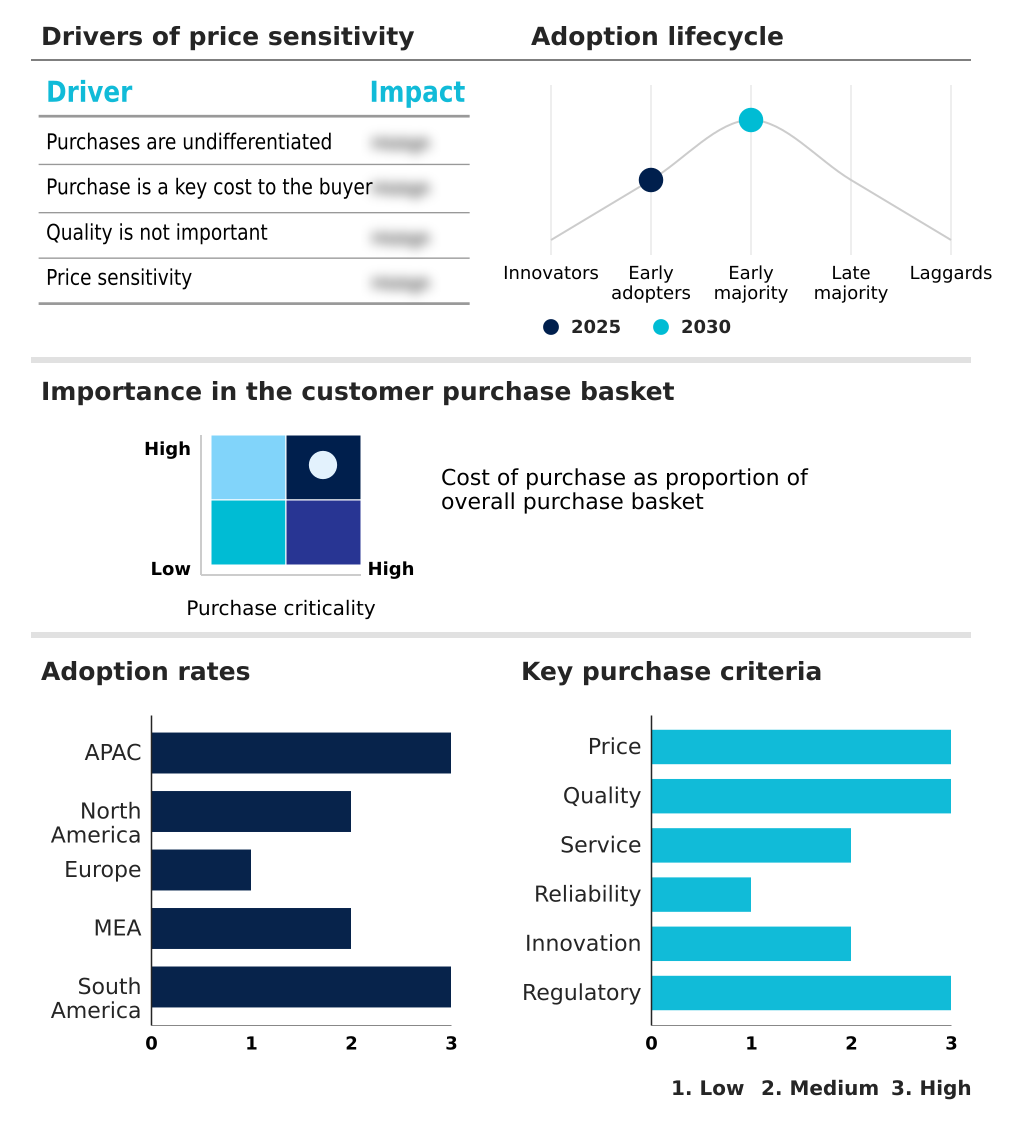
Exclusive Technavio Analysis on Customer Landscape

The cylindrical cells market forecasting report includes the adoption lifecycle of the market, covering from the innovator’s stage to the laggard’s stage. It focuses on adoption rates in different regions based on penetration. Furthermore, the cylindrical cells market report also includes key purchase criteria and drivers of price sensitivity to help companies evaluate and develop their market growth analysis strategies.

Customer Landscape of Cylindrical Cells Industry

Competitive Landscape

Companies are implementing various strategies, such as strategic alliances, cylindrical cells market forecast, partnerships, mergers and acquisitions, geographical expansion, and product/service launches, to enhance their presence in the industry.

Contemporary Amperex Ltd. - Offers advanced cylindrical lithium-ion cells and EV battery solutions for the automotive and energy storage sectors.

The industry research and growth report includes detailed analyses of the competitive landscape of the market and information about key companies, including:

  • Contemporary Amperex Ltd.
  • E One Moli Energy Corp.
  • Envision Energy USA Ltd.
  • EVE Energy Co. Ltd.
  • FDK Corp.
  • Gotion Inc.
  • GP Batteries International Ltd.
  • Jiangsu Highstar Battery Co.
  • LG Energy Solution Ltd.
  • Murata Manufacturing Co. Ltd.
  • Northvolt AB
  • Panasonic Holdings Corp.
  • Saft Groupe SAS
  • Samsung SDI Co. Ltd.
  • Shenzhen BAK Battery Co. Ltd.
  • Sunwoda Electronic Co. Ltd.
  • SVOLT Energy Technology Co. Ltd.
  • Tesla Inc.
  • TianJin Lishen Battery Ltd.
  • VARTA AG

Qualitative and quantitative analysis of companies has been conducted to help clients understand the wider business environment as well as the strengths and weaknesses of key industry players. Data is qualitatively analyzed to categorize companies as pure play, category-focused, industry-focused, and diversified; it is quantitatively analyzed to categorize companies as dominant, leading, strong, tentative, and weak.

Recent Development and News in Cylindrical cells market

  • In February 2025, a prominent South Korean battery manufacturer finalized an agreement with a major American automotive group to establish a dedicated assembly line for 2170-format cylindrical cells in the state of Michigan.
  • In March 2025, a major mining enterprise in Australia suspended the development of a high-grade lithium extraction site due to an administrative delay in environmental permits.
  • In May 2025, a chemical research organization in Germany announced a breakthrough in the stabilization of silicon-carbon composite materials, allowing for a twenty percent increase in energy density.
  • In June 2025, a thermal management engineering group in Germany disclosed that the thermal gradient within large-format cylindrical cells remained a significant hurdle for high-output power trains.

Dive into Technavio’s robust research methodology, blending expert interviews, extensive data synthesis, and validated models for unparalleled Cylindrical Cells Market insights. See full methodology.

Market Scope
Page number 311
Base year 2025
Historic period 2020-2024
Forecast period 2026-2030
Growth momentum & CAGR Accelerate at a CAGR of 7.4%
Market growth 2026-2030 USD 7760.0 million
Market structure Fragmented
YoY growth 2025-2026(%) 7.0%
Key countries China, Japan, South Korea, India, Australia, Indonesia, US, Canada, Mexico, Germany, France, UK, Italy, Spain, The Netherlands, Saudi Arabia, South Africa, UAE, Israel, Turkey, Brazil, Argentina and Chile
Competitive landscape Leading Companies, Market Positioning of Companies, Competitive Strategies, and Industry Risks

Request Free Sample

Research Analyst Overview

  • The cylindrical cells market is characterized by rapid technological progression and strategic manufacturing investments. The transition toward larger formats, such as the 4680 format, and the adoption of advanced manufacturing methods like high-speed continuous motion assembly, are pivotal. Innovations like tabless electrode design are fundamentally altering cell architecture to improve performance.
  • For boardroom consideration, the implementation of a digital battery passport is becoming a critical compliance issue, impacting supply chain transparency and alignment with circular economy goals. A key development is the use of silicon-carbon composite materials, which has been shown to increase specific energy by up to 20% in some applications.
  • This pursuit of higher volumetric energy density is balanced by the need for robust thermal management systems. The ongoing development of solid-state batteries and sodium-ion batteries presents a long-term competitive dynamic, pushing incumbents to innovate in areas like cell-to-chassis design and automated disassembly to maintain market leadership in electrochemical energy storage.

What are the Key Data Covered in this Cylindrical Cells Market Research and Growth Report?

  • What is the expected growth of the Cylindrical Cells Market between 2026 and 2030?

    • USD 7.76 billion, at a CAGR of 7.4%

  • What segmentation does the market report cover?

    • The report is segmented by Type (NMC, LFP, LCO, and Others), Application (Automotive, Consumer electronics, Industrial equipment, Energy storage systems, and Others), Product (18650 format, 21700 and 2170 format, 46xx series, and Others) and Geography (APAC, North America, Europe, Middle East and Africa, South America)

  • Which regions are analyzed in the report?

    • APAC, North America, Europe, Middle East and Africa and South America

  • What are the key growth drivers and market challenges?

    • Accelerating electrification and shift toward high-performance electric vehicles, Supply chain volatility and sustainability requirements for raw material procurement

  • Who are the major players in the Cylindrical Cells Market?

    • Contemporary Amperex Ltd., E One Moli Energy Corp., Envision Energy USA Ltd., EVE Energy Co. Ltd., FDK Corp., Gotion Inc., GP Batteries International Ltd., Jiangsu Highstar Battery Co., LG Energy Solution Ltd., Murata Manufacturing Co. Ltd., Northvolt AB, Panasonic Holdings Corp., Saft Groupe SAS, Samsung SDI Co. Ltd., Shenzhen BAK Battery Co. Ltd., Sunwoda Electronic Co. Ltd., SVOLT Energy Technology Co. Ltd., Tesla Inc., TianJin Lishen Battery Ltd. and VARTA AG

Market Research Insights

  • Market dynamics are influenced by the diverse needs of end-use applications, from high-performance electric vehicles to stationary energy storage. The emphasis on long cycle life and fast-charging capability drives continuous innovation. For instance, the adoption of advanced materials has led to a 15% improvement in power-to-weight ratio in cells designed for aerospace applications, while maintaining structural integrity.
  • In the automotive sector, securing a stable supply of high-quality cells is paramount, with some large buyers achieving a 10% cost reduction through long-term strategic sourcing agreements. The shift toward renewable energy integration also fuels demand for systems with exceptional thermal stability to ensure grid reliability.
  • This requires a focus on high power output and mechanical stability, which are hallmarks of the cylindrical format, ensuring its relevance across a diversifying market landscape.

We can help! Our analysts can customize this cylindrical cells market research report to meet your requirements.

Get in touch

1. Executive Summary

1.1 Market overview

Executive Summary - Chart on Market Overview
Executive Summary - Data Table on Market Overview
Executive Summary - Chart on Global Market Characteristics
Executive Summary - Chart on Market by Geography
Executive Summary - Chart on Market Segmentation by Type
Executive Summary - Chart on Market Segmentation by Application
Executive Summary - Chart on Market Segmentation by Product
Executive Summary - Chart on Incremental Growth
Executive Summary - Data Table on Incremental Growth
Executive Summary - Chart on Company Market Positioning

2. Technavio Analysis

2.1 Analysis of price sensitivity, lifecycle, customer purchase basket, adoption rates, and purchase criteria

2.2 Criticality of inputs and Factors of differentiation

Chart on Overview on criticality of inputs and factors of differentiation

2.3 Factors of disruption

Chart on Overview on factors of disruption

2.4 Impact of drivers and challenges

Chart on Impact of drivers and challenges in 2025 and 2030

3. Market Landscape

3.1 Market ecosystem

Chart on Parent Market
Data Table on - Parent Market

3.2 Market characteristics

Chart on Market characteristics analysis

3.3 Value chain analysis

Chart on Value chain analysis

4. Market Sizing

4.1 Market definition

Data Table on Offerings of companies included in the market definition

4.2 Market segment analysis

Market segments

4.3 Market size 2025

4.4 Market outlook: Forecast for 2025-2030

Chart on Global - Market size and forecast 2025-2030 ($ million)
Data Table on Global - Market size and forecast 2025-2030 ($ million)
Chart on Global Market: Year-over-year growth 2025-2030 (%)
Data Table on Global Market: Year-over-year growth 2025-2030 (%)

5. Historic Market Size

5.1 Global Cylindrical Cells Market 2020 - 2024

Historic Market Size - Data Table on Global Cylindrical Cells Market 2020 - 2024 ($ million)

5.2 Type segment analysis 2020 - 2024

Historic Market Size - Type Segment 2020 - 2024 ($ million)

5.3 Application segment analysis 2020 - 2024

Historic Market Size - Application Segment 2020 - 2024 ($ million)

5.4 Product segment analysis 2020 - 2024

Historic Market Size - Product Segment 2020 - 2024 ($ million)

5.5 Geography segment analysis 2020 - 2024

Historic Market Size - Geography Segment 2020 - 2024 ($ million)

5.6 Country segment analysis 2020 - 2024

Historic Market Size - Country Segment 2020 - 2024 ($ million)

6. Qualitative Analysis

6.1 Impact of AI on Global Cylindrical Cells Market

6.2 Impact of geopolitical conflicts on Global Cylindrical Cells Market

7. Five Forces Analysis

7.1 Five forces summary

Five forces analysis - Comparison between 2025 and 2030

7.2 Bargaining power of buyers

Bargaining power of buyers - Impact of key factors 2025 and 2030

7.3 Bargaining power of suppliers

Bargaining power of suppliers - Impact of key factors in 2025 and 2030

7.4 Threat of new entrants

Threat of new entrants - Impact of key factors in 2025 and 2030

7.5 Threat of substitutes

Threat of substitutes - Impact of key factors in 2025 and 2030

7.6 Threat of rivalry

Threat of rivalry - Impact of key factors in 2025 and 2030

7.7 Market condition

Chart on Market condition - Five forces 2025 and 2030

8. Market Segmentation by Type

8.1 Market segments

Chart on Type - Market share 2025-2030 (%)
Data Table on Type - Market share 2025-2030 (%)

8.2 Comparison by Type

Chart on Comparison by Type
Data Table on Comparison by Type

8.3 NMC - Market size and forecast 2025-2030

Chart on NMC - Market size and forecast 2025-2030 ($ million)
Data Table on NMC - Market size and forecast 2025-2030 ($ million)
Chart on NMC - Year-over-year growth 2025-2030 (%)
Data Table on NMC - Year-over-year growth 2025-2030 (%)

8.4 LFP - Market size and forecast 2025-2030

Chart on LFP - Market size and forecast 2025-2030 ($ million)
Data Table on LFP - Market size and forecast 2025-2030 ($ million)
Chart on LFP - Year-over-year growth 2025-2030 (%)
Data Table on LFP - Year-over-year growth 2025-2030 (%)

8.5 LCO - Market size and forecast 2025-2030

Chart on LCO - Market size and forecast 2025-2030 ($ million)
Data Table on LCO - Market size and forecast 2025-2030 ($ million)
Chart on LCO - Year-over-year growth 2025-2030 (%)
Data Table on LCO - Year-over-year growth 2025-2030 (%)

8.6 Others - Market size and forecast 2025-2030

Chart on Others - Market size and forecast 2025-2030 ($ million)
Data Table on Others - Market size and forecast 2025-2030 ($ million)
Chart on Others - Year-over-year growth 2025-2030 (%)
Data Table on Others - Year-over-year growth 2025-2030 (%)

8.7 Market opportunity by Type

Market opportunity by Type ($ million)
Data Table on Market opportunity by Type ($ million)

9. Market Segmentation by Application

9.1 Market segments

Chart on Application - Market share 2025-2030 (%)
Data Table on Application - Market share 2025-2030 (%)

9.2 Comparison by Application

Chart on Comparison by Application
Data Table on Comparison by Application

9.3 Automotive - Market size and forecast 2025-2030

Chart on Automotive - Market size and forecast 2025-2030 ($ million)
Data Table on Automotive - Market size and forecast 2025-2030 ($ million)
Chart on Automotive - Year-over-year growth 2025-2030 (%)
Data Table on Automotive - Year-over-year growth 2025-2030 (%)

9.4 Consumer electronics - Market size and forecast 2025-2030

Chart on Consumer electronics - Market size and forecast 2025-2030 ($ million)
Data Table on Consumer electronics - Market size and forecast 2025-2030 ($ million)
Chart on Consumer electronics - Year-over-year growth 2025-2030 (%)
Data Table on Consumer electronics - Year-over-year growth 2025-2030 (%)

9.5 Industrial equipment - Market size and forecast 2025-2030

Chart on Industrial equipment - Market size and forecast 2025-2030 ($ million)
Data Table on Industrial equipment - Market size and forecast 2025-2030 ($ million)
Chart on Industrial equipment - Year-over-year growth 2025-2030 (%)
Data Table on Industrial equipment - Year-over-year growth 2025-2030 (%)

9.6 Energy storage systems - Market size and forecast 2025-2030

Chart on Energy storage systems - Market size and forecast 2025-2030 ($ million)
Data Table on Energy storage systems - Market size and forecast 2025-2030 ($ million)
Chart on Energy storage systems - Year-over-year growth 2025-2030 (%)
Data Table on Energy storage systems - Year-over-year growth 2025-2030 (%)

9.7 Others - Market size and forecast 2025-2030

Chart on Others - Market size and forecast 2025-2030 ($ million)
Data Table on Others - Market size and forecast 2025-2030 ($ million)
Chart on Others - Year-over-year growth 2025-2030 (%)
Data Table on Others - Year-over-year growth 2025-2030 (%)

9.8 Market opportunity by Application

Market opportunity by Application ($ million)
Data Table on Market opportunity by Application ($ million)

10. Market Segmentation by Product

10.1 Market segments

Chart on Product - Market share 2025-2030 (%)
Data Table on Product - Market share 2025-2030 (%)

10.2 Comparison by Product

Chart on Comparison by Product
Data Table on Comparison by Product

10.3 18650 format - Market size and forecast 2025-2030

Chart on 18650 format - Market size and forecast 2025-2030 ($ million)
Data Table on 18650 format - Market size and forecast 2025-2030 ($ million)
Chart on 18650 format - Year-over-year growth 2025-2030 (%)
Data Table on 18650 format - Year-over-year growth 2025-2030 (%)

10.4 21700 and 2170 format - Market size and forecast 2025-2030

Chart on 21700 and 2170 format - Market size and forecast 2025-2030 ($ million)
Data Table on 21700 and 2170 format - Market size and forecast 2025-2030 ($ million)
Chart on 21700 and 2170 format - Year-over-year growth 2025-2030 (%)
Data Table on 21700 and 2170 format - Year-over-year growth 2025-2030 (%)

10.5 46xx series - Market size and forecast 2025-2030

Chart on 46xx series - Market size and forecast 2025-2030 ($ million)
Data Table on 46xx series - Market size and forecast 2025-2030 ($ million)
Chart on 46xx series - Year-over-year growth 2025-2030 (%)
Data Table on 46xx series - Year-over-year growth 2025-2030 (%)

10.6 Others - Market size and forecast 2025-2030

Chart on Others - Market size and forecast 2025-2030 ($ million)
Data Table on Others - Market size and forecast 2025-2030 ($ million)
Chart on Others - Year-over-year growth 2025-2030 (%)
Data Table on Others - Year-over-year growth 2025-2030 (%)

10.7 Market opportunity by Product

Market opportunity by Product ($ million)
Data Table on Market opportunity by Product ($ million)

11. Customer Landscape

11.1 Customer landscape overview

Analysis of price sensitivity, lifecycle, customer purchase basket, adoption rates, and purchase criteria

12. Geographic Landscape

12.1 Geographic segmentation

Chart on Market share by geography 2025-2030 (%)
Data Table on Market share by geography 2025-2030 (%)

12.2 Geographic comparison

Chart on Geographic comparison
Data Table on Geographic comparison

12.3 APAC - Market size and forecast 2025-2030

Chart on APAC - Market size and forecast 2025-2030 ($ million)
Data Table on APAC - Market size and forecast 2025-2030 ($ million)
Chart on APAC - Year-over-year growth 2025-2030 (%)
Data Table on APAC - Year-over-year growth 2025-2030 (%)
Chart on Regional Comparison - APAC
Data Table on Regional Comparison - APAC

12.3.1 China - Market size and forecast 2025-2030

Chart on China - Market size and forecast 2025-2030 ($ million)
Data Table on China - Market size and forecast 2025-2030 ($ million)
Chart on China - Year-over-year growth 2025-2030 (%)
Data Table on China - Year-over-year growth 2025-2030 (%)

12.3.2 Japan - Market size and forecast 2025-2030

Chart on Japan - Market size and forecast 2025-2030 ($ million)
Data Table on Japan - Market size and forecast 2025-2030 ($ million)
Chart on Japan - Year-over-year growth 2025-2030 (%)
Data Table on Japan - Year-over-year growth 2025-2030 (%)

12.3.3 South Korea - Market size and forecast 2025-2030

Chart on South Korea - Market size and forecast 2025-2030 ($ million)
Data Table on South Korea - Market size and forecast 2025-2030 ($ million)
Chart on South Korea - Year-over-year growth 2025-2030 (%)
Data Table on South Korea - Year-over-year growth 2025-2030 (%)

12.3.4 India - Market size and forecast 2025-2030

Chart on India - Market size and forecast 2025-2030 ($ million)
Data Table on India - Market size and forecast 2025-2030 ($ million)
Chart on India - Year-over-year growth 2025-2030 (%)
Data Table on India - Year-over-year growth 2025-2030 (%)

12.3.5 Australia - Market size and forecast 2025-2030

Chart on Australia - Market size and forecast 2025-2030 ($ million)
Data Table on Australia - Market size and forecast 2025-2030 ($ million)
Chart on Australia - Year-over-year growth 2025-2030 (%)
Data Table on Australia - Year-over-year growth 2025-2030 (%)

12.3.6 Indonesia - Market size and forecast 2025-2030

Chart on Indonesia - Market size and forecast 2025-2030 ($ million)
Data Table on Indonesia - Market size and forecast 2025-2030 ($ million)
Chart on Indonesia - Year-over-year growth 2025-2030 (%)
Data Table on Indonesia - Year-over-year growth 2025-2030 (%)

12.4 North America - Market size and forecast 2025-2030

Chart on North America - Market size and forecast 2025-2030 ($ million)
Data Table on North America - Market size and forecast 2025-2030 ($ million)
Chart on North America - Year-over-year growth 2025-2030 (%)
Data Table on North America - Year-over-year growth 2025-2030 (%)
Chart on Regional Comparison - North America
Data Table on Regional Comparison - North America

12.4.1 US - Market size and forecast 2025-2030

Chart on US - Market size and forecast 2025-2030 ($ million)
Data Table on US - Market size and forecast 2025-2030 ($ million)
Chart on US - Year-over-year growth 2025-2030 (%)
Data Table on US - Year-over-year growth 2025-2030 (%)

12.4.2 Canada - Market size and forecast 2025-2030

Chart on Canada - Market size and forecast 2025-2030 ($ million)
Data Table on Canada - Market size and forecast 2025-2030 ($ million)
Chart on Canada - Year-over-year growth 2025-2030 (%)
Data Table on Canada - Year-over-year growth 2025-2030 (%)

12.4.3 Mexico - Market size and forecast 2025-2030

Chart on Mexico - Market size and forecast 2025-2030 ($ million)
Data Table on Mexico - Market size and forecast 2025-2030 ($ million)
Chart on Mexico - Year-over-year growth 2025-2030 (%)
Data Table on Mexico - Year-over-year growth 2025-2030 (%)

12.5 Europe - Market size and forecast 2025-2030

Chart on Europe - Market size and forecast 2025-2030 ($ million)
Data Table on Europe - Market size and forecast 2025-2030 ($ million)
Chart on Europe - Year-over-year growth 2025-2030 (%)
Data Table on Europe - Year-over-year growth 2025-2030 (%)
Chart on Regional Comparison - Europe
Data Table on Regional Comparison - Europe

12.5.1 Germany - Market size and forecast 2025-2030

Chart on Germany - Market size and forecast 2025-2030 ($ million)
Data Table on Germany - Market size and forecast 2025-2030 ($ million)
Chart on Germany - Year-over-year growth 2025-2030 (%)
Data Table on Germany - Year-over-year growth 2025-2030 (%)

12.5.2 France - Market size and forecast 2025-2030

Chart on France - Market size and forecast 2025-2030 ($ million)
Data Table on France - Market size and forecast 2025-2030 ($ million)
Chart on France - Year-over-year growth 2025-2030 (%)
Data Table on France - Year-over-year growth 2025-2030 (%)

12.5.3 UK - Market size and forecast 2025-2030

Chart on UK - Market size and forecast 2025-2030 ($ million)
Data Table on UK - Market size and forecast 2025-2030 ($ million)
Chart on UK - Year-over-year growth 2025-2030 (%)
Data Table on UK - Year-over-year growth 2025-2030 (%)

12.5.4 Italy - Market size and forecast 2025-2030

Chart on Italy - Market size and forecast 2025-2030 ($ million)
Data Table on Italy - Market size and forecast 2025-2030 ($ million)
Chart on Italy - Year-over-year growth 2025-2030 (%)
Data Table on Italy - Year-over-year growth 2025-2030 (%)

12.5.5 Spain - Market size and forecast 2025-2030

Chart on Spain - Market size and forecast 2025-2030 ($ million)
Data Table on Spain - Market size and forecast 2025-2030 ($ million)
Chart on Spain - Year-over-year growth 2025-2030 (%)
Data Table on Spain - Year-over-year growth 2025-2030 (%)

12.5.6 The Netherlands - Market size and forecast 2025-2030

Chart on The Netherlands - Market size and forecast 2025-2030 ($ million)
Data Table on The Netherlands - Market size and forecast 2025-2030 ($ million)
Chart on The Netherlands - Year-over-year growth 2025-2030 (%)
Data Table on The Netherlands - Year-over-year growth 2025-2030 (%)

12.6 Middle East and Africa - Market size and forecast 2025-2030

Chart on Middle East and Africa - Market size and forecast 2025-2030 ($ million)
Data Table on Middle East and Africa - Market size and forecast 2025-2030 ($ million)
Chart on Middle East and Africa - Year-over-year growth 2025-2030 (%)
Data Table on Middle East and Africa - Year-over-year growth 2025-2030 (%)
Chart on Regional Comparison - Middle East and Africa
Data Table on Regional Comparison - Middle East and Africa

12.6.1 Saudi Arabia - Market size and forecast 2025-2030

Chart on Saudi Arabia - Market size and forecast 2025-2030 ($ million)
Data Table on Saudi Arabia - Market size and forecast 2025-2030 ($ million)
Chart on Saudi Arabia - Year-over-year growth 2025-2030 (%)
Data Table on Saudi Arabia - Year-over-year growth 2025-2030 (%)

12.6.2 South Africa - Market size and forecast 2025-2030

Chart on South Africa - Market size and forecast 2025-2030 ($ million)
Data Table on South Africa - Market size and forecast 2025-2030 ($ million)
Chart on South Africa - Year-over-year growth 2025-2030 (%)
Data Table on South Africa - Year-over-year growth 2025-2030 (%)

12.6.3 UAE - Market size and forecast 2025-2030

Chart on UAE - Market size and forecast 2025-2030 ($ million)
Data Table on UAE - Market size and forecast 2025-2030 ($ million)
Chart on UAE - Year-over-year growth 2025-2030 (%)
Data Table on UAE - Year-over-year growth 2025-2030 (%)

12.6.4 Israel - Market size and forecast 2025-2030

Chart on Israel - Market size and forecast 2025-2030 ($ million)
Data Table on Israel - Market size and forecast 2025-2030 ($ million)
Chart on Israel - Year-over-year growth 2025-2030 (%)
Data Table on Israel - Year-over-year growth 2025-2030 (%)

12.6.5 Turkey - Market size and forecast 2025-2030

Chart on Turkey - Market size and forecast 2025-2030 ($ million)
Data Table on Turkey - Market size and forecast 2025-2030 ($ million)
Chart on Turkey - Year-over-year growth 2025-2030 (%)
Data Table on Turkey - Year-over-year growth 2025-2030 (%)

12.7 South America - Market size and forecast 2025-2030

Chart on South America - Market size and forecast 2025-2030 ($ million)
Data Table on South America - Market size and forecast 2025-2030 ($ million)
Chart on South America - Year-over-year growth 2025-2030 (%)
Data Table on South America - Year-over-year growth 2025-2030 (%)
Chart on Regional Comparison - South America
Data Table on Regional Comparison - South America

12.7.1 Brazil - Market size and forecast 2025-2030

Chart on Brazil - Market size and forecast 2025-2030 ($ million)
Data Table on Brazil - Market size and forecast 2025-2030 ($ million)
Chart on Brazil - Year-over-year growth 2025-2030 (%)
Data Table on Brazil - Year-over-year growth 2025-2030 (%)

12.7.2 Argentina - Market size and forecast 2025-2030

Chart on Argentina - Market size and forecast 2025-2030 ($ million)
Data Table on Argentina - Market size and forecast 2025-2030 ($ million)
Chart on Argentina - Year-over-year growth 2025-2030 (%)
Data Table on Argentina - Year-over-year growth 2025-2030 (%)

12.7.3 Chile - Market size and forecast 2025-2030

Chart on Chile - Market size and forecast 2025-2030 ($ million)
Data Table on Chile - Market size and forecast 2025-2030 ($ million)
Chart on Chile - Year-over-year growth 2025-2030 (%)
Data Table on Chile - Year-over-year growth 2025-2030 (%)

12.8 Market opportunity by geography

Market opportunity by geography ($ million)
Data Tables on Market opportunity by geography ($ million)

13. Drivers, Challenges, and Opportunity

13.1 Market drivers

Accelerating electrification and shift toward high-performance electric vehicles
Technological evolution of cell formats and manufacturing efficiency
Expansion of stationary energy storage systems and renewable energy integration

13.2 Market challenges

Supply chain volatility and sustainability requirements for raw material procurement
Technical constraints in volumetric efficiency and thermal management of large-format units
Intense competition from alternative battery formats and emerging chemistries

13.3 Impact of drivers and challenges

Impact of drivers and challenges in 2025 and 2030

13.4 Market opportunities

Adoption of large-format cylindrical designs and tables electrode technology
Integration of silicon-carbon anodes and high-nickel chemistries
Expansion of circular economy initiatives and regionalized manufacturing hubs

14. Competitive Landscape

14.1 Overview

14.2

Overview on criticality of inputs and factors of differentiation

14.3 Landscape disruption

Overview on factors of disruption

14.4 Industry risks

Impact of key risks on business

15. Competitive Analysis

15.1 Companies profiled

Companies covered

15.2 Company ranking index

15.3 Market positioning of companies

Matrix on companies position and classification

15.4 Contemporary Amperex Ltd.

Contemporary Amperex Ltd. - Overview
Contemporary Amperex Ltd. - Business segments
Contemporary Amperex Ltd. - Key offerings
Contemporary Amperex Ltd. - Segment focus
SWOT

15.5 E One Moli Energy Corp.

E One Moli Energy Corp. - Overview
E One Moli Energy Corp. - Product / Service
E One Moli Energy Corp. - Key offerings
SWOT

15.6 EVE Energy Co. Ltd.

EVE Energy Co. Ltd. - Overview
EVE Energy Co. Ltd. - Business segments
EVE Energy Co. Ltd. - Key offerings
EVE Energy Co. Ltd. - Segment focus
SWOT

15.7 Gotion Inc.

Gotion Inc. - Overview
Gotion Inc. - Product / Service
Gotion Inc. - Key offerings
SWOT

15.8 Jiangsu Highstar Battery Co.

Jiangsu Highstar Battery Co. - Overview
Jiangsu Highstar Battery Co. - Product / Service
Jiangsu Highstar Battery Co. - Key offerings
SWOT

15.9 LG Energy Solution Ltd.

LG Energy Solution Ltd. - Overview
LG Energy Solution Ltd. - Product / Service
LG Energy Solution Ltd. - Key news
LG Energy Solution Ltd. - Key offerings
SWOT

15.10 Murata Manufacturing Co. Ltd.

Murata Manufacturing Co. Ltd. - Overview
Murata Manufacturing Co. Ltd. - Business segments
Murata Manufacturing Co. Ltd. - Key offerings
Murata Manufacturing Co. Ltd. - Segment focus
SWOT

15.11 Northvolt AB

Northvolt AB - Overview
Northvolt AB - Product / Service
Northvolt AB - Key offerings
SWOT

15.12 Panasonic Holdings Corp.

Panasonic Holdings Corp. - Overview
Panasonic Holdings Corp. - Business segments
Panasonic Holdings Corp. - Key news
Panasonic Holdings Corp. - Key offerings
Panasonic Holdings Corp. - Segment focus
SWOT

15.13 Saft Groupe SAS

Saft Groupe SAS - Overview
Saft Groupe SAS - Product / Service
Saft Groupe SAS - Key offerings
SWOT

15.14 Samsung SDI Co. Ltd.

Samsung SDI Co. Ltd. - Overview
Samsung SDI Co. Ltd. - Business segments
Samsung SDI Co. Ltd. - Key offerings
Samsung SDI Co. Ltd. - Segment focus
SWOT

15.15 Shenzhen BAK Battery Co. Ltd.

Shenzhen BAK Battery Co. Ltd. - Overview
Shenzhen BAK Battery Co. Ltd. - Product / Service
Shenzhen BAK Battery Co. Ltd. - Key offerings
SWOT

15.16 Sunwoda Electronic Co. Ltd.

Sunwoda Electronic Co. Ltd. - Overview
Sunwoda Electronic Co. Ltd. - Business segments
Sunwoda Electronic Co. Ltd. - Key offerings
Sunwoda Electronic Co. Ltd. - Segment focus
SWOT

15.17 SVOLT Energy Technology Co. Ltd.

SVOLT Energy Technology Co. Ltd. - Overview
SVOLT Energy Technology Co. Ltd. - Product / Service
SVOLT Energy Technology Co. Ltd. - Key offerings
SWOT

15.18 TianJin Lishen Battery Ltd.

TianJin Lishen Battery Ltd. - Overview
TianJin Lishen Battery Ltd. - Product / Service
TianJin Lishen Battery Ltd. - Key offerings
SWOT

16. Appendix

16.1 Scope of the report

Market definition
Objectives
Notes and caveats

16.2 Inclusions and exclusions checklist

Inclusions checklist
Exclusions checklist

16.3 Currency conversion rates for US$

16.4 Research methodology

16.5 Data procurement

Information sources

16.6 Data validation

16.7 Validation techniques employed for market sizing

16.8 Data synthesis

16.9 360 degree market analysis

16.10 List of abbreviations

Research Methodology

Technavio presents a detailed picture of the market by way of study, synthesis, and summation of data from multiple sources. The analysts have presented the various facets of the market with a particular focus on identifying the key industry influencers. The data thus presented is comprehensive, reliable, and the result of extensive research, both primary and secondary.

INFORMATION SOURCES

Primary sources

  • Manufacturers and suppliers
  • Channel partners
  • Industry experts
  • Strategic decision makers

Secondary sources

  • Industry journals and periodicals
  • Government data
  • Financial reports of key industry players
  • Historical data
  • Press releases

DATA ANALYSIS

Data Synthesis

  • Collation of data
  • Estimation of key figures
  • Analysis of derived insights

Data Validation

  • Triangulation with data models
  • Reference against proprietary databases
  • Corroboration with industry experts

REPORT WRITING

Qualitative

  • Market drivers
  • Market challenges
  • Market trends
  • Five forces analysis

Quantitative

  • Market size and forecast
  • Market segmentation
  • Geographical insights
  • Competitive landscape

Interested in this report?

Get your sample now to see our research methodology and insights!

Download Now

Frequently Asked Questions

Cylindrical Cells market growth will increase by USD 7760.0 million during 2026-2030.

The Cylindrical Cells market is expected to grow at a CAGR of 7.4% during 2026-2030.

Cylindrical Cells market is segmented by Type (NMC, LFP, LCO, Others) Application (Automotive, Consumer electronics, Industrial equipment, Energy storage systems, Others) Product (18650 format, 21700 and 2170 format, 46xx series, Others)

Contemporary Amperex Ltd., E One Moli Energy Corp., Envision Energy USA Ltd., EVE Energy Co. Ltd., FDK Corp., Gotion Inc., GP Batteries International Ltd., Jiangsu Highstar Battery Co., LG Energy Solution Ltd., Murata Manufacturing Co. Ltd., Northvolt AB, Panasonic Holdings Corp., Saft Groupe SAS, Samsung SDI Co. Ltd., Shenzhen BAK Battery Co. Ltd., Sunwoda Electronic Co. Ltd., SVOLT Energy Technology Co. Ltd., Tesla Inc., TianJin Lishen Battery Ltd., VARTA AG are a few of the key vendors in the Cylindrical Cells market.

APAC will register the highest growth rate of 53.7% among the other regions. Therefore, the Cylindrical Cells market in APAC is expected to garner significant business opportunities for the vendors during the forecast period.

China, Japan, South Korea, India, Australia, Indonesia, US, Canada, Mexico, Germany, France, UK, Italy, Spain, The Netherlands, Saudi Arabia, South Africa, UAE, Israel, Turkey, Brazil, Argentina, Chile

  • Accelerating electrification and shift toward high-performance electric vehicles is the driving factor this market.

The Cylindrical Cells market vendors should focus on grabbing business opportunities from the Type segment as it accounted for the largest market share in the base year.
RIA - Research AI Assistant
Ask RIA