Cosmetic Products Market Analysis, Size, and Forecast 2026-2030: APAC (China, Japan, and India), North America (US, Canada, and Mexico), Europe (Germany, France, and UK), South America (Brazil, Argentina, and Colombia), Middle East and Africa (Saudi Arabia, UAE, and South Africa), and Rest of World (ROW)

Cosmetic Products Market Analysis, Size, and Forecast 2026-2030:
APAC (China, Japan, and India), North America (US, Canada, and Mexico), Europe (Germany, France, and UK), South America (Brazil, Argentina, and Colombia), Middle East and Africa (Saudi Arabia, UAE, and South Africa), and Rest of World (ROW)

Published: May 2026 298 Pages SKU: IRTNTR70899

Market Overview at a Glance

$129.51 B
Market Opportunity
5.6%
CAGR 2025 - 2030
49.3%
APAC Growth
$148.63 B
Skincare products segment 2024

Cosmetic Products Market Size 2026-2030

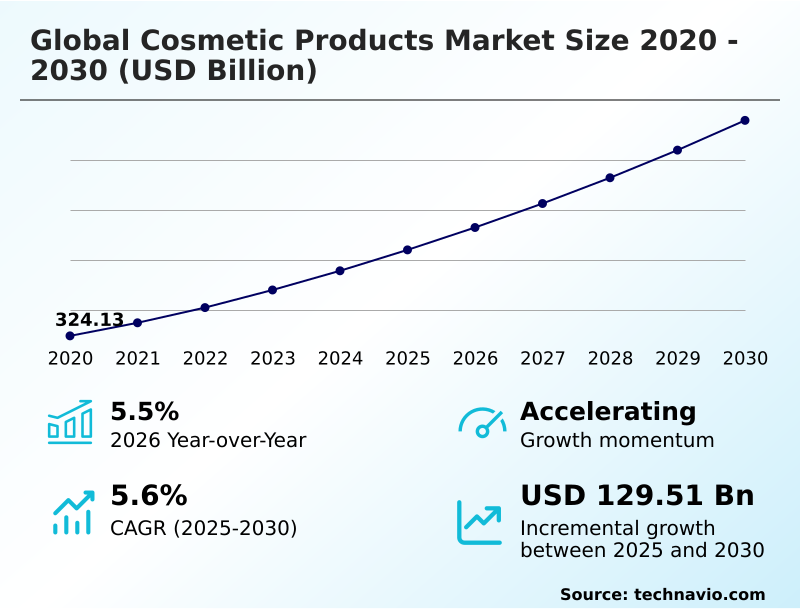
The cosmetic products market size is valued to increase by USD 129.51 billion, at a CAGR of 5.6% from 2025 to 2030. Rise in aging population is increasing market demand will drive the cosmetic products market.

Major Market Trends & Insights

  • APAC dominated the market and accounted for a 49.3% growth during the forecast period.
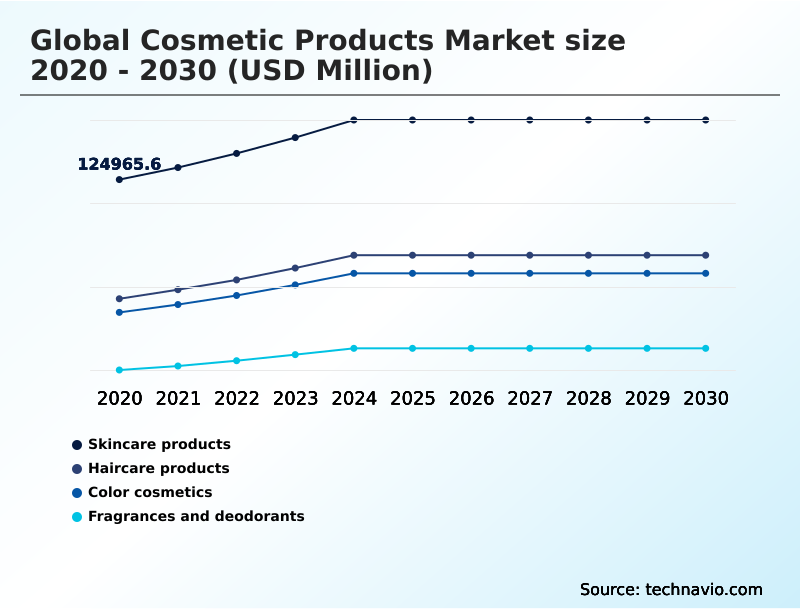
  • By Product - Skincare products segment was valued at USD 148.63 billion in 2024
  • By Distribution Channel - Offline segment accounted for the largest market revenue share in 2024

Market Size & Forecast

  • Market Opportunities: USD 215.50 billion
  • Market Future Opportunities: USD 129.51 billion
  • CAGR from 2025 to 2030 : 5.6%

Market Summary

  • The cosmetic products market is undergoing a significant transformation, driven by a confluence of technological innovation, heightened consumer consciousness, and demographic shifts. A key driver is the increasing demand for preventive skincare and specialized solutions that address age-related skin concerns, which has spurred the development of anti-aging skincare featuring collagen-boosting compounds and bioactive ingredients.
  • Concurrently, the clean beauty movement champions ingredient transparency, pushing brands toward plant-based formulations and sustainable packaging. This aligns with the growing preference for organic cosmetics and cosmeceuticals that blend aesthetic benefits with therapeutic effects. Digitalization further reshapes the landscape, with AI-based product recommendations and virtual try-on tools creating personalized consumer journeys.
  • For instance, a business can leverage data from these tools to optimize its supply chain, ensuring that inventory for high-demand shades or formulations, like those for skin barrier repair, is allocated efficiently across regional warehouses. This reduces stockouts and improves fulfillment times.
  • Challenges persist, including navigating complex global regulations and combating the proliferation of counterfeit goods, which undermine brand value and consumer trust in products like dermatologically tested formulations.

What will be the Size of the Cosmetic Products Market during the forecast period?

Get Key Insights on Market Forecast (PDF) Get Free Sample

How is the Cosmetic Products Market Segmented?

The cosmetic products industry research report provides comprehensive data (region-wise segment analysis), with forecasts and estimates in "USD million" for the period 2026-2030, as well as historical data from 2020-2024 for the following segments.

  • Product
    • Skincare products
    • Haircare products
    • Color cosmetics
    • Fragrances and deodorants
  • Distribution channel
    • Offline
    • Online
  • Type
    • Organic
    • Conventional
  • Geography
    • APAC
      • China
      • Japan
      • India
    • North America
      • US
      • Canada
      • Mexico
    • Europe
      • Germany
      • France
      • UK
    • South America
      • Brazil
      • Argentina
      • Colombia
    • Middle East and Africa
      • Saudi Arabia
      • UAE
      • South Africa
    • Rest of World (ROW)

By Product Insights

The skincare products segment is estimated to witness significant growth during the forecast period.

The skincare products segment stands as the largest category, driven by a consumer shift toward prioritizing skin health and preventive care.

This has fueled demand for advanced formulations addressing concerns from pigmentation to aging, with products such as anti-aging creams and antioxidant-rich serums becoming staples.

Consumers are increasingly seeking personalized beauty solutions tailored to specific skin types and lifestyles, with a notable preference for plant-based formulations. This evolution is supported by a focus on overall wellness, where skincare is integrated into a holistic health regimen.

Adoption of routines featuring dermatologically tested formulations has increased, with data showing that products addressing specific age-related skin concerns now account for over 60% of new product launches in the premium skincare sub-segment.

Get Free Sample

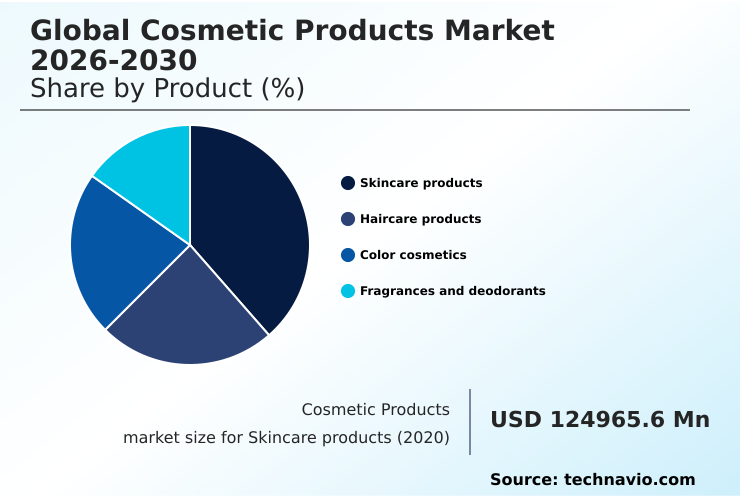
The Skincare products segment was valued at USD 148.63 billion in 2024 and showed a gradual increase during the forecast period.

Get Free Sample

Regional Analysis

APAC is estimated to contribute 49.3% to the growth of the global market during the forecast period.Technavio’s analysts have elaborately explained the regional trends and drivers that shape the market during the forecast period.

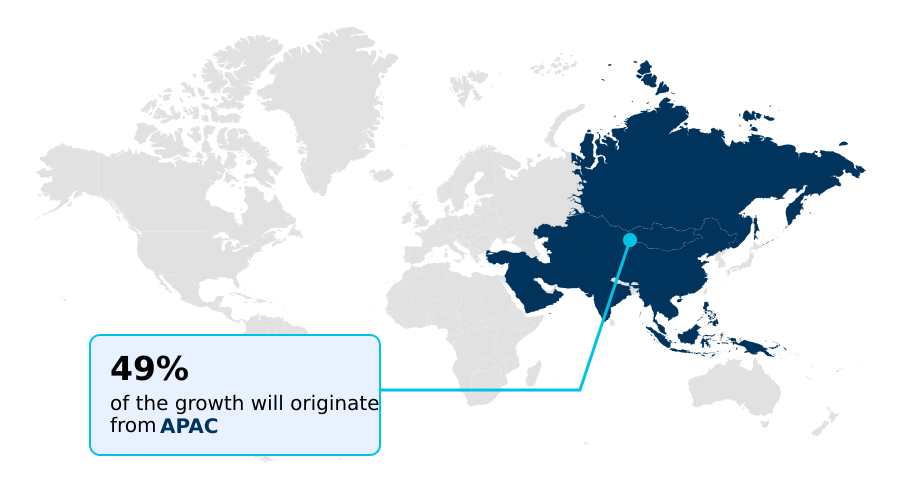
See How Cosmetic Products Market Demand is Rising in APAC Get Free Sample

The market's geographic dynamics are increasingly fragmented, with regional preferences driving innovation. In APAC, which accounts for nearly 50% of incremental growth, demand for products with a high sun protection factor and those featuring herbal extracts is paramount.

The Middle East shows a strong preference for halal-certified beauty and luxurious essential oils. Meanwhile, North American and European consumers are driving trends in microbiome skincare and organic cosmetics, with a focus on locally sourced ingredients and traditional botanical ingredients.

This regional differentiation extends to product categories, with markets like Brazil leading in hair thinning solutions, while Europe pioneers cryotherapy-inspired skincare.

The diverse needs create opportunities for niche products like on-the-go beauty sticks and waterless beauty formulas tailored to specific climates and lifestyles, featuring unique botanical extracts.

Market Dynamics

Our researchers analyzed the data with 2025 as the base year, along with the key drivers, trends, and challenges. A holistic analysis of drivers will help companies refine their marketing strategies to gain a competitive advantage.

  • Strategic analysis of the Global Cosmetic Products Market 2026-2030 requires a deep dive into its multifaceted dynamics. Understanding the nuances of Global Cosmetic Products Market 2026-2030 organic versus conventional growth reveals a clear consumer pivot toward natural formulations, influencing R&D pipelines.
  • This is directly linked to Global Cosmetic Products Market 2026-2030 skincare product innovation, where advancements in cosmeceuticals redefine category boundaries. The Global Cosmetic Products Market 2026-2030 impact of online retail channels cannot be overstated, as digital platforms have fundamentally altered brand-consumer interactions, a trend amplified by the future of virtual try-on technology.
  • The Global Cosmetic Products Market 2026-2030 role of multifunctional cosmetics addresses the modern consumer's need for efficiency, while the Global Cosmetic Products Market 2026-2030 challenges from counterfeit products remain a critical risk to brand equity and revenue. Key drivers for premium brand sales include perceived quality and the Global Cosmetic Products Market 2026-2030 demand for anti-aging solutions.
  • The industry's response is seen in Global Cosmetic Products Market 2026-2030 innovation in haircare formulations and the widespread adoption of Global Cosmetic Products Market 2026-2030 trends in sustainable packaging.
  • The rise of Global Cosmetic Products Market 2026-2030 cosmeceuticals market share analysis, the Global Cosmetic Products Market 2026-2030 influence of AI on personalization, and the growing male grooming segment expansion are all reshaping the competitive landscape.
  • As the Global Cosmetic Products Market 2026-2030 rise of clean beauty standards becomes mainstream, the effectiveness of direct-to-consumer brand strategies and influencer marketing is scrutinized. This is particularly relevant in the Global Cosmetic Products Market 2026-2030 APAC market growth opportunities, where digital-first approaches show an engagement uplift nearly double that of traditional retail.
  • Ultimately, navigating Global Cosmetic Products Market 2026-2030 regulatory compliance hurdles and differentiating between premium vs mass product segmentation while managing the consumer shift to waterless products will define market leadership.

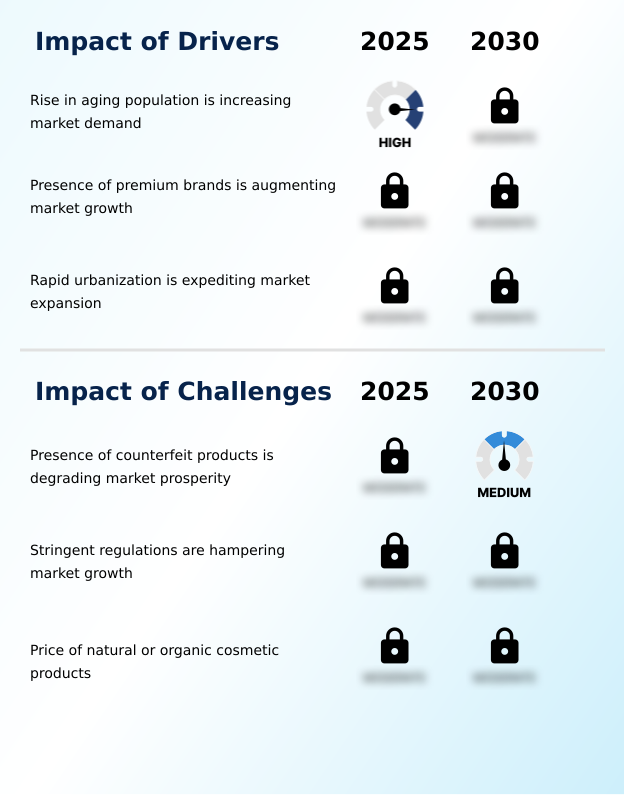
What are the key market drivers leading to the rise in the adoption of Cosmetic Products Industry?

  • A key driver propelling market growth is the rise in the global aging population, which is significantly increasing demand for cosmetic products.

  • Demographic shifts and rising disposable incomes are key drivers accelerating market expansion. The growing focus on preventive skincare and a pro-aging philosophy has broadened the appeal of anti-aging skincare, with consumers actively seeking collagen-boosting compounds and skin elasticity enhancers.
  • This has fueled demand for premium skincare products, where personalized beauty solutions for age-related skin concerns are a primary value proposition.
  • The rise of direct-to-consumer cosmetic brands has improved access to such products, with these channels showing a 25% higher engagement rate on new launches. Consumers increasingly favor dermatologically tested formulations and effective peptide-infused creams.
  • This is complemented by the growth of beauty-from-within supplements and the industry-wide push for inclusive shade ranges to cater to a diverse global audience.

What are the market trends shaping the Cosmetic Products Industry?

  • A significant trend influencing the market is the growing consumer preference for organic cosmetics and cosmeceuticals. This shift is driven by increased awareness regarding health, ingredient safety, and transparency.

  • The market is witnessing a convergence of technology and sustainability, shaping new consumer expectations. The skinimalism trend is driving demand for multifunctional cosmetics that simplify routines, while a focus on wellness-infused beauty elevates products beyond aesthetics.
  • Digital tools are central to this shift; virtual try-on tools and augmented reality makeup filters now reduce purchase friction, with some platforms reporting a 30% decrease in returns. AI-based product recommendations are also creating hyper-personalized experiences, boosting conversion rates by up to 15%.
  • Concurrently, clean beauty standards are becoming stricter, promoting plant-based formulations, water-free formulas, and the use of innovative upcycled ingredients, aligning with the principles of farm-to-face skincare and gender-neutral beauty offerings. Subscription-based beauty boxes further accelerate the discovery of these new product types.

What challenges does the Cosmetic Products Industry face during its growth?

  • A primary challenge affecting industry growth is the presence of counterfeit products, which degrades market prosperity and erodes consumer trust.

  • Navigating regulatory complexities and consumer expectations around ingredient transparency presents a significant challenge. The demand for ethical production methods and cruelty-free testing requires substantial investment in supply chain verification, increasing operational costs by an average of 10%.
  • Furthermore, the transition to sustainable packaging and biodegradable packaging is hampered by material science limitations and cost barriers, though brands using refillable cosmetic packaging report a 15% improvement in customer loyalty. Formulating products with novel bioactive ingredients, retinoid alternatives, or adaptogenic ingredients while ensuring stability and efficacy is another hurdle.
  • Advanced encapsulation technologies are being explored to protect sensitive compounds used in anti-pollution skincare and neurocosmetics, but scaling eco-friendly manufacturing for these complex formulations remains a persistent industry-wide issue.

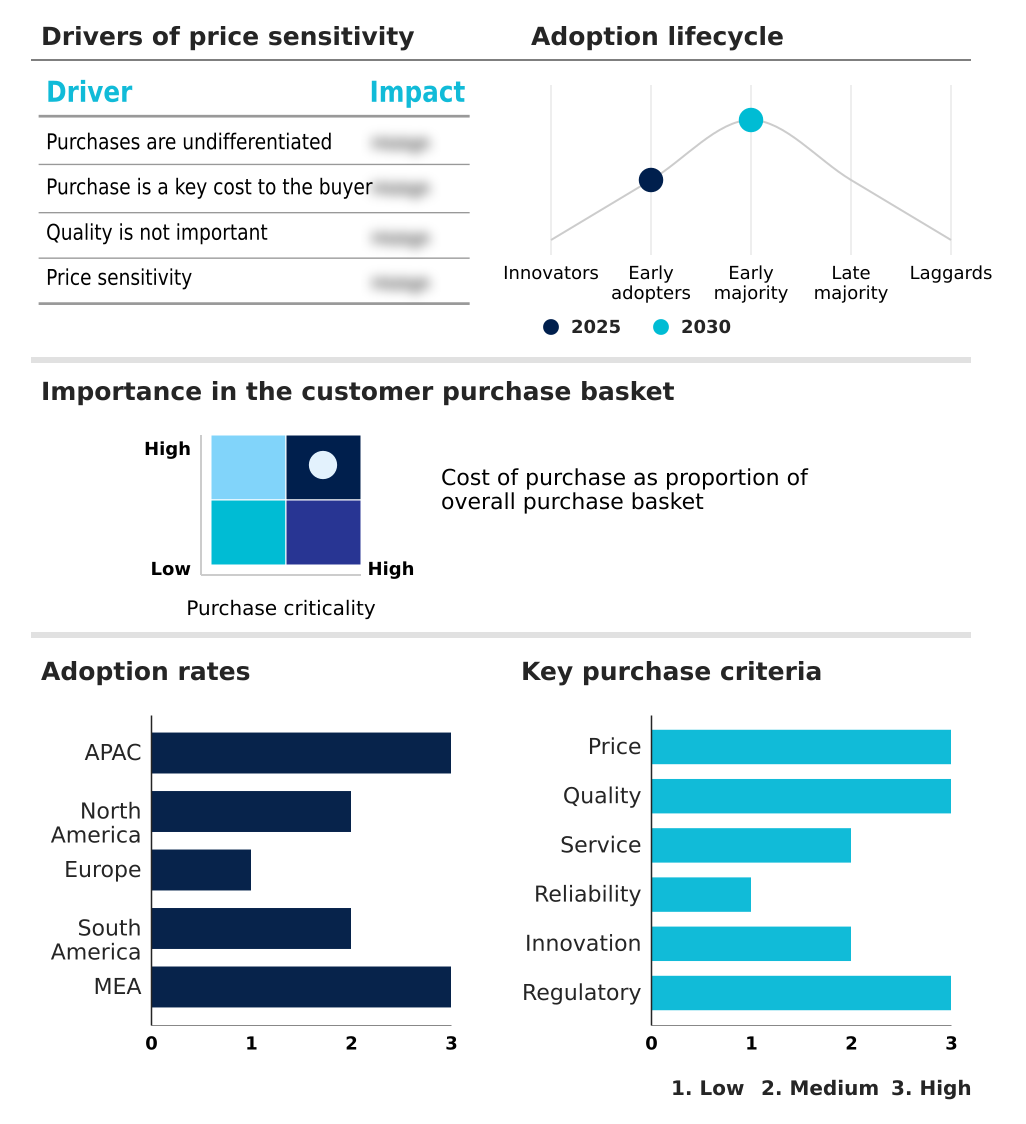
Exclusive Technavio Analysis on Customer Landscape

The cosmetic products market forecasting report includes the adoption lifecycle of the market, covering from the innovator’s stage to the laggard’s stage. It focuses on adoption rates in different regions based on penetration. Furthermore, the cosmetic products market report also includes key purchase criteria and drivers of price sensitivity to help companies evaluate and develop their market growth analysis strategies.

Customer Landscape of Cosmetic Products Industry

Competitive Landscape

Companies are implementing various strategies, such as strategic alliances, cosmetic products market forecast, partnerships, mergers and acquisitions, geographical expansion, and product/service launches, to enhance their presence in the industry.

AMOREPACIFIC Group Inc. - Specializes in developing and marketing a diverse portfolio of skincare formulations and premium beauty products to a global consumer base.

The industry research and growth report includes detailed analyses of the competitive landscape of the market and information about key companies, including:

  • AMOREPACIFIC Group Inc.
  • Avon Products Inc.
  • Beiersdorf AG
  • Christian Dior SE
  • Coty Inc.
  • e.l.f. Beauty Inc.
  • Huda Beauty Ltd.
  • Kao Corp.
  • LG Household and Health Care Ltd.
  • Loreal SA
  • Mary Kay Inc.
  • Natura and Co. Holding SA
  • Oriflame Cosmetics SA
  • Pat McGrath
  • Procter and Gamble Co.
  • Revlon Inc.
  • Shiseido Co. Ltd.
  • The Body Shop International
  • The Estee Lauder Co. Inc.
  • Unilever PLC

Qualitative and quantitative analysis of companies has been conducted to help clients understand the wider business environment as well as the strengths and weaknesses of key industry players. Data is qualitatively analyzed to categorize companies as pure play, category-focused, industry-focused, and diversified; it is quantitatively analyzed to categorize companies as dominant, leading, strong, tentative, and weak.

Recent Development and News in Cosmetic products market

  • In March 2025, Loreal SA launched a new line of waterless, solid-format cosmetics, including shampoo bars and cleansers, under its Garnier brand to advance its sustainability goals and cater to eco-conscious consumers.
  • In January 2025, The Estee Lauder Co. Inc. acquired 'SkinTech AI,' a leading AI-powered skin analysis startup, for an undisclosed sum to integrate personalized recommendation technology across its digital platforms and enhance customer engagement.
  • In November 2024, Beiersdorf AG announced a strategic partnership with biotech firm 'BioSynthetics Ltd.' to develop and scale up production of novel, lab-grown botanical extracts for its NIVEA and Eucerin brands, focusing on sustainable ingredient sourcing.
  • In September 2024, Shiseido Co. Ltd. announced a $50 million investment to expand its direct-to-consumer operations in India, launching dedicated e-commerce sites for its key prestige brands to capture growing demand in the region.

Dive into Technavio’s robust research methodology, blending expert interviews, extensive data synthesis, and validated models for unparalleled Cosmetic Products Market insights. See full methodology.

Market Scope
Page number 298
Base year 2025
Historic period 2020-2024
Forecast period 2026-2030
Growth momentum & CAGR Accelerate at a CAGR of 5.6%
Market growth 2026-2030 USD 129509.8 million
Market structure Fragmented
YoY growth 2025-2026(%) 5.5%
Key countries China, Japan, India, South Korea, Indonesia, Australia, US, Canada, Mexico, Germany, France, UK, Italy, Spain, Russia, Brazil, Argentina, Colombia, Saudi Arabia, UAE, South Africa, Turkey and Israel
Competitive landscape Leading Companies, Market Positioning of Companies, Competitive Strategies, and Industry Risks

Request Free Sample

Research Analyst Overview

  • The market is defined by a sophisticated interplay between scientific advancement and ethical consumerism. Boardroom decisions are now heavily influenced by the need to integrate clean beauty standards and ensure ingredient transparency across all product lines. This requires investment in advanced formulations featuring bioactive ingredients, bioactive compounds, and botanical extracts.
  • The demand for anti-aging skincare and preventive skincare is met with collagen-boosting compounds, peptide-infused creams, and skin elasticity enhancers, often found in premium skincare and cosmeceuticals. The push for sustainability is evident in the adoption of sustainable packaging, biodegradable packaging, water-free formulas, and solid format cosmetics made from upcycled ingredients.
  • Innovation continues with encapsulation technologies for delivering herbal extracts and essential oils in dermatologically tested formulations for skin barrier repair and microbiome skincare. Plant-based formulations and natural ingredients are standard, while research into retinoid alternatives is accelerating. For instance, firms adopting full-scale cruelty-free testing protocols have reported a 25% reduction in compliance-related delays for entry into key markets.
  • The market also addresses specific needs with hair thinning solutions, products with high sun protection factor, and the rise of organic cosmetics, including antioxidant-rich serums.

What are the Key Data Covered in this Cosmetic Products Market Research and Growth Report?

  • What is the expected growth of the Cosmetic Products Market between 2026 and 2030?

    • USD 129.51 billion, at a CAGR of 5.6%

  • What segmentation does the market report cover?

    • The report is segmented by Product (Skincare products, Haircare products, Color cosmetics, and Fragrances and deodorants), Distribution Channel (Offline, and Online), Type (Organic, and Conventional) and Geography (APAC, North America, Europe, South America, Middle East and Africa)

  • Which regions are analyzed in the report?

    • APAC, North America, Europe, South America and Middle East and Africa

  • What are the key growth drivers and market challenges?

    • Rise in aging population is increasing market demand, Presence of counterfeit products is degrading market prosperity

  • Who are the major players in the Cosmetic Products Market?

    • AMOREPACIFIC Group Inc., Avon Products Inc., Beiersdorf AG, Christian Dior SE, Coty Inc., e.l.f. Beauty Inc., Huda Beauty Ltd., Kao Corp., LG Household and Health Care Ltd., Loreal SA, Mary Kay Inc., Natura and Co. Holding SA, Oriflame Cosmetics SA, Pat McGrath, Procter and Gamble Co., Revlon Inc., Shiseido Co. Ltd., The Body Shop International, The Estee Lauder Co. Inc. and Unilever PLC

Market Research Insights

  • The market's dynamism is fueled by a shift towards highly personalized beauty solutions and inclusive shade ranges, addressing a more diverse consumer base than ever before. Direct-to-consumer cosmetic brands are leveraging digital platforms to cater to niche preferences, achieving a 20% higher customer retention rate compared to traditional retail.
  • The skinimalism trend, favoring fewer, more effective products, has led to a 15% increase in the development of multifunctional items. Innovations like waterless beauty formulas and refillable cosmetic packaging are not just trends but are becoming core to ethical production methods, satisfying consumer demand for sustainability.
  • This is complemented by the growth of wellness-infused beauty and farm-to-face skincare, blurring the lines between personal care and holistic health.

We can help! Our analysts can customize this cosmetic products market research report to meet your requirements.

Get in touch

1. Executive Summary

1.1 Market overview

Executive Summary - Chart on Market Overview
Executive Summary - Data Table on Market Overview
Executive Summary - Chart on Global Market Characteristics
Executive Summary - Chart on Market by Geography
Executive Summary - Chart on Market Segmentation by Product
Executive Summary - Chart on Market Segmentation by Distribution Channel
Executive Summary - Chart on Market Segmentation by Type
Executive Summary - Chart on Incremental Growth
Executive Summary - Data Table on Incremental Growth
Executive Summary - Chart on Company Market Positioning

2. Technavio Analysis

2.1 Analysis of price sensitivity, lifecycle, customer purchase basket, adoption rates, and purchase criteria

2.2 Criticality of inputs and Factors of differentiation

Chart on Overview on criticality of inputs and factors of differentiation

2.3 Factors of disruption

Chart on Overview on factors of disruption

2.4 Impact of drivers and challenges

Chart on Impact of drivers and challenges in 2025 and 2030

3. Market Landscape

3.1 Market ecosystem

Chart on Parent Market
Data Table on - Parent Market

3.2 Market characteristics

Chart on Market characteristics analysis

3.3 Value chain analysis

Chart on Value chain analysis

4. Market Sizing

4.1 Market definition

Data Table on Offerings of companies included in the market definition

4.2 Market segment analysis

Market segments

4.3 Market size 2025

4.4 Market outlook: Forecast for 2025-2030

Chart on Global - Market size and forecast 2025-2030 ($ million)
Data Table on Global - Market size and forecast 2025-2030 ($ million)
Chart on Global Market: Year-over-year growth 2025-2030 (%)
Data Table on Global Market: Year-over-year growth 2025-2030 (%)

5. Historic Market Size

5.1 Global Cosmetic Products Market 2020 - 2024

Historic Market Size - Data Table on Global Cosmetic Products Market 2020 - 2024 ($ million)

5.2 Product segment analysis 2020 - 2024

Historic Market Size - Product Segment 2020 - 2024 ($ million)

5.3 Distribution Channel segment analysis 2020 - 2024

Historic Market Size - Distribution Channel Segment 2020 - 2024 ($ million)

5.4 Type segment analysis 2020 - 2024

Historic Market Size - Type Segment 2020 - 2024 ($ million)

5.5 Geography segment analysis 2020 - 2024

Historic Market Size - Geography Segment 2020 - 2024 ($ million)

5.6 Country segment analysis 2020 - 2024

Historic Market Size - Country Segment 2020 - 2024 ($ million)

6. Qualitative Analysis

6.1 Impact of AI on Global Cosmetic Products Market

6.2 Impact of Geopolitical Conflicts on Global Cosmetic Products Market

7. Five Forces Analysis

7.1 Five forces summary

Five forces analysis - Comparison between 2025 and 2030

7.2 Bargaining power of buyers

Bargaining power of buyers - Impact of key factors 2025 and 2030

7.3 Bargaining power of suppliers

Bargaining power of suppliers - Impact of key factors in 2025 and 2030

7.4 Threat of new entrants

Threat of new entrants - Impact of key factors in 2025 and 2030

7.5 Threat of substitutes

Threat of substitutes - Impact of key factors in 2025 and 2030

7.6 Threat of rivalry

Threat of rivalry - Impact of key factors in 2025 and 2030

7.7 Market condition

Chart on Market condition - Five forces 2025 and 2030

8. Market Segmentation by Product

8.1 Market segments

Chart on Product - Market share 2025-2030 (%)
Data Table on Product - Market share 2025-2030 (%)

8.2 Comparison by Product

Chart on Comparison by Product
Data Table on Comparison by Product

8.3 Skincare products - Market size and forecast 2025-2030

Chart on Skincare products - Market size and forecast 2025-2030 ($ million)
Data Table on Skincare products - Market size and forecast 2025-2030 ($ million)
Chart on Skincare products - Year-over-year growth 2025-2030 (%)
Data Table on Skincare products - Year-over-year growth 2025-2030 (%)

8.4 Haircare products - Market size and forecast 2025-2030

Chart on Haircare products - Market size and forecast 2025-2030 ($ million)
Data Table on Haircare products - Market size and forecast 2025-2030 ($ million)
Chart on Haircare products - Year-over-year growth 2025-2030 (%)
Data Table on Haircare products - Year-over-year growth 2025-2030 (%)

8.5 Color cosmetics - Market size and forecast 2025-2030

Chart on Color cosmetics - Market size and forecast 2025-2030 ($ million)
Data Table on Color cosmetics - Market size and forecast 2025-2030 ($ million)
Chart on Color cosmetics - Year-over-year growth 2025-2030 (%)
Data Table on Color cosmetics - Year-over-year growth 2025-2030 (%)

8.6 Fragrances and deodorants - Market size and forecast 2025-2030

Chart on Fragrances and deodorants - Market size and forecast 2025-2030 ($ million)
Data Table on Fragrances and deodorants - Market size and forecast 2025-2030 ($ million)
Chart on Fragrances and deodorants - Year-over-year growth 2025-2030 (%)
Data Table on Fragrances and deodorants - Year-over-year growth 2025-2030 (%)

8.7 Market opportunity by Product

Market opportunity by Product ($ million)
Data Table on Market opportunity by Product ($ million)

9. Market Segmentation by Distribution Channel

9.1 Market segments

Chart on Distribution Channel - Market share 2025-2030 (%)
Data Table on Distribution Channel - Market share 2025-2030 (%)

9.2 Comparison by Distribution Channel

Chart on Comparison by Distribution Channel
Data Table on Comparison by Distribution Channel

9.3 Offline - Market size and forecast 2025-2030

Chart on Offline - Market size and forecast 2025-2030 ($ million)
Data Table on Offline - Market size and forecast 2025-2030 ($ million)
Chart on Offline - Year-over-year growth 2025-2030 (%)
Data Table on Offline - Year-over-year growth 2025-2030 (%)

9.4 Online - Market size and forecast 2025-2030

Chart on Online - Market size and forecast 2025-2030 ($ million)
Data Table on Online - Market size and forecast 2025-2030 ($ million)
Chart on Online - Year-over-year growth 2025-2030 (%)
Data Table on Online - Year-over-year growth 2025-2030 (%)

9.5 Market opportunity by Distribution Channel

Market opportunity by Distribution Channel ($ million)
Data Table on Market opportunity by Distribution Channel ($ million)

10. Market Segmentation by Type

10.1 Market segments

Chart on Type - Market share 2025-2030 (%)
Data Table on Type - Market share 2025-2030 (%)

10.2 Comparison by Type

Chart on Comparison by Type
Data Table on Comparison by Type

10.3 Organic - Market size and forecast 2025-2030

Chart on Organic - Market size and forecast 2025-2030 ($ million)
Data Table on Organic - Market size and forecast 2025-2030 ($ million)
Chart on Organic - Year-over-year growth 2025-2030 (%)
Data Table on Organic - Year-over-year growth 2025-2030 (%)

10.4 Conventional - Market size and forecast 2025-2030

Chart on Conventional - Market size and forecast 2025-2030 ($ million)
Data Table on Conventional - Market size and forecast 2025-2030 ($ million)
Chart on Conventional - Year-over-year growth 2025-2030 (%)
Data Table on Conventional - Year-over-year growth 2025-2030 (%)

10.5 Market opportunity by Type

Market opportunity by Type ($ million)
Data Table on Market opportunity by Type ($ million)

11. Customer Landscape

11.1 Customer landscape overview

Analysis of price sensitivity, lifecycle, customer purchase basket, adoption rates, and purchase criteria

12. Geographic Landscape

12.1 Geographic segmentation

Chart on Market share by geography 2025-2030 (%)
Data Table on Market share by geography 2025-2030 (%)

12.2 Geographic comparison

Chart on Geographic comparison
Data Table on Geographic comparison

12.3 APAC - Market size and forecast 2025-2030

Chart on APAC - Market size and forecast 2025-2030 ($ million)
Data Table on APAC - Market size and forecast 2025-2030 ($ million)
Chart on APAC - Year-over-year growth 2025-2030 (%)
Data Table on APAC - Year-over-year growth 2025-2030 (%)
Chart on Regional Comparison - APAC
Data Table on Regional Comparison - APAC

12.3.1 China - Market size and forecast 2025-2030

Chart on China - Market size and forecast 2025-2030 ($ million)
Data Table on China - Market size and forecast 2025-2030 ($ million)
Chart on China - Year-over-year growth 2025-2030 (%)
Data Table on China - Year-over-year growth 2025-2030 (%)

12.3.2 Japan - Market size and forecast 2025-2030

Chart on Japan - Market size and forecast 2025-2030 ($ million)
Data Table on Japan - Market size and forecast 2025-2030 ($ million)
Chart on Japan - Year-over-year growth 2025-2030 (%)
Data Table on Japan - Year-over-year growth 2025-2030 (%)

12.3.3 India - Market size and forecast 2025-2030

Chart on India - Market size and forecast 2025-2030 ($ million)
Data Table on India - Market size and forecast 2025-2030 ($ million)
Chart on India - Year-over-year growth 2025-2030 (%)
Data Table on India - Year-over-year growth 2025-2030 (%)

12.3.4 South Korea - Market size and forecast 2025-2030

Chart on South Korea - Market size and forecast 2025-2030 ($ million)
Data Table on South Korea - Market size and forecast 2025-2030 ($ million)
Chart on South Korea - Year-over-year growth 2025-2030 (%)
Data Table on South Korea - Year-over-year growth 2025-2030 (%)

12.3.5 Indonesia - Market size and forecast 2025-2030

Chart on Indonesia - Market size and forecast 2025-2030 ($ million)
Data Table on Indonesia - Market size and forecast 2025-2030 ($ million)
Chart on Indonesia - Year-over-year growth 2025-2030 (%)
Data Table on Indonesia - Year-over-year growth 2025-2030 (%)

12.3.6 Australia - Market size and forecast 2025-2030

Chart on Australia - Market size and forecast 2025-2030 ($ million)
Data Table on Australia - Market size and forecast 2025-2030 ($ million)
Chart on Australia - Year-over-year growth 2025-2030 (%)
Data Table on Australia - Year-over-year growth 2025-2030 (%)

12.4 North America - Market size and forecast 2025-2030

Chart on North America - Market size and forecast 2025-2030 ($ million)
Data Table on North America - Market size and forecast 2025-2030 ($ million)
Chart on North America - Year-over-year growth 2025-2030 (%)
Data Table on North America - Year-over-year growth 2025-2030 (%)
Chart on Regional Comparison - North America
Data Table on Regional Comparison - North America

12.4.1 US - Market size and forecast 2025-2030

Chart on US - Market size and forecast 2025-2030 ($ million)
Data Table on US - Market size and forecast 2025-2030 ($ million)
Chart on US - Year-over-year growth 2025-2030 (%)
Data Table on US - Year-over-year growth 2025-2030 (%)

12.4.2 Canada - Market size and forecast 2025-2030

Chart on Canada - Market size and forecast 2025-2030 ($ million)
Data Table on Canada - Market size and forecast 2025-2030 ($ million)
Chart on Canada - Year-over-year growth 2025-2030 (%)
Data Table on Canada - Year-over-year growth 2025-2030 (%)

12.4.3 Mexico - Market size and forecast 2025-2030

Chart on Mexico - Market size and forecast 2025-2030 ($ million)
Data Table on Mexico - Market size and forecast 2025-2030 ($ million)
Chart on Mexico - Year-over-year growth 2025-2030 (%)
Data Table on Mexico - Year-over-year growth 2025-2030 (%)

12.5 Europe - Market size and forecast 2025-2030

Chart on Europe - Market size and forecast 2025-2030 ($ million)
Data Table on Europe - Market size and forecast 2025-2030 ($ million)
Chart on Europe - Year-over-year growth 2025-2030 (%)
Data Table on Europe - Year-over-year growth 2025-2030 (%)
Chart on Regional Comparison - Europe
Data Table on Regional Comparison - Europe

12.5.1 Germany - Market size and forecast 2025-2030

Chart on Germany - Market size and forecast 2025-2030 ($ million)
Data Table on Germany - Market size and forecast 2025-2030 ($ million)
Chart on Germany - Year-over-year growth 2025-2030 (%)
Data Table on Germany - Year-over-year growth 2025-2030 (%)

12.5.2 France - Market size and forecast 2025-2030

Chart on France - Market size and forecast 2025-2030 ($ million)
Data Table on France - Market size and forecast 2025-2030 ($ million)
Chart on France - Year-over-year growth 2025-2030 (%)
Data Table on France - Year-over-year growth 2025-2030 (%)

12.5.3 UK - Market size and forecast 2025-2030

Chart on UK - Market size and forecast 2025-2030 ($ million)
Data Table on UK - Market size and forecast 2025-2030 ($ million)
Chart on UK - Year-over-year growth 2025-2030 (%)
Data Table on UK - Year-over-year growth 2025-2030 (%)

12.5.4 Italy - Market size and forecast 2025-2030

Chart on Italy - Market size and forecast 2025-2030 ($ million)
Data Table on Italy - Market size and forecast 2025-2030 ($ million)
Chart on Italy - Year-over-year growth 2025-2030 (%)
Data Table on Italy - Year-over-year growth 2025-2030 (%)

12.5.5 Spain - Market size and forecast 2025-2030

Chart on Spain - Market size and forecast 2025-2030 ($ million)
Data Table on Spain - Market size and forecast 2025-2030 ($ million)
Chart on Spain - Year-over-year growth 2025-2030 (%)
Data Table on Spain - Year-over-year growth 2025-2030 (%)

12.5.6 Russia - Market size and forecast 2025-2030

Chart on Russia - Market size and forecast 2025-2030 ($ million)
Data Table on Russia - Market size and forecast 2025-2030 ($ million)
Chart on Russia - Year-over-year growth 2025-2030 (%)
Data Table on Russia - Year-over-year growth 2025-2030 (%)

12.6 South America - Market size and forecast 2025-2030

Chart on South America - Market size and forecast 2025-2030 ($ million)
Data Table on South America - Market size and forecast 2025-2030 ($ million)
Chart on South America - Year-over-year growth 2025-2030 (%)
Data Table on South America - Year-over-year growth 2025-2030 (%)
Chart on Regional Comparison - South America
Data Table on Regional Comparison - South America

12.6.1 Brazil - Market size and forecast 2025-2030

Chart on Brazil - Market size and forecast 2025-2030 ($ million)
Data Table on Brazil - Market size and forecast 2025-2030 ($ million)
Chart on Brazil - Year-over-year growth 2025-2030 (%)
Data Table on Brazil - Year-over-year growth 2025-2030 (%)

12.6.2 Argentina - Market size and forecast 2025-2030

Chart on Argentina - Market size and forecast 2025-2030 ($ million)
Data Table on Argentina - Market size and forecast 2025-2030 ($ million)
Chart on Argentina - Year-over-year growth 2025-2030 (%)
Data Table on Argentina - Year-over-year growth 2025-2030 (%)

12.6.3 Colombia - Market size and forecast 2025-2030

Chart on Colombia - Market size and forecast 2025-2030 ($ million)
Data Table on Colombia - Market size and forecast 2025-2030 ($ million)
Chart on Colombia - Year-over-year growth 2025-2030 (%)
Data Table on Colombia - Year-over-year growth 2025-2030 (%)

12.7 Middle East and Africa - Market size and forecast 2025-2030

Chart on Middle East and Africa - Market size and forecast 2025-2030 ($ million)
Data Table on Middle East and Africa - Market size and forecast 2025-2030 ($ million)
Chart on Middle East and Africa - Year-over-year growth 2025-2030 (%)
Data Table on Middle East and Africa - Year-over-year growth 2025-2030 (%)
Chart on Regional Comparison - Middle East and Africa
Data Table on Regional Comparison - Middle East and Africa

12.7.1 Saudi Arabia - Market size and forecast 2025-2030

Chart on Saudi Arabia - Market size and forecast 2025-2030 ($ million)
Data Table on Saudi Arabia - Market size and forecast 2025-2030 ($ million)
Chart on Saudi Arabia - Year-over-year growth 2025-2030 (%)
Data Table on Saudi Arabia - Year-over-year growth 2025-2030 (%)

12.7.2 UAE - Market size and forecast 2025-2030

Chart on UAE - Market size and forecast 2025-2030 ($ million)
Data Table on UAE - Market size and forecast 2025-2030 ($ million)
Chart on UAE - Year-over-year growth 2025-2030 (%)
Data Table on UAE - Year-over-year growth 2025-2030 (%)

12.7.3 South Africa - Market size and forecast 2025-2030

Chart on South Africa - Market size and forecast 2025-2030 ($ million)
Data Table on South Africa - Market size and forecast 2025-2030 ($ million)
Chart on South Africa - Year-over-year growth 2025-2030 (%)
Data Table on South Africa - Year-over-year growth 2025-2030 (%)

12.7.4 Turkey - Market size and forecast 2025-2030

Chart on Turkey - Market size and forecast 2025-2030 ($ million)
Data Table on Turkey - Market size and forecast 2025-2030 ($ million)
Chart on Turkey - Year-over-year growth 2025-2030 (%)
Data Table on Turkey - Year-over-year growth 2025-2030 (%)

12.7.5 Israel - Market size and forecast 2025-2030

Chart on Israel - Market size and forecast 2025-2030 ($ million)
Data Table on Israel - Market size and forecast 2025-2030 ($ million)
Chart on Israel - Year-over-year growth 2025-2030 (%)
Data Table on Israel - Year-over-year growth 2025-2030 (%)

12.8 Market opportunity by geography

Market opportunity by geography ($ million)
Data Tables on Market opportunity by geography ($ million)

13. Drivers, Challenges, and Opportunity

13.1 Market drivers

Rise in aging population is increasing market demand
Presence of premium brands is augmenting market growth
Rapid urbanization is expediting market expansion

13.2 Market challenges

Presence of counterfeit products is degrading market prosperity
Stringent regulations are hampering market growth
Price of natural or organic cosmetic products

13.3 Impact of drivers and challenges

Impact of drivers and challenges in 2025 and 2030

13.4 Market opportunities

Growing preference for organic cosmetics and cosmeceuticals
Increasing online retailing is accelerating market growth rate
Revolutionizing beauty industry with multifunctional cosmetics

14. Competitive Landscape

14.1 Overview

14.2

Overview on criticality of inputs and factors of differentiation

14.3 Landscape disruption

Overview on factors of disruption

14.4 Industry risks

Impact of key risks on business

15. Competitive Analysis

15.1 Companies profiled

Companies covered

15.2 Company ranking index

15.3 Market positioning of companies

Matrix on companies position and classification

15.4 Beiersdorf AG

Beiersdorf AG - Overview
Beiersdorf AG - Business segments
Beiersdorf AG - Key offerings
Beiersdorf AG - Segment focus
SWOT

15.5 Christian Dior SE

Christian Dior SE - Overview
Christian Dior SE - Business segments
Christian Dior SE - Key offerings
Christian Dior SE - Segment focus
SWOT

15.6 Coty Inc.

Coty Inc. - Overview
Coty Inc. - Business segments
Coty Inc. - Key news
Coty Inc. - Key offerings
Coty Inc. - Segment focus
SWOT

15.7 e.l.f. Beauty Inc.

e.l.f. Beauty Inc. - Overview
e.l.f. Beauty Inc. - Product / Service
e.l.f. Beauty Inc. - Key offerings
SWOT

15.8 Kao Corp.

Kao Corp. - Overview
Kao Corp. - Business segments
Kao Corp. - Key news
Kao Corp. - Key offerings
Kao Corp. - Segment focus
SWOT

15.9 LG Household and Health Care Ltd.

LG Household and Health Care Ltd. - Overview
LG Household and Health Care Ltd. - Business segments
LG Household and Health Care Ltd. - Key offerings
LG Household and Health Care Ltd. - Segment focus
SWOT

15.10 Loreal SA

Loreal SA - Overview
Loreal SA - Business segments
Loreal SA - Key offerings
Loreal SA - Segment focus
SWOT

15.11 Mary Kay Inc.

Mary Kay Inc. - Overview
Mary Kay Inc. - Product / Service
Mary Kay Inc. - Key offerings
SWOT

15.12 Natura and Co. Holding SA

Natura and Co. Holding SA - Overview
Natura and Co. Holding SA - Business segments
Natura and Co. Holding SA - Key offerings
Natura and Co. Holding SA - Segment focus
SWOT

15.13 Procter and Gamble Co.

Procter and Gamble Co. - Overview
Procter and Gamble Co. - Business segments
Procter and Gamble Co. - Key news
Procter and Gamble Co. - Key offerings
Procter and Gamble Co. - Segment focus
SWOT

15.14 Revlon Inc.

Revlon Inc. - Overview
Revlon Inc. - Product / Service
Revlon Inc. - Key offerings
SWOT

15.15 Shiseido Co. Ltd.

Shiseido Co. Ltd. - Overview
Shiseido Co. Ltd. - Business segments
Shiseido Co. Ltd. - Key offerings
Shiseido Co. Ltd. - Segment focus
SWOT

15.16 The Body Shop International

The Body Shop International - Overview
The Body Shop International - Product / Service
The Body Shop International - Key offerings
SWOT

15.17 The Estee Lauder Co. Inc.

The Estee Lauder Co. Inc. - Overview
The Estee Lauder Co. Inc. - Business segments
The Estee Lauder Co. Inc. - Key offerings
The Estee Lauder Co. Inc. - Segment focus
SWOT

15.18 Unilever PLC

Unilever PLC - Overview
Unilever PLC - Business segments
Unilever PLC - Key news
Unilever PLC - Key offerings
Unilever PLC - Segment focus
SWOT

16. Appendix

16.1 Scope of the report

Market definition
Objectives
Notes and caveats

16.2 Inclusions and exclusions checklist

Inclusions checklist
Exclusions checklist

16.3 Currency conversion rates for US$

16.4 Research methodology

16.5 Data procurement

Information sources

16.6 Data validation

16.7 Validation techniques employed for market sizing

16.8 Data synthesis

16.9 360 degree market analysis

16.10 List of abbreviations

Research Methodology

Technavio presents a detailed picture of the market by way of study, synthesis, and summation of data from multiple sources. The analysts have presented the various facets of the market with a particular focus on identifying the key industry influencers. The data thus presented is comprehensive, reliable, and the result of extensive research, both primary and secondary.

INFORMATION SOURCES

Primary sources

  • Manufacturers and suppliers
  • Channel partners
  • Industry experts
  • Strategic decision makers

Secondary sources

  • Industry journals and periodicals
  • Government data
  • Financial reports of key industry players
  • Historical data
  • Press releases

DATA ANALYSIS

Data Synthesis

  • Collation of data
  • Estimation of key figures
  • Analysis of derived insights

Data Validation

  • Triangulation with data models
  • Reference against proprietary databases
  • Corroboration with industry experts

REPORT WRITING

Qualitative

  • Market drivers
  • Market challenges
  • Market trends
  • Five forces analysis

Quantitative

  • Market size and forecast
  • Market segmentation
  • Geographical insights
  • Competitive landscape

Interested in this report?

Get your sample now to see our research methodology and insights!

Download Now

Frequently Asked Questions

Cosmetic Products market growth will increase by USD 129509.8 million during 2026-2030.

The Cosmetic Products market is expected to grow at a CAGR of 5.6% during 2026-2030.

Cosmetic Products market is segmented by Product (Skincare products, Haircare products, Color cosmetics, Fragrances and deodorants) Distribution channel (Offline, Online) Type (Organic, Conventional)

AMOREPACIFIC Group Inc., Avon Products Inc., Beiersdorf AG, Christian Dior SE, Coty Inc., e.l.f. Beauty Inc., Huda Beauty Ltd., Kao Corp., LG Household and Health Care Ltd., Loreal SA, Mary Kay Inc., Natura and Co. Holding SA, Oriflame Cosmetics SA, Pat McGrath, Procter and Gamble Co., Revlon Inc., Shiseido Co. Ltd., The Body Shop International, The Estee Lauder Co. Inc., Unilever PLC are a few of the key vendors in the Cosmetic Products market.

APAC will register the highest growth rate of 49.3% among the other regions. Therefore, the Cosmetic Products market in APAC is expected to garner significant business opportunities for the vendors during the forecast period.

China, Japan, India, South Korea, Indonesia, Australia, US, Canada, Mexico, Germany, France, UK, Italy, Spain, Russia, Brazil, Argentina, Colombia, Saudi Arabia, UAE, South Africa, Turkey, Israel

  • Rise in aging population is increasing market demand is the driving factor this market.

The Cosmetic Products market vendors should focus on grabbing business opportunities from the Product segment as it accounted for the largest market share in the base year.
RIA - Research AI Assistant
Ask RIA