Corporate Blended Learning Market Analysis, Size, and Forecast 2026-2030: North America (US, Canada, and Mexico), Europe (UK, Germany, and France), APAC (China, Japan, and India), South America (Brazil and Argentina), Middle East and Africa (UAE, Saudi Arabia, and South Africa), and Rest of World (ROW)

Corporate Blended Learning Market Analysis, Size, and Forecast 2026-2030:
North America (US, Canada, and Mexico), Europe (UK, Germany, and France), APAC (China, Japan, and India), South America (Brazil and Argentina), Middle East and Africa (UAE, Saudi Arabia, and South Africa), and Rest of World (ROW)

Published: May 2026 305 Pages SKU: IRTNTR40430

Market Overview at a Glance

$74.64 B
Market Opportunity
16.6%
CAGR 2025 - 2030
48.2%
North America Growth
$21.43 B
Systems segment 2024

Corporate Blended Learning Market Size 2026-2030

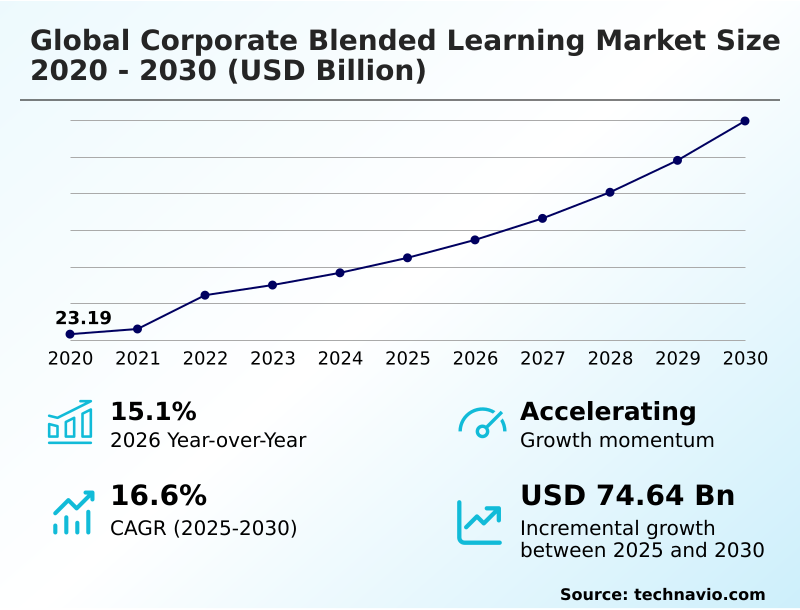
The Corporate Blended Learning Market size was valued at USD 64.83 billion in 2025, growing at a CAGR of 16.6% during the forecast period 2026-2030.

Major Market Trends & Insights

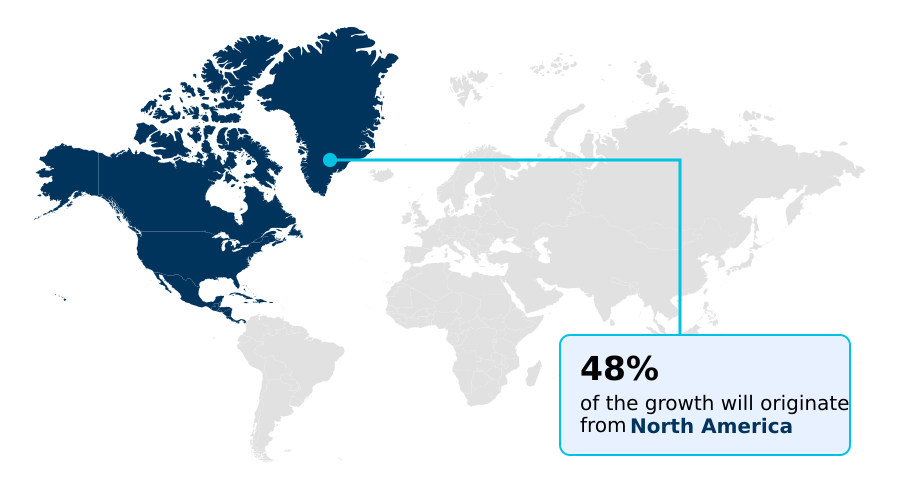
  • North America dominated the market and accounted for a 48.2% growth during the forecast period.
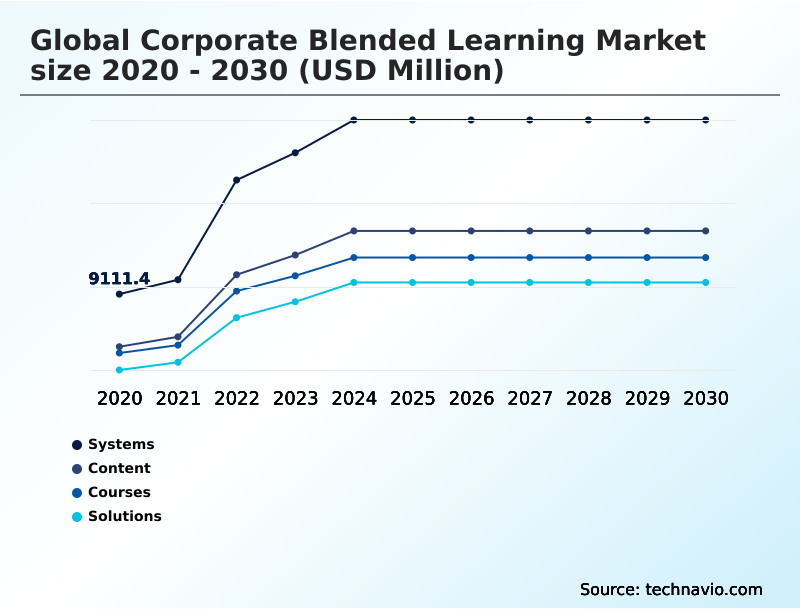
  • By Type - Systems segment was valued at USD 21.43 billion in 2024
  • By End-user - Automotive industry segment accounted for the largest market revenue share in 2024

Market Size & Forecast

  • Historic Market Opportunities 2020-2024: USD 116.29 billion
  • Market Future Opportunities 2025-2030: USD 74.64 billion
  • CAGR from 2025 to 2030 : 16.6%

Market Summary

  • The corporate blended learning market is defined by a strategic pivot toward performance-driven training, with organizations reporting a 30% improvement in employee engagement when learning is tied to career development. The adoption of AI-first architectures is a primary driver, enabling the shift from static content libraries to dynamic, hyper-personalized skill acquisition at scale.
  • For instance, a multinational manufacturing firm can deploy a blended program using virtual reality for hands-on safety training and AI-powered modules for theory, reducing on-site accidents by 15%. However, this progress is challenged by the technical debt of legacy systems, which creates data silos that hinder the effectiveness of advanced analytics and AI.
  • Enterprises are thus prioritizing the consolidation of fragmented learning tools into unified ecosystems to unlock the full potential of data-driven professional development.

What will be the Size of the Corporate Blended Learning Market during the forecast period?

Get Key Insights on Market Forecast (PDF) Request Free Sample

How is the Corporate Blended Learning Market Segmented?

The corporate blended learning industry research report provides comprehensive data (region-wise segment analysis), with forecasts and analysis for the period 2026-2030, as well as historical data from 2020-2024 for the following segments.

  • Type
    • Systems
    • Content
    • Courses
    • Solutions
  • End-user
    • Automotive industry
    • BFSI sector
    • Consumer goods industry
    • Energy industry
    • Others
  • Methodology
    • Instructor-led training
    • Self-paced online learning
    • Collaborative learning
    • Experiential learning
  • Geography
    • North America
      • US
      • Canada
      • Mexico
    • Europe
      • UK
      • Germany
      • France
    • APAC
      • China
      • Japan
      • India
    • South America
      • Brazil
      • Argentina
    • Middle East and Africa
      • UAE
      • Saudi Arabia
      • South Africa
    • Rest of World (ROW)

How is the Corporate Blended Learning Market Segmented by Type?

The systems segment is estimated to witness significant growth during the forecast period.

The systems segment of the corporate blended learning market is shifting from static Learning Management Systems to dynamic Learning Experience Platforms, improving content discovery relevance by over 40%.

These AI-first architectures are crucial for workforce agility, automating tasks like content curation and skills gap analysis through a central skills ontology.

This evolution enables a more effective blended learning strategy, where organizations report a 25% faster time-to-competency for new hires. The integration of generative AI within these systems facilitates decentralized content creation, allowing subject-matter experts to produce high-quality microlearning modules.

This move toward an intelligent, interconnected learning ecosystem supports continuous professional development by embedding training directly into workflow interoperability tools, making asynchronous learning more impactful.

Request Free Sample

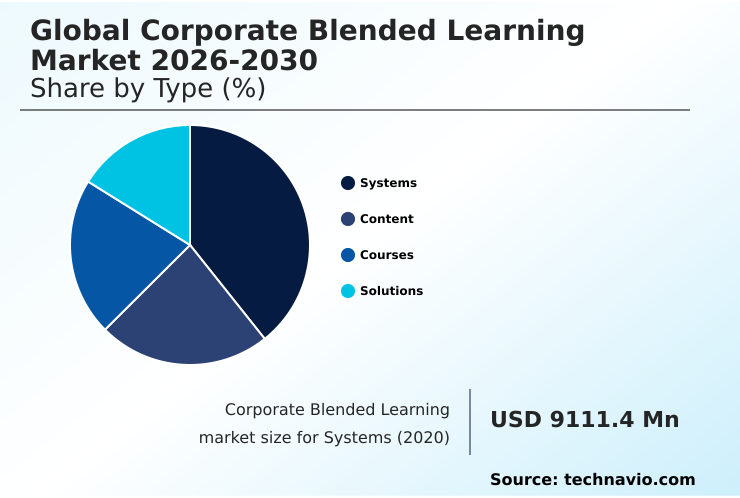
The Systems segment was valued at USD 21.43 billion in 2024 and showed a gradual increase during the forecast period.

Request Free Sample

How demand for the Corporate Blended Learning market is rising in the leading region?

North America is estimated to contribute 48.2% to the growth of the global market during the forecast period.Technavio’s analysts have elaborately explained the regional trends and drivers that shape the market during the forecast period.

See How Corporate Blended Learning Market demand is rising in North America Request Free Sample

The geographic landscape of the corporate blended learning market shows a clear division in maturity and focus, with North America commanding 48.17% of the market share, driven by high adoption of advanced AI-driven platforms.

In this region, particularly the US, the focus is on integrating learning into the flow of work to boost productivity, with enterprises investing in sophisticated talent intelligence systems.

In contrast, the APAC region, which accounts for 16.38% of the market, is characterized by mobile-first adoption and explosive growth in upskilling for the digital economy.

The difference in infrastructure and workforce dynamics means that while a North American company might deploy a complex industrial metaverse simulation, an APAC-based firm is more likely to utilize lightweight, mobile learning platforms for training, reflecting a more than 50% higher reliance on mobile devices for professional development.

What are the key Drivers, Trends, and Challenges in the Corporate Blended Learning Market?

Our researchers analyzed the data with 2025 as the base year, along with the key drivers, trends, and challenges. A holistic analysis of drivers will help companies refine their marketing strategies to gain a competitive advantage.

  • Enterprises are increasingly realizing the strategic importance of learning, moving beyond mere compliance to data-driven talent development. A key consideration is the impact of generative AI on instructional design, which has been shown to reduce content creation time by up to 50% while improving the relevance of materials.
  • This technological shift is central to the discussion around measuring ROI of blended learning programs, as efficiency gains become more quantifiable. The most effective approach involves integrating LMS with internal talent mobility platforms, creating a seamless ecosystem where skill acquisition directly translates to career opportunities.
  • This strategy answers the challenge of corporate blended learning for skills-based organizations by creating clear pathways for advancement. However, the lynchpin remains a robust framework for AI governance in corporate training solutions, ensuring that the use of these powerful tools is ethical, transparent, and compliant.
  • Organizations that successfully navigate this complexity can achieve an over 2x improvement in employee retention compared to those with disjointed learning and development efforts.

What are the key market drivers leading to the rise in the adoption of Corporate Blended Learning Industry?

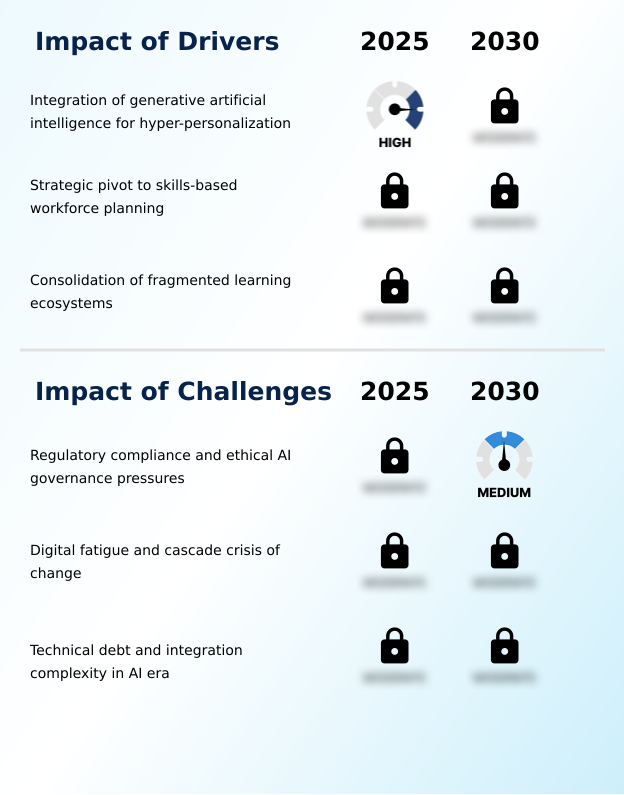
  • The integration of generative artificial intelligence for hyper-personalization is the primary driver expanding the capabilities and adoption of corporate blended learning solutions.

  • The primary driver for the corporate blended learning market is the strategic pivot to skills-based organizations, a model that has been shown to improve workforce agility by up to 50%.
  • This transition creates a surge in demand for platforms that offer robust talent intelligence and can map learning to career progression, directly impacting employee retention.
  • A second critical driver is the aggressive integration of generative AI for hyper-personalization, which automates content curation and makes asynchronous learning as responsive as live instruction, improving learner engagement rates by over 30%.
  • Finally, the operational need to consolidate fragmented learning infrastructures into unified, cloud-based delivery models is pushing enterprises to invest in modern Learning Experience Platforms. This consolidation supports better data hygiene, which is a prerequisite for deploying effective learning analytics.

What are the market trends shaping the Corporate Blended Learning Industry?

  • The market is witnessing a transformative trend with the emergence of agentic AI, which is enabling fully automated instructional design and content creation.

  • A transformative trend in corporate blended learning is the convergence of learning management systems with internal talent mobility, where organizations with integrated platforms report a 25% increase in internal hiring. This shift is enabled by the adoption of a unified skills ontology.
  • The market is also seeing the integration of the industrial metaverse and spatial computing for technical training, particularly in manufacturing and energy sectors, where using digital twin technology in a risk-free environment has been shown to reduce training-related accidents by over 40%.
  • The evolution toward agentic AI is automating complex instructional design tasks, moving the learning ecosystem from a passive content repository to an active, intelligent co-pilot. This use of AI-first architecture for peer-to-peer knowledge sharing and workforce competency models redefines how organizations approach upskilling and reskilling.

What challenges does the Corporate Blended Learning Industry face during its growth?

  • Regulatory compliance requirements and pressures for ethical AI governance present a significant challenge, impacting the design and deployment of modern learning platforms.

  • A primary challenge restructuring the corporate blended learning market is the intense pressure to align with new data privacy regulations and AI governance frameworks, which can increase compliance-related overhead by up to 20%. This legal scrutiny creates a significant barrier to entry for smaller vendors.
  • A second major challenge is digital tool fatigue and change saturation within the workforce, with studies showing that over 80% of employees feel overwhelmed by new technology deployments, which directly undermines engagement with new learning initiatives. This phenomenon of a cascade crisis limits the ROI of even the most advanced platforms.
  • Finally, the technical debt from legacy systems creates significant integration complexity, as outdated data structures hinder the functionality of modern AI agents and experiential learning modules, creating a 'garbage in, garbage out' scenario.

Exclusive Technavio Analysis on Customer Landscape

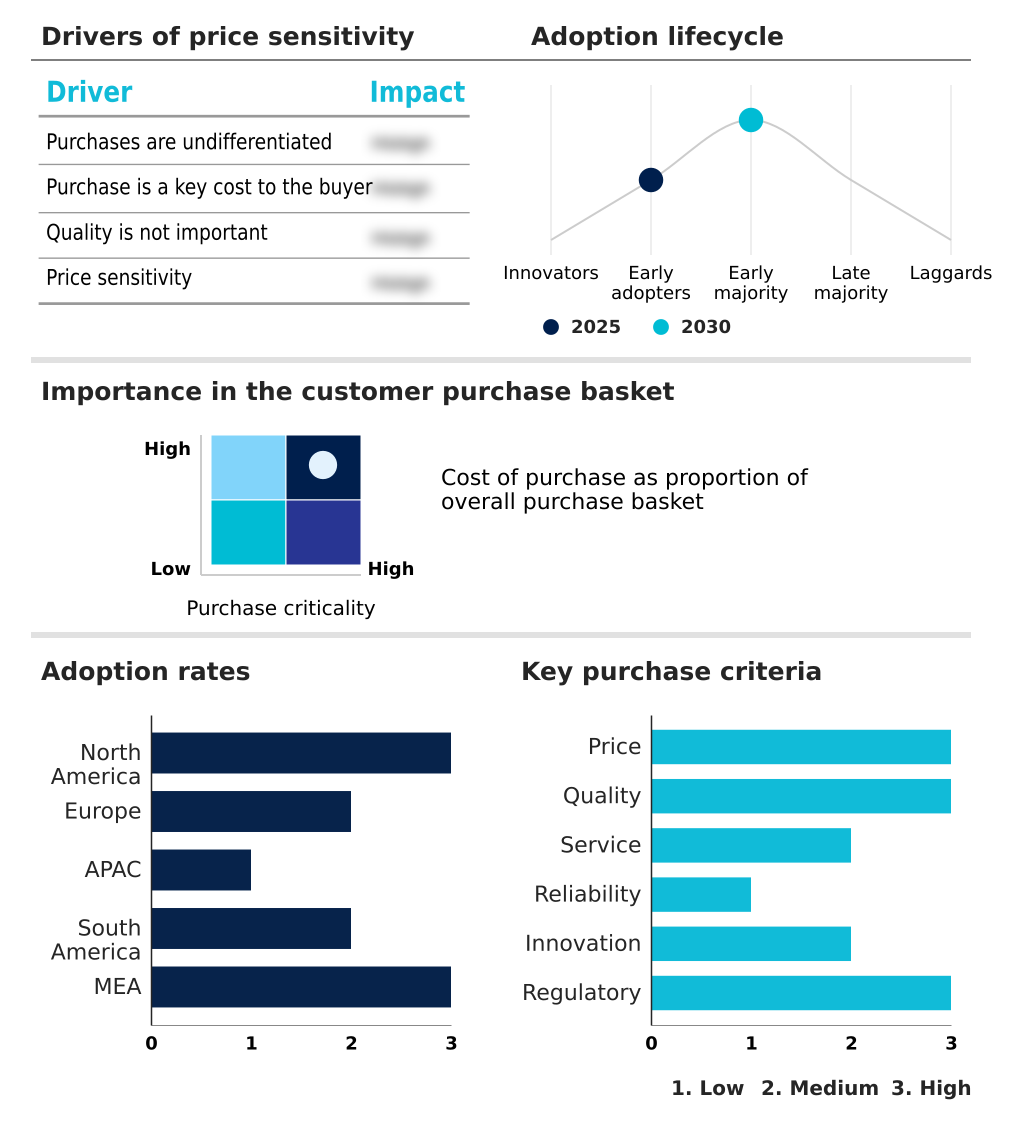
The corporate blended learning market forecasting report includes the adoption lifecycle of the market, covering from the innovator’s stage to the laggard’s stage. It focuses on adoption rates in different regions based on penetration. Furthermore, the corporate blended learning market report also includes key purchase criteria and drivers of price sensitivity to help companies evaluate and develop their market growth analysis strategies.

Customer Landscape of Corporate Blended Learning Industry

Competitive Landscape

Companies are implementing various strategies, such as strategic alliances, corporate blended learning market forecast, partnerships, mergers and acquisitions, geographical expansion, and product/service launches, to enhance their presence in the industry.

Allen Communication Learning Services - Key offerings include AI-driven corporate learning platforms, custom solutions for workforce capability, and strategic consulting for developing leadership and productivity skills.

The industry research and growth report includes detailed analyses of the competitive landscape of the market and information about key companies, including:

  • Allen Communication Learning Services
  • BTS Group AB
  • Cegos Group
  • City and Guilds Group
  • Cornerstone OnDemand Inc.
  • D2L Corp.
  • Docebo Inc.
  • Franklin Covey Co.
  • GBS Corporate Training
  • GP Strategies Corp.
  • Interaction Associates Inc.
  • Korn Ferry
  • Learning Technologies Group
  • SAP SE
  • Skillsoft Corp.
  • Udemy Inc.
  • Wilson Learning Worldwide Inc.

Qualitative and quantitative analysis of companies has been conducted to help clients understand the wider business environment as well as the strengths and weaknesses of key industry players. Data is qualitatively analyzed to categorize companies as pure play, category-focused, industry-focused, and diversified; it is quantitatively analyzed to categorize companies as dominant, leading, strong, tentative, and weak.

Market Intelligence Radar: High-Impact Developments & Growth Signals

  • In the Education Services industry, the enterprise-wide adoption of AI-first architectures is compelling a shift toward learning platforms with built-in generative AI and automated instructional design, directly increasing demand for sophisticated corporate blended learning solutions that support hyper-personalization.
  • The formalization of AI governance frameworks, including data privacy regulations, is forcing a re-evaluation of learning technologies, creating a market preference for certified corporate blended learning platforms that ensure compliance and ethical AI use in employee training.
  • A strategic pivot in workforce management toward skills-based organizations is increasing the need for corporate blended learning systems that integrate with talent mobility and performance management tools, linking continuous professional development directly to career progression.
  • The consolidation of fragmented digital ecosystems within enterprises is driving investment in unified corporate blended learning suites that offer a single source of truth for learner data, improving analytics and enabling the effective deployment of AI-driven talent intelligence.

Dive into Technavio’s robust research methodology, blending expert interviews, extensive data synthesis, and validated models for unparalleled Corporate Blended Learning Market insights. See full methodology.

Market Scope
Page number 305
Base year 2025
Historic period 2020-2024
Forecast period 2026-2030
Growth momentum & CAGR Accelerate at a CAGR of 16.6%
Market growth 2026-2030 USD 74644.1 million
Market structure Fragmented
YoY growth 2025-2026(%) 15.1%
Key countries US, Canada, Mexico, UK, Germany, France, Italy, Spain, The Netherlands, China, Japan, India, South Korea, Australia, Indonesia, Brazil, Argentina, Chile, UAE, Saudi Arabia, South Africa, Turkey and Egypt
Competitive landscape Leading Companies, Market Positioning of Companies, Competitive Strategies, and Industry Risks

Request Free Sample

Research Analyst Overview

  • The corporate blended learning market ecosystem is a complex network of interacting stakeholders, with technology providers of AI engines and cloud infrastructure forming the foundational layer, enabling over 70% of modern learning platforms. Solution providers, including LMS and LXP vendors, operate at the core, integrating content libraries, authoring tools, and analytics into unified suites.
  • These vendors work closely with a diverse range of content creators and strategic consulting firms to deliver end-to-end training solutions. Regulatory bodies exert significant influence, particularly around data privacy and AI governance, shaping platform design and data handling protocols. Distribution is increasingly direct via cloud-based subscription models, targeting enterprise L&D departments.
  • End-users in sectors like BFSI and automotive drive demand for specialized compliance and technical training, influencing over 40% of content development priorities.

What are the Key Data Covered in this Corporate Blended Learning Market Research and Growth Report?

  • What is the expected growth of the Corporate Blended Learning Market between 2026 and 2030?

    • The Corporate Blended Learning Market is expected to grow by USD 74.64 billion during 2026-2030, registering a CAGR of 16.6%. Year-over-year growth in 2026 is estimated at 15.1%%. This acceleration is shaped by integration of generative artificial intelligence for hyper-personalization, which is intensifying demand across multiple end-use verticals covered in the report.

  • What segmentation does the market report cover?

    • The report is segmented by Type (Systems, Content, Courses, and Solutions), End-user (Automotive industry, BFSI sector, Consumer goods industry, Energy industry, and Others), Methodology (Instructor-led training, Self-paced online learning, Collaborative learning, and Experiential learning) and Geography (North America, Europe, APAC, South America, Middle East and Africa). Among these, the Systems segment is estimated to witness significant growth during the forecast period, driven by rising adoption across key application areas. Each segment includes detailed qualitative and quantitative analysis, along with historical data from 2020-2024 and forecasts through 2030 with year-over-year growth rates.

  • Which regions are analyzed in the report?

    • The report covers North America, Europe, APAC, South America and Middle East and Africa. North America is estimated to contribute 48.2% to market growth during the forecast period. Country-level analysis includes US, Canada, Mexico, UK, Germany, France, Italy, Spain, The Netherlands, China, Japan, India, South Korea, Australia, Indonesia, Brazil, Argentina, Chile, UAE, Saudi Arabia, South Africa, Turkey and Egypt, with dedicated market size tables and year-over-year growth for each.

  • What are the key growth drivers and market challenges?

    • The primary driver is integration of generative artificial intelligence for hyper-personalization, which is accelerating investment and industry demand. The main challenge is regulatory compliance and ethical ai governance pressures, creating operational barriers for key market participants. The report quantifies the impact of each driver and challenge across 2026 and 2030 with comparative analysis.

  • Who are the major players in the Corporate Blended Learning Market?

    • Key vendors include Allen Communication Learning Services, BTS Group AB, Cegos Group, City and Guilds Group, Cornerstone OnDemand Inc., D2L Corp., Docebo Inc., Franklin Covey Co., GBS Corporate Training, GP Strategies Corp., Interaction Associates Inc., Korn Ferry, Learning Technologies Group, SAP SE, Skillsoft Corp., Udemy Inc. and Wilson Learning Worldwide Inc.. The report provides qualitative and quantitative analysis categorizing companies as dominant, leading, strong, tentative, and weak based on their market positioning. Company profiles include business segment analysis, SWOT assessment, key offerings, and recent strategic developments.

Market Research Insights

  • The competitive landscape for corporate blended learning is intensifying, with vendors differentiating through AI innovation and ecosystem integration, where unified platforms show 35% higher adoption than fragmented solutions. Key players are aggressively moving beyond traditional LMS functionalities to offer comprehensive talent lifecycle management.
  • Recent developments show a focus on skills intelligence, with platforms now able to map learning content to specific career pathways, reportedly improving internal mobility by over 20%. For example, vendors are introducing features like generative AI content creators and AI-powered coaching tools to enhance both learner engagement and administrative efficiency.
  • These actions address the enterprise demand for measurable ROI on training investments, as companies navigate the challenge of upskilling their workforce for a digital-first economy while managing significant organizational change saturation.

We can help! Our analysts can customize this corporate blended learning market research report to meet your requirements.

Get in touch

1. Executive Summary

1.1 Market overview

Executive Summary - Chart on Market Overview
Executive Summary - Data Table on Market Overview
Executive Summary - Chart on Global Market Characteristics
Executive Summary - Chart on Market by Geography
Executive Summary - Chart on Market Segmentation by Type
Executive Summary - Chart on Market Segmentation by End-user
Executive Summary - Chart on Market Segmentation by Methodology
Executive Summary - Chart on Incremental Growth
Executive Summary - Data Table on Incremental Growth
Executive Summary - Chart on Company Market Positioning

2. Technavio Analysis

2.1 Analysis of price sensitivity, lifecycle, customer purchase basket, adoption rates, and purchase criteria

2.2 Criticality of inputs and Factors of differentiation

Chart on Overview on criticality of inputs and factors of differentiation

2.3 Factors of disruption

Chart on Overview on factors of disruption

2.4 Impact of drivers and challenges

Chart on Impact of drivers and challenges in 2025 and 2030

3. Market Landscape

3.1 Market ecosystem

Chart on Parent Market
Data Table on - Parent Market

3.2 Market characteristics

Chart on Market characteristics analysis

3.3 Value chain analysis

Chart on Value chain analysis

4. Market Sizing

4.1 Market definition

Data Table on Offerings of companies included in the market definition

4.2 Market segment analysis

Market segments

4.3 Market size 2025

4.4 Market outlook: Forecast for 2025-2030

Chart on Global - Market size and forecast 2025-2030 ($ million)
Data Table on Global - Market size and forecast 2025-2030 ($ million)
Chart on Global Market: Year-over-year growth 2025-2030 (%)
Data Table on Global Market: Year-over-year growth 2025-2030 (%)

5. Historic Market Size

5.1 Global Corporate Blended Learning Market 2020 - 2024

Historic Market Size - Data Table on Global Corporate Blended Learning Market 2020 - 2024 ($ million)

5.2 Type segment analysis 2020 - 2024

Historic Market Size - Type Segment 2020 - 2024 ($ million)

5.3 End-user segment analysis 2020 - 2024

Historic Market Size - End-user Segment 2020 - 2024 ($ million)

5.4 Methodology segment analysis 2020 - 2024

Historic Market Size - Methodology Segment 2020 - 2024 ($ million)

5.5 Geography segment analysis 2020 - 2024

Historic Market Size - Geography Segment 2020 - 2024 ($ million)

5.6 Country segment analysis 2020 - 2024

Historic Market Size - Country Segment 2020 - 2024 ($ million)

6. Qualitative Analysis

6.1 Impact of AI on the Global Corporate Blended Learning Market

7. Five Forces Analysis

7.1 Five forces summary

Five forces analysis - Comparison between 2025 and 2030

7.2 Bargaining power of buyers

Bargaining power of buyers - Impact of key factors 2025 and 2030

7.3 Bargaining power of suppliers

Bargaining power of suppliers - Impact of key factors in 2025 and 2030

7.4 Threat of new entrants

Threat of new entrants - Impact of key factors in 2025 and 2030

7.5 Threat of substitutes

Threat of substitutes - Impact of key factors in 2025 and 2030

7.6 Threat of rivalry

Threat of rivalry - Impact of key factors in 2025 and 2030

7.7 Market condition

Chart on Market condition - Five forces 2025 and 2030

8. Market Segmentation by Type

8.1 Market segments

Chart on Type - Market share 2025-2030 (%)
Data Table on Type - Market share 2025-2030 (%)

8.2 Comparison by Type

Chart on Comparison by Type
Data Table on Comparison by Type

8.3 Systems - Market size and forecast 2025-2030

Chart on Systems - Market size and forecast 2025-2030 ($ million)
Data Table on Systems - Market size and forecast 2025-2030 ($ million)
Chart on Systems - Year-over-year growth 2025-2030 (%)
Data Table on Systems - Year-over-year growth 2025-2030 (%)

8.4 Content - Market size and forecast 2025-2030

Chart on Content - Market size and forecast 2025-2030 ($ million)
Data Table on Content - Market size and forecast 2025-2030 ($ million)
Chart on Content - Year-over-year growth 2025-2030 (%)
Data Table on Content - Year-over-year growth 2025-2030 (%)

8.5 Courses - Market size and forecast 2025-2030

Chart on Courses - Market size and forecast 2025-2030 ($ million)
Data Table on Courses - Market size and forecast 2025-2030 ($ million)
Chart on Courses - Year-over-year growth 2025-2030 (%)
Data Table on Courses - Year-over-year growth 2025-2030 (%)

8.6 Solutions - Market size and forecast 2025-2030

Chart on Solutions - Market size and forecast 2025-2030 ($ million)
Data Table on Solutions - Market size and forecast 2025-2030 ($ million)
Chart on Solutions - Year-over-year growth 2025-2030 (%)
Data Table on Solutions - Year-over-year growth 2025-2030 (%)

8.7 Market opportunity by Type

Market opportunity by Type ($ million)
Data Table on Market opportunity by Type ($ million)

9. Market Segmentation by End-user

9.1 Market segments

Chart on End-user - Market share 2025-2030 (%)
Data Table on End-user - Market share 2025-2030 (%)

9.2 Comparison by End-user

Chart on Comparison by End-user
Data Table on Comparison by End-user

9.3 Automotive industry - Market size and forecast 2025-2030

Chart on Automotive industry - Market size and forecast 2025-2030 ($ million)
Data Table on Automotive industry - Market size and forecast 2025-2030 ($ million)
Chart on Automotive industry - Year-over-year growth 2025-2030 (%)
Data Table on Automotive industry - Year-over-year growth 2025-2030 (%)

9.4 BFSI sector - Market size and forecast 2025-2030

Chart on BFSI sector - Market size and forecast 2025-2030 ($ million)
Data Table on BFSI sector - Market size and forecast 2025-2030 ($ million)
Chart on BFSI sector - Year-over-year growth 2025-2030 (%)
Data Table on BFSI sector - Year-over-year growth 2025-2030 (%)

9.5 Consumer goods industry - Market size and forecast 2025-2030

Chart on Consumer goods industry - Market size and forecast 2025-2030 ($ million)
Data Table on Consumer goods industry - Market size and forecast 2025-2030 ($ million)
Chart on Consumer goods industry - Year-over-year growth 2025-2030 (%)
Data Table on Consumer goods industry - Year-over-year growth 2025-2030 (%)

9.6 Energy industry - Market size and forecast 2025-2030

Chart on Energy industry - Market size and forecast 2025-2030 ($ million)
Data Table on Energy industry - Market size and forecast 2025-2030 ($ million)
Chart on Energy industry - Year-over-year growth 2025-2030 (%)
Data Table on Energy industry - Year-over-year growth 2025-2030 (%)

9.7 Others - Market size and forecast 2025-2030

Chart on Others - Market size and forecast 2025-2030 ($ million)
Data Table on Others - Market size and forecast 2025-2030 ($ million)
Chart on Others - Year-over-year growth 2025-2030 (%)
Data Table on Others - Year-over-year growth 2025-2030 (%)

9.8 Market opportunity by End-user

Market opportunity by End-user ($ million)
Data Table on Market opportunity by End-user ($ million)

10. Market Segmentation by Methodology

10.1 Market segments

Chart on Methodology - Market share 2025-2030 (%)
Data Table on Methodology - Market share 2025-2030 (%)

10.2 Comparison by Methodology

Chart on Comparison by Methodology
Data Table on Comparison by Methodology

10.3 Instructor-led training - Market size and forecast 2025-2030

Chart on Instructor-led training - Market size and forecast 2025-2030 ($ million)
Data Table on Instructor-led training - Market size and forecast 2025-2030 ($ million)
Chart on Instructor-led training - Year-over-year growth 2025-2030 (%)
Data Table on Instructor-led training - Year-over-year growth 2025-2030 (%)

10.4 Self-paced online learning - Market size and forecast 2025-2030

Chart on Self-paced online learning - Market size and forecast 2025-2030 ($ million)
Data Table on Self-paced online learning - Market size and forecast 2025-2030 ($ million)
Chart on Self-paced online learning - Year-over-year growth 2025-2030 (%)
Data Table on Self-paced online learning - Year-over-year growth 2025-2030 (%)

10.5 Collaborative learning - Market size and forecast 2025-2030

Chart on Collaborative learning - Market size and forecast 2025-2030 ($ million)
Data Table on Collaborative learning - Market size and forecast 2025-2030 ($ million)
Chart on Collaborative learning - Year-over-year growth 2025-2030 (%)
Data Table on Collaborative learning - Year-over-year growth 2025-2030 (%)

10.6 Experiential learning - Market size and forecast 2025-2030

Chart on Experiential learning - Market size and forecast 2025-2030 ($ million)
Data Table on Experiential learning - Market size and forecast 2025-2030 ($ million)
Chart on Experiential learning - Year-over-year growth 2025-2030 (%)
Data Table on Experiential learning - Year-over-year growth 2025-2030 (%)

10.7 Market opportunity by Methodology

Market opportunity by Methodology ($ million)
Data Table on Market opportunity by Methodology ($ million)

11. Customer Landscape

11.1 Customer landscape overview

Analysis of price sensitivity, lifecycle, customer purchase basket, adoption rates, and purchase criteria

12. Geographic Landscape

12.1 Geographic segmentation

Chart on Market share by geography 2025-2030 (%)
Data Table on Market share by geography 2025-2030 (%)

12.2 Geographic comparison

Chart on Geographic comparison
Data Table on Geographic comparison

12.3 North America - Market size and forecast 2025-2030

Chart on North America - Market size and forecast 2025-2030 ($ million)
Data Table on North America - Market size and forecast 2025-2030 ($ million)
Chart on North America - Year-over-year growth 2025-2030 (%)
Data Table on North America - Year-over-year growth 2025-2030 (%)
Chart on Regional Comparison - North America
Data Table on Regional Comparison - North America

12.3.1 US - Market size and forecast 2025-2030

Chart on US - Market size and forecast 2025-2030 ($ million)
Data Table on US - Market size and forecast 2025-2030 ($ million)
Chart on US - Year-over-year growth 2025-2030 (%)
Data Table on US - Year-over-year growth 2025-2030 (%)

12.3.2 Canada - Market size and forecast 2025-2030

Chart on Canada - Market size and forecast 2025-2030 ($ million)
Data Table on Canada - Market size and forecast 2025-2030 ($ million)
Chart on Canada - Year-over-year growth 2025-2030 (%)
Data Table on Canada - Year-over-year growth 2025-2030 (%)

12.3.3 Mexico - Market size and forecast 2025-2030

Chart on Mexico - Market size and forecast 2025-2030 ($ million)
Data Table on Mexico - Market size and forecast 2025-2030 ($ million)
Chart on Mexico - Year-over-year growth 2025-2030 (%)
Data Table on Mexico - Year-over-year growth 2025-2030 (%)

12.4 Europe - Market size and forecast 2025-2030

Chart on Europe - Market size and forecast 2025-2030 ($ million)
Data Table on Europe - Market size and forecast 2025-2030 ($ million)
Chart on Europe - Year-over-year growth 2025-2030 (%)
Data Table on Europe - Year-over-year growth 2025-2030 (%)
Chart on Regional Comparison - Europe
Data Table on Regional Comparison - Europe

12.4.1 UK - Market size and forecast 2025-2030

Chart on UK - Market size and forecast 2025-2030 ($ million)
Data Table on UK - Market size and forecast 2025-2030 ($ million)
Chart on UK - Year-over-year growth 2025-2030 (%)
Data Table on UK - Year-over-year growth 2025-2030 (%)

12.4.2 Germany - Market size and forecast 2025-2030

Chart on Germany - Market size and forecast 2025-2030 ($ million)
Data Table on Germany - Market size and forecast 2025-2030 ($ million)
Chart on Germany - Year-over-year growth 2025-2030 (%)
Data Table on Germany - Year-over-year growth 2025-2030 (%)

12.4.3 France - Market size and forecast 2025-2030

Chart on France - Market size and forecast 2025-2030 ($ million)
Data Table on France - Market size and forecast 2025-2030 ($ million)
Chart on France - Year-over-year growth 2025-2030 (%)
Data Table on France - Year-over-year growth 2025-2030 (%)

12.4.4 Italy - Market size and forecast 2025-2030

Chart on Italy - Market size and forecast 2025-2030 ($ million)
Data Table on Italy - Market size and forecast 2025-2030 ($ million)
Chart on Italy - Year-over-year growth 2025-2030 (%)
Data Table on Italy - Year-over-year growth 2025-2030 (%)

12.4.5 Spain - Market size and forecast 2025-2030

Chart on Spain - Market size and forecast 2025-2030 ($ million)
Data Table on Spain - Market size and forecast 2025-2030 ($ million)
Chart on Spain - Year-over-year growth 2025-2030 (%)
Data Table on Spain - Year-over-year growth 2025-2030 (%)

12.4.6 The Netherlands - Market size and forecast 2025-2030

Chart on The Netherlands - Market size and forecast 2025-2030 ($ million)
Data Table on The Netherlands - Market size and forecast 2025-2030 ($ million)
Chart on The Netherlands - Year-over-year growth 2025-2030 (%)
Data Table on The Netherlands - Year-over-year growth 2025-2030 (%)

12.5 APAC - Market size and forecast 2025-2030

Chart on APAC - Market size and forecast 2025-2030 ($ million)
Data Table on APAC - Market size and forecast 2025-2030 ($ million)
Chart on APAC - Year-over-year growth 2025-2030 (%)
Data Table on APAC - Year-over-year growth 2025-2030 (%)
Chart on Regional Comparison - APAC
Data Table on Regional Comparison - APAC

12.5.1 China - Market size and forecast 2025-2030

Chart on China - Market size and forecast 2025-2030 ($ million)
Data Table on China - Market size and forecast 2025-2030 ($ million)
Chart on China - Year-over-year growth 2025-2030 (%)
Data Table on China - Year-over-year growth 2025-2030 (%)

12.5.2 Japan - Market size and forecast 2025-2030

Chart on Japan - Market size and forecast 2025-2030 ($ million)
Data Table on Japan - Market size and forecast 2025-2030 ($ million)
Chart on Japan - Year-over-year growth 2025-2030 (%)
Data Table on Japan - Year-over-year growth 2025-2030 (%)

12.5.3 India - Market size and forecast 2025-2030

Chart on India - Market size and forecast 2025-2030 ($ million)
Data Table on India - Market size and forecast 2025-2030 ($ million)
Chart on India - Year-over-year growth 2025-2030 (%)
Data Table on India - Year-over-year growth 2025-2030 (%)

12.5.4 South Korea - Market size and forecast 2025-2030

Chart on South Korea - Market size and forecast 2025-2030 ($ million)
Data Table on South Korea - Market size and forecast 2025-2030 ($ million)
Chart on South Korea - Year-over-year growth 2025-2030 (%)
Data Table on South Korea - Year-over-year growth 2025-2030 (%)

12.5.5 Australia - Market size and forecast 2025-2030

Chart on Australia - Market size and forecast 2025-2030 ($ million)
Data Table on Australia - Market size and forecast 2025-2030 ($ million)
Chart on Australia - Year-over-year growth 2025-2030 (%)
Data Table on Australia - Year-over-year growth 2025-2030 (%)

12.5.6 Indonesia - Market size and forecast 2025-2030

Chart on Indonesia - Market size and forecast 2025-2030 ($ million)
Data Table on Indonesia - Market size and forecast 2025-2030 ($ million)
Chart on Indonesia - Year-over-year growth 2025-2030 (%)
Data Table on Indonesia - Year-over-year growth 2025-2030 (%)

12.6 South America - Market size and forecast 2025-2030

Chart on South America - Market size and forecast 2025-2030 ($ million)
Data Table on South America - Market size and forecast 2025-2030 ($ million)
Chart on South America - Year-over-year growth 2025-2030 (%)
Data Table on South America - Year-over-year growth 2025-2030 (%)
Chart on Regional Comparison - South America
Data Table on Regional Comparison - South America

12.6.1 Brazil - Market size and forecast 2025-2030

Chart on Brazil - Market size and forecast 2025-2030 ($ million)
Data Table on Brazil - Market size and forecast 2025-2030 ($ million)
Chart on Brazil - Year-over-year growth 2025-2030 (%)
Data Table on Brazil - Year-over-year growth 2025-2030 (%)

12.6.2 Argentina - Market size and forecast 2025-2030

Chart on Argentina - Market size and forecast 2025-2030 ($ million)
Data Table on Argentina - Market size and forecast 2025-2030 ($ million)
Chart on Argentina - Year-over-year growth 2025-2030 (%)
Data Table on Argentina - Year-over-year growth 2025-2030 (%)

12.6.3 Chile - Market size and forecast 2025-2030

Chart on Chile - Market size and forecast 2025-2030 ($ million)
Data Table on Chile - Market size and forecast 2025-2030 ($ million)
Chart on Chile - Year-over-year growth 2025-2030 (%)
Data Table on Chile - Year-over-year growth 2025-2030 (%)

12.7 Middle East and Africa - Market size and forecast 2025-2030

Chart on Middle East and Africa - Market size and forecast 2025-2030 ($ million)
Data Table on Middle East and Africa - Market size and forecast 2025-2030 ($ million)
Chart on Middle East and Africa - Year-over-year growth 2025-2030 (%)
Data Table on Middle East and Africa - Year-over-year growth 2025-2030 (%)
Chart on Regional Comparison - Middle East and Africa
Data Table on Regional Comparison - Middle East and Africa

12.7.1 UAE - Market size and forecast 2025-2030

Chart on UAE - Market size and forecast 2025-2030 ($ million)
Data Table on UAE - Market size and forecast 2025-2030 ($ million)
Chart on UAE - Year-over-year growth 2025-2030 (%)
Data Table on UAE - Year-over-year growth 2025-2030 (%)

12.7.2 Saudi Arabia - Market size and forecast 2025-2030

Chart on Saudi Arabia - Market size and forecast 2025-2030 ($ million)
Data Table on Saudi Arabia - Market size and forecast 2025-2030 ($ million)
Chart on Saudi Arabia - Year-over-year growth 2025-2030 (%)
Data Table on Saudi Arabia - Year-over-year growth 2025-2030 (%)

12.7.3 South Africa - Market size and forecast 2025-2030

Chart on South Africa - Market size and forecast 2025-2030 ($ million)
Data Table on South Africa - Market size and forecast 2025-2030 ($ million)
Chart on South Africa - Year-over-year growth 2025-2030 (%)
Data Table on South Africa - Year-over-year growth 2025-2030 (%)

12.7.4 Turkey - Market size and forecast 2025-2030

Chart on Turkey - Market size and forecast 2025-2030 ($ million)
Data Table on Turkey - Market size and forecast 2025-2030 ($ million)
Chart on Turkey - Year-over-year growth 2025-2030 (%)
Data Table on Turkey - Year-over-year growth 2025-2030 (%)

12.7.5 Egypt - Market size and forecast 2025-2030

Chart on Egypt - Market size and forecast 2025-2030 ($ million)
Data Table on Egypt - Market size and forecast 2025-2030 ($ million)
Chart on Egypt - Year-over-year growth 2025-2030 (%)
Data Table on Egypt - Year-over-year growth 2025-2030 (%)

12.8 Market opportunity by geography

Market opportunity by geography ($ million)
Data Tables on Market opportunity by geography ($ million)

13. Drivers, Challenges, and Opportunity

13.1 Market drivers

Integration of generative artificial intelligence for hyper-personalization
Strategic pivot to skills-based workforce planning
Consolidation of fragmented learning ecosystems

13.2 Market challenges

Regulatory compliance and ethical AI governance pressures
Digital fatigue and cascade crisis of change
Technical debt and integration complexity in AI era

13.3 Impact of drivers and challenges

Impact of drivers and challenges in 2025 and 2030

13.4 Market opportunities

Emergence of agentic AI and automated instructional design
Integration of industrial metaverse into technical training
Convergence of learning management and internal talent mobility

14. Competitive Landscape

14.1 Overview

14.2

Overview on criticality of inputs and factors of differentiation

14.3 Landscape disruption

Overview on factors of disruption

14.4 Industry risks

Impact of key risks on business

15. Competitive Analysis

15.1 Companies profiled

Companies covered

15.2 Company ranking index

15.3 Market positioning of companies

Matrix on companies position and classification

15.4 Allen Communication Learning Services

Allen Communication Learning Services - Overview
Allen Communication Learning Services - Product / Service
Allen Communication Learning Services - Key offerings
SWOT

15.5 BTS Group AB

BTS Group AB - Overview
BTS Group AB - Business segments
BTS Group AB - Key offerings
BTS Group AB - Segment focus
SWOT

15.6 Cegos Group

Cegos Group - Overview
Cegos Group - Product / Service
Cegos Group - Key offerings
SWOT

15.7 City and Guilds Group

City and Guilds Group - Overview
City and Guilds Group - Product / Service
City and Guilds Group - Key offerings
SWOT

15.8 Cornerstone OnDemand Inc.

Cornerstone OnDemand Inc. - Overview
Cornerstone OnDemand Inc. - Product / Service
Cornerstone OnDemand Inc. - Key news
Cornerstone OnDemand Inc. - Key offerings
SWOT

15.9 D2L Corp.

D2L Corp. - Overview
D2L Corp. - Product / Service
D2L Corp. - Key news
D2L Corp. - Key offerings
SWOT

15.10 Docebo Inc.

Docebo Inc. - Overview
Docebo Inc. - Product / Service
Docebo Inc. - Key news
Docebo Inc. - Key offerings
SWOT

15.11 Franklin Covey Co.

Franklin Covey Co. - Overview
Franklin Covey Co. - Business segments
Franklin Covey Co. - Key offerings
Franklin Covey Co. - Segment focus
SWOT

15.12 GBS Corporate Training

GBS Corporate Training - Overview
GBS Corporate Training - Product / Service
GBS Corporate Training - Key offerings
SWOT

15.13 GP Strategies Corp.

GP Strategies Corp. - Overview
GP Strategies Corp. - Product / Service
GP Strategies Corp. - Key offerings
SWOT

15.14 Interaction Associates Inc.

Interaction Associates Inc. - Overview
Interaction Associates Inc. - Product / Service
Interaction Associates Inc. - Key offerings
SWOT

15.15 Korn Ferry

Korn Ferry - Overview
Korn Ferry - Business segments
Korn Ferry - Key news
Korn Ferry - Key offerings
Korn Ferry - Segment focus
SWOT

15.16 Learning Technologies Group

Learning Technologies Group - Overview
Learning Technologies Group - Business segments
Learning Technologies Group - Key offerings
Learning Technologies Group - Segment focus
SWOT

15.17 Skillsoft Corp.

Skillsoft Corp. - Overview
Skillsoft Corp. - Business segments
Skillsoft Corp. - Key news
Skillsoft Corp. - Key offerings
Skillsoft Corp. - Segment focus
SWOT

15.18 Udemy Inc.

Udemy Inc. - Overview
Udemy Inc. - Business segments
Udemy Inc. - Key news
Udemy Inc. - Key offerings
Udemy Inc. - Segment focus
SWOT

16. Appendix

16.1 Scope of the report

Market definition
Objectives
Notes and caveats

16.2 Inclusions and exclusions checklist

Inclusions checklist
Exclusions checklist

16.3 Currency conversion rates for US$

16.4 Research methodology

16.5 Data procurement

Information sources

16.6 Data validation

16.7 Validation techniques employed for market sizing

16.8 Data synthesis

16.9 360 degree market analysis

16.10 List of abbreviations

Research Methodology

Technavio presents a detailed picture of the market by way of study, synthesis, and summation of data from multiple sources. The analysts have presented the various facets of the market with a particular focus on identifying the key industry influencers. The data thus presented is comprehensive, reliable, and the result of extensive research, both primary and secondary.

INFORMATION SOURCES

Primary sources

  • Manufacturers and suppliers
  • Channel partners
  • Industry experts
  • Strategic decision makers

Secondary sources

  • Industry journals and periodicals
  • Government data
  • Financial reports of key industry players
  • Historical data
  • Press releases

DATA ANALYSIS

Data Synthesis

  • Collation of data
  • Estimation of key figures
  • Analysis of derived insights

Data Validation

  • Triangulation with data models
  • Reference against proprietary databases
  • Corroboration with industry experts

REPORT WRITING

Qualitative

  • Market drivers
  • Market challenges
  • Market trends
  • Five forces analysis

Quantitative

  • Market size and forecast
  • Market segmentation
  • Geographical insights
  • Competitive landscape

Interested in this report?

Get your sample now to see our research methodology and insights!

Download Now

Frequently Asked Questions

Corporate Blended Learning market growth will increase by USD 74644.1 million during 2026-2030.

The Corporate Blended Learning market is expected to grow at a CAGR of 16.6% during 2026-2030.

Corporate Blended Learning market is segmented by Type (Systems, Content, Courses, Solutions) End-user (Automotive industry, BFSI sector, Consumer goods industry, Energy industry, Others) Methodology (Instructor-led training, Self-paced online learning, Collaborative learning, Experiential learning)

Allen Communication Learning Services, BTS Group AB, Cegos Group, City and Guilds Group, Cornerstone OnDemand Inc., D2L Corp., Docebo Inc., Franklin Covey Co., GBS Corporate Training, GP Strategies Corp., Interaction Associates Inc., Korn Ferry, Learning Technologies Group, SAP SE, Skillsoft Corp., Udemy Inc., Wilson Learning Worldwide Inc. are a few of the key vendors in the Corporate Blended Learning market.

North America will register the highest growth rate of 48.2% among the other regions. Therefore, the Corporate Blended Learning market in North America is expected to garner significant business opportunities for the vendors during the forecast period.

US, Canada, Mexico, UK, Germany, France, Italy, Spain, The Netherlands, China, Japan, India, South Korea, Australia, Indonesia, Brazil, Argentina, Chile, UAE, Saudi Arabia, South Africa, Turkey, Egypt

  • Integration of generative artificial intelligence for hyper-personalization is the driving factor this market.

The Corporate Blended Learning market vendors should focus on grabbing business opportunities from the Type segment as it accounted for the largest market share in the base year.
RIA - Research AI Assistant
Ask RIA