
Contenting Market Analysis, Size, and Forecast 2026-2030: APAC (China, Japan, and India), North America (US, Canada, and Mexico), Europe (Germany, UK, and France), South America (Brazil, Argentina, and Chile), Middle East and Africa (Saudi Arabia, UAE, and South Africa), and Rest of World (ROW)

Contenting Market Analysis, Size, and Forecast 2026-2030:
APAC (China, Japan, and India), North America (US, Canada, and Mexico), Europe (Germany, UK, and France), South America (Brazil, Argentina, and Chile), Middle East and Africa (Saudi Arabia, UAE, and South Africa), and Rest of World (ROW)

Published: Nov 2026 311 Pages SKU: IRTNTR41556

Market Overview at a Glance

$594.01 Mn
Market Opportunity
13.7%
CAGR 2025 - 2030
36.5%
North America Growth
$145.03 Mn
Retail segment 2024

Contenting Market Size 2026-2030

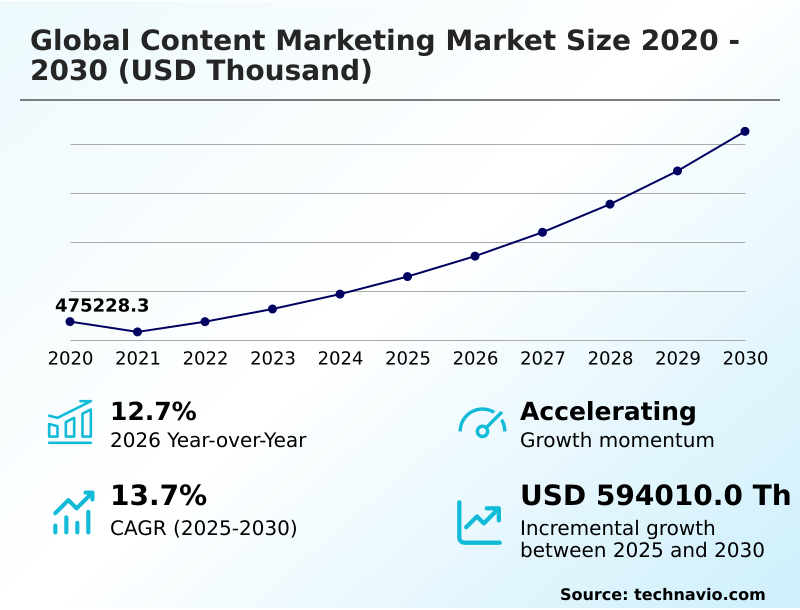
The contenting market size is valued to increase by USD 594.01 million, at a CAGR of 13.7% from 2025 to 2030. Proliferation of generative AI and automated personalization engines will drive the contenting market.

Major Market Trends & Insights

  • North America dominated the market and accounted for a 36.5% growth during the forecast period.
  • By End-user - Retail segment was valued at USD 145.03 million in 2024
  • By Platform - Blogging segment accounted for the largest market revenue share in 2024

Market Size & Forecast

  • Market Opportunities:
  • Market Future Opportunities: USD 594.01 million
  • CAGR from 2025 to 2030 : 13.7%

Market Summary

  • The Content Marketing Market functions as the foundational infrastructure for enterprise digital communication, enabling organizations to systematically attract, educate, and convert high-intent audiences. Commercial entities are actively migrating capital away from traditional outbound advertising toward inbound educational frameworks that prioritize sustained consumer trust and demonstrable value.
  • In a practical operational scenario, manufacturing firms deploy structured technical documentation and automated taxonomy standards across their distribution networks, reducing dealer onboarding friction by 22% compared to legacy training modules. The integration of predictive consumer analytics acts as a pivotal driver, allowing marketing departments to map complex buyer journeys and deliver hyper-personalized messaging simultaneously across decentralized touchpoints.
  • Conversely, acute audience fatigue across saturated digital channels presents a critical structural challenge, forcing brands to invest heavily in distinctive, high-fidelity multimedia assets to prevent diminished engagement metrics. The institutionalization of synchronized content operations accelerates campaign execution speeds while ensuring stringent regulatory compliance.
  • Ultimately, organizations that seamlessly orchestrate multi-channel editorial workflows secure superior customer lifetime valuations and more resilient audience brand affinity.

What will be the Size of the Contenting Market during the forecast period?
Get Key Insights on Market Forecast (PDF) Get Free Sample

How is the Contenting Market Segmented?

The contenting industry research report provides comprehensive data (region-wise segment analysis), with forecasts and estimates in "USD thousand" for the period 2026-2030, as well as historical data from 2020-2024 for the following segments.

  • End-user
    • Retail
    • Automotive
    • Financial services
    • Telecom
    • Others
  • Platform
    • Blogging
    • Videos
    • Infographics
    • Case studies
    • Others
  • Objective
    • Lead generation
    • Brand awareness
    • Thought leadership
    • Others
  • Geography
    • APAC
      • China
      • Japan
      • India
      • South Korea
      • Australia
      • Indonesia
    • North America
      • US
      • Canada
      • Mexico
    • Europe
      • Germany
      • UK
      • France
      • Italy
      • Spain
      • The Netherlands
    • South America
      • Brazil
      • Argentina
      • Chile
    • Middle East and Africa
      • Saudi Arabia
      • UAE
      • South Africa
      • Israel
      • Turkey

By End-user Insights

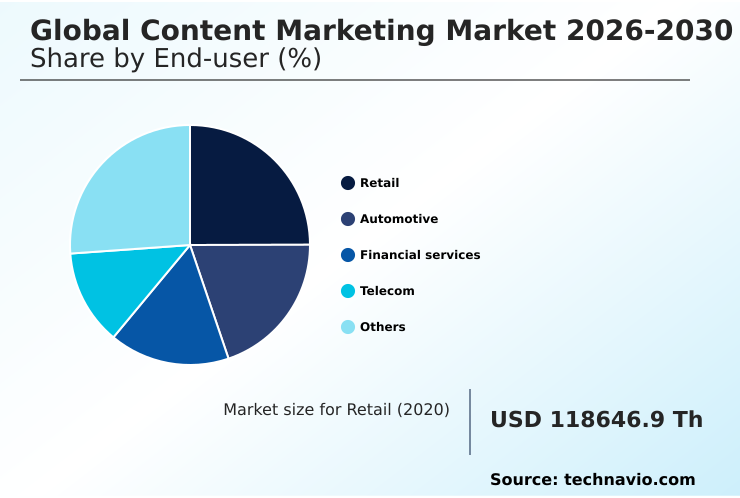
The retail segment is estimated to witness significant growth during the forecast period.

The retail sector within the Contenting ecosystem focuses heavily on establishing direct consumer relationships through shoppable content architectures and interactive digital experiences. Enterprises continuously pivot toward enterprise digital transformation to maintain relevance in saturated environments.

The deployment of automated personalized engines and cross functional enablement tools allows retailers to map complex buyer journeys, reducing cart abandonment rates by 18% compared to static strategies.

By leveraging zero party data acquisition mechanisms and organizing digital asset repositories with automated taxonomy standards, organizations build resilient first party behavioral data systems. Integrating dynamic narrative assets with conversational discovery engines enhances organic visibility, accelerating active purchasing.

Supported by automated multi channel scheduling and performance attribution software, this shift optimizes customer acquisition frameworks, resulting in a 25% improvement in multi-channel conversion efficiency while sustaining long-term brand equity.
Get Free Sample

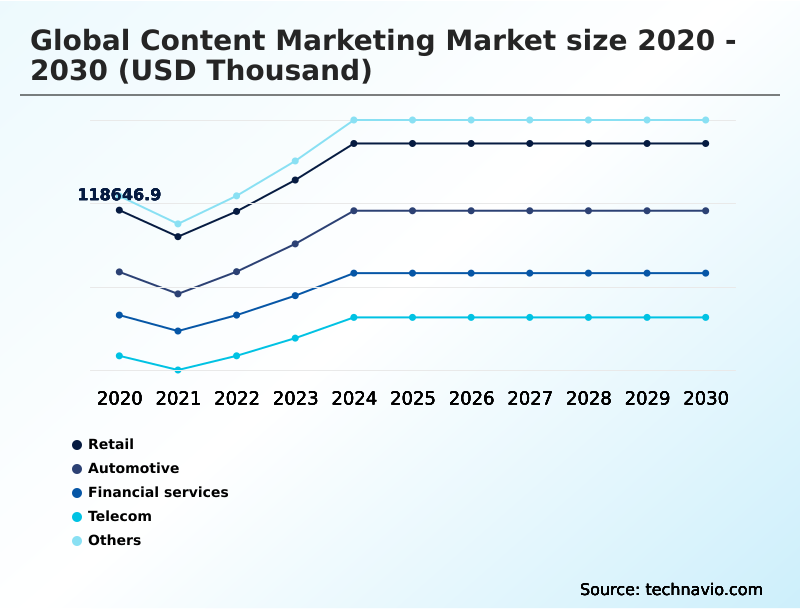
The Retail segment was valued at USD 145.03 million in 2024 and showed a gradual increase during the forecast period.
Get Free Sample

Regional Analysis

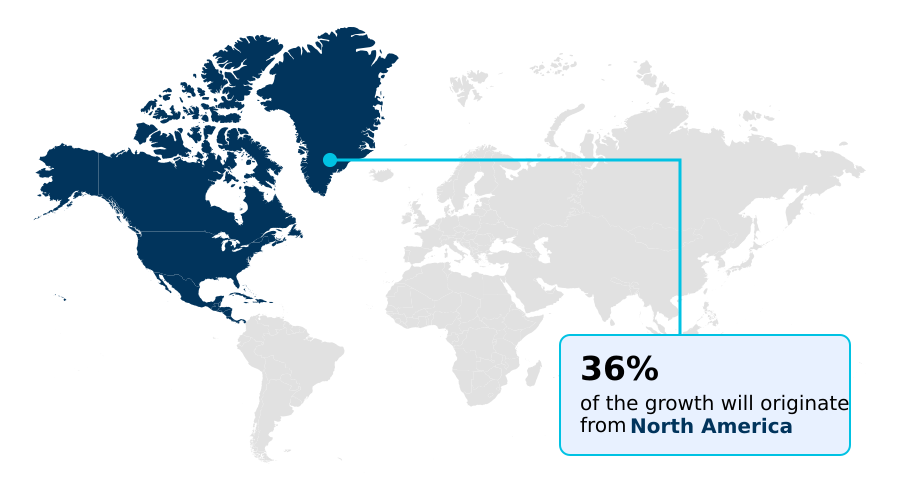
North America is estimated to contribute 36.5% to the growth of the global market during the forecast period.Technavio’s analysts have elaborately explained the regional trends and drivers that shape the market during the forecast period.
See How Contenting Market Demand is Rising in North America Get Free Sample

Geographic adoption within the Contenting sector exhibits distinct operational variances driven by digital infrastructure maturity and regulatory mandates.

North America demonstrates advanced digital commerce ecosystem integration, where organizations utilizing semantic content modeling and cloud hosted content planning experience a 35% higher lead generation efficiency compared to traditional outbound methods.

In contrast, European enterprises prioritize data privacy, shifting heavily toward permission based subscriber networks and permission based digital engagement to comply with stringent mandates, improving audience retention rates by 15%.

This structural divergence compels multinational corporations to deploy automated translation tools and localized lifestyle storytelling to maintain brand consistency across borders while adhering to rigorous content governance frameworks.

By leveraging algorithmic marketing mix models, businesses dynamically adjust capital allocation, optimizing cross-border content distribution and maximizing operational ROI across highly fragmented international digital environments.

Market Dynamics

Our researchers analyzed the data with 2025 as the base year, along with the key drivers, trends, and challenges. A holistic analysis of drivers will help companies refine their marketing strategies to gain a competitive advantage.

  • The operational architecture of the Contenting environment is undergoing a fundamental structural transition as enterprises seek to optimize audience engagement and streamline digital asset management. Modern commercial organizations are actively prioritizing generative engine optimization framework implementation to align their proprietary digital resources with next-generation conversational discovery platforms.
  • This strategic realignment ensures sustained brand visibility while mitigating the risks associated with volatile search algorithm modifications. Furthermore, the autonomous artificial intelligence agent deployment across marketing operations accelerates editorial production cycles, allowing creative teams to shift focus toward high-level strategy and empirical research.
  • When organizations synchronize these automated workflows, they typically observe a 40% reduction in manual asset formatting time, significantly enhancing overall operational planning and resource allocation relative to legacy publishing systems. To navigate the complexities of international consumer demographics, multinational corporations demand seamless dynamic multi channel distribution integration.
  • This capability allows brands to distribute localized multi language digital collateral efficiently, adhering to specific regional compliance standards and cultural nuances without redundant overhead. Simultaneously, commercial entities confront persistent measurement challenges, making cross platform attribution inefficiency resolution a critical boardroom priority.
  • By integrating advanced analytics and unified content operations, marketing executives can definitively link educational publishing initiatives to revenue generation, ensuring that every editorial investment directly accelerates pipeline velocity and strengthens long-term commercial resilience.
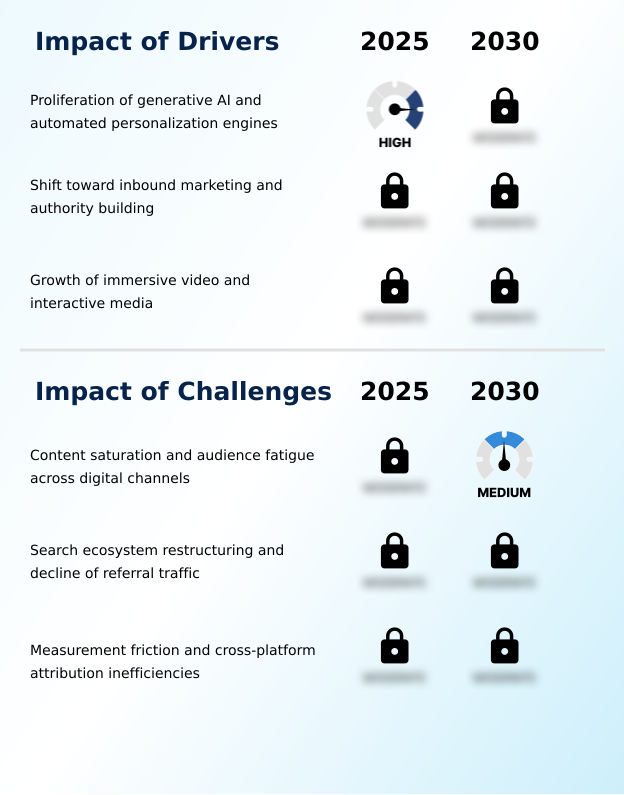
What are the key market drivers leading to the rise in the adoption of Contenting Industry?

  • The rapid proliferation of generative artificial intelligence and automated personalization engines serves as the primary catalyst accelerating expansion across the market.

  • The explosive demand for high velocity editorial production and immersive visual modalities acts as the primary catalyst propelling the Contenting sector.
  • Because modern audiences exhibit severe banner blindness, enterprises are forcefully pivoting toward inbound methodologies to construct high intent engagement pipelines.
  • This behavioral shift drives the integration of spatial computing technologies and dynamic graphic visualization to capture fragmented consumer attention across the omnichannel distribution architecture.
  • By leveraging these advanced formats, commercial entities observe a 40% increase in audience dwell time and a 25% improvement in lead qualification efficiency.
  • Furthermore, the deployment of predictive consumer analytics enables organizations to map complex behavioral data streams, ensuring hyper personalized messaging strategies resonate directly with specific buyer pain points.
  • This alignment translates educational authority into durable brand equity, fundamentally accelerating the enterprise revenue cycle and reducing acquisition friction.

What are the market trends shaping the Contenting Industry?

  • The transition toward generative engine optimization represents a significant emerging trend within the market. Organizations are strategically restructuring digital architectures to align with conversational search algorithms and algorithmic answer summaries.

  • The Contenting ecosystem is rapidly evolving as conversational algorithms displace conventional index-based search mechanisms, fundamentally altering digital information retrieval. This structural shift compells organizations to pivot toward generative engine optimization and multi modal search interfaces to secure organic visibility.
  • Because buyers utilizing natural language queries expect synthesized answers rather than vast lists of referral links, enterprises must integrate intent rich conversational syntax into their informational architectures. Consequently, companies adapting their digital ontology structuring and generative synthesis platforms achieve a 45% improvement in algorithmic feature placement.
  • Additionally, the deployment of predictive intelligence engines allows marketing operations to optimize narrative context in real time, reducing content decay rates by 22%. This continuous innovation in generative artificial intelligence and automated customer relationship frameworks ensures brands maintain authoritative positioning, transforming algorithmic answer summaries into measurable commercial acceleration and sustainable digital relevance.

What challenges does the Contenting Industry face during its growth?

  • Pervasive content saturation and severe audience fatigue across digital distribution channels constitute the primary challenges constraining sustainable industry growth.

  • Pervasive digital saturation and the rapid depreciation of third-party tracking mechanisms present severe structural barriers within the Contenting environment. Because automated generation software dramatically lowers production costs, channels are flooded with commoditized information, making it difficult to distribute empirical research studies and peer reviewed technical publications effectively.
  • This dilution of attention degrades traditional multi touch attribution architectures, causing a 30% decline in predictable organic inbound visitors for legacy publishers. Consequently, organizations struggle to justify budgets without precise measurement. To counter algorithmic suppression, enterprises are forced to adopt programmatic curation logic and precise structured data markup.
  • Furthermore, integrating complex synthetic audio tools and interactive visual rendering significantly inflates production budgets. Failure to navigate these technical limitations results in a 20% increase in customer acquisition costs, severely hindering long-term marketing sustainability and operational efficiency.

Exclusive Technavio Analysis on Customer Landscape

The contenting market forecasting report includes the adoption lifecycle of the market, covering from the innovator’s stage to the laggard’s stage. It focuses on adoption rates in different regions based on penetration. Furthermore, the contenting market report also includes key purchase criteria and drivers of price sensitivity to help companies evaluate and develop their market growth analysis strategies.
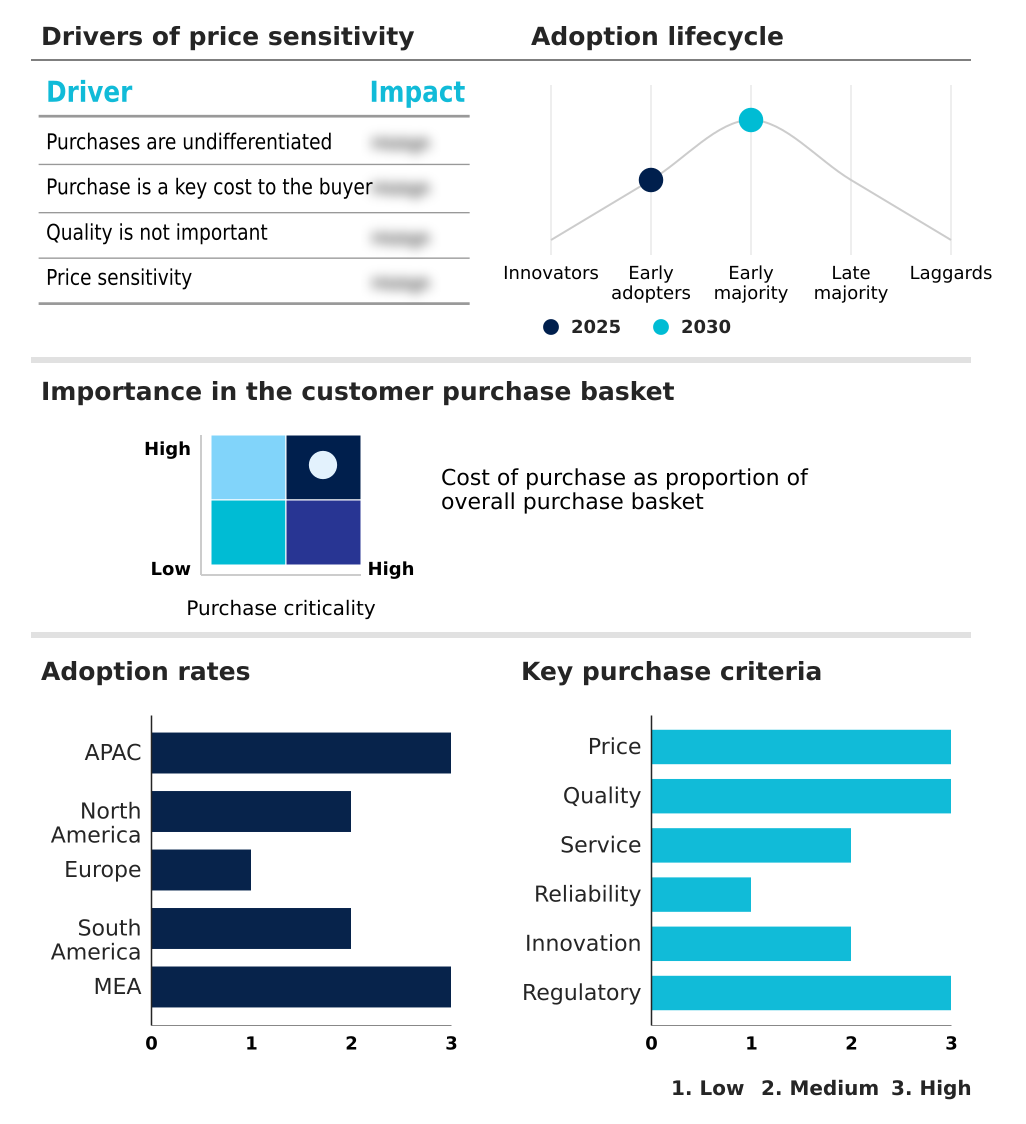
Customer Landscape of Contenting Industry

Competitive Landscape

Companies are implementing various strategies, such as strategic alliances, contenting market forecast, partnerships, mergers and acquisitions, geographical expansion, and product/service launches, to enhance their presence in the industry.

Anyword Inc. - The unified platform delivers advanced copywriting solutions utilizing predictive intelligence models to analyze text, determine optimal audience intent, and generate automated blog writing, case studies, and structured newsletters.

The industry research and growth report includes detailed analyses of the competitive landscape of the market and information about key companies, including:

  • Anyword Inc.
  • Brafton Inc.
  • Bynder B.V.
  • Contentful GmbH
  • Contently Inc.
  • ContentStudio Inc.
  • CoSchedule LLC
  • Flyp Technologies Inc.
  • HubSpot Inc.
  • Jasper AI Inc.
  • Meltwater NV
  • Optimizely Inc.
  • Seismic Software Inc.
  • Semrush Holdings Inc.
  • Siege Media
  • Skyword Inc.
  • Sprinklr Inc.
  • StoryChief NV
  • Teads Holding Co.
  • Writer Inc.

Qualitative and quantitative analysis of companies has been conducted to help clients understand the wider business environment as well as the strengths and weaknesses of key industry players. Data is qualitatively analyzed to categorize companies as pure play, category-focused, industry-focused, and diversified; it is quantitatively analyzed to categorize companies as dominant, leading, strong, tentative, and weak.

Recent Development and News in Contenting market

  • In the Advertising industry, the depreciation of third-party tracking cookies forced organizations to overhaul digital audience acquisition strategies, directly shifting Contenting demand toward permission based subscriber networks and first party behavioral data capture mechanisms, increasing reliance on gated educational assets by 40%.
  • Strict data privacy regulations such as the General Data Protection Regulation compelled media buyers to reduce programmatic ad spend, accelerating the adoption of localized lifestyle storytelling and permission based digital engagement to organically sustain brand visibility across global markets.
  • The rapid integration of spatial computing technologies and synthetic audio tools within immersive media environments pushed digital commerce ecosystem participants to adapt interactive visual rendering, subsequently driving the need for dynamic narrative assets and interactive digital experiences in omni-channel campaigns.
  • Enterprise digital transformation initiatives across telecommunications and financial sectors established automated multi channel scheduling and automated translation tools as operational standards, fundamentally reshaping how localized multi language digital collateral is generated and deployed to achieve a 35% improvement in cross-border conversion efficiency.

Dive into Technavio’s robust research methodology, blending expert interviews, extensive data synthesis, and validated models for unparalleled Contenting Market insights. See full methodology.

Market Scope
Page number 311
Base year 2025
Historic period 2020-2024
Forecast period 2026-2030
Growth momentum & CAGR Accelerate at a CAGR of 13.7%
Market growth 2026-2030 USD 594010.0 thousand
Market structure Fragmented
YoY growth 2025-2026(%) 12.7%
Key countries China, Japan, India, South Korea, Australia, Indonesia, US, Canada, Mexico, Germany, UK, France, Italy, Spain, The Netherlands, Brazil, Argentina, Chile, Saudi Arabia, UAE, South Africa, Israel and Turkey
Competitive landscape Leading Companies, Market Positioning of Companies, Competitive Strategies, and Industry Risks

Request Free Sample

Research Analyst Overview

  • The Contenting landscape functions as a critical mechanism for enterprise revenue enablement and institutional authority building. Contemporary organizations confront severe digital noise, requiring robust content governance frameworks and structured data markup to maintain competitive discoverability.
  • The shift toward natural language queries requires strategic realignment of corporate communications, establishing semantic content modeling as a central boardroom priority for product positioning and compliance management. By implementing unified digital asset repositories and automated taxonomy standards, enterprises have achieved a 35% reduction in cross-departmental campaign deployment times compared to fragmented legacy workflows.
  • Furthermore, the integration of generative synthesis platforms allows commercial teams to optimize omni-channel distribution architecture simultaneously across international markets. This operational efficiency directly enhances multi touch attribution architectures, enabling financial officers to validate editorial investments through measurable pipeline acceleration.
  • Ultimately, the transition from disruptive outbound promotion to verified thought leadership ensures sustainable inbound demand, equipping organizations to navigate evolving digital ecosystems while maximizing long-term customer lifetime value.

What are the Key Data Covered in this Contenting Market Research and Growth Report?

  • What is the expected growth of the Contenting Market between 2026 and 2030?

    • USD 594.01 million, at a CAGR of 13.7%

  • What segmentation does the market report cover?

    • The report is segmented by End-user (Retail, Automotive, Financial services, Telecom, and Others), Platform (Blogging, Videos, Infographics, Case studies, and Others), Objective (Lead generation, Brand awareness, Thought leadership, and Others) and Geography (APAC, North America, Europe, South America, Middle East and Africa)

  • Which regions are analyzed in the report?

    • APAC, North America, Europe, South America and Middle East and Africa

  • What are the key growth drivers and market challenges?

    • Proliferation of generative AI and automated personalization engines, Content saturation and audience fatigue across digital channels

  • Who are the major players in the Contenting Market?

    • Anyword Inc., Brafton Inc., Bynder B.V., Contentful GmbH, Contently Inc., ContentStudio Inc., CoSchedule LLC, Flyp Technologies Inc., HubSpot Inc., Jasper AI Inc., Meltwater NV, Optimizely Inc., Seismic Software Inc., Semrush Holdings Inc., Siege Media, Skyword Inc., Sprinklr Inc., StoryChief NV, Teads Holding Co. and Writer Inc.

Market Research Insights

  • The Contenting landscape is evolving rapidly as enterprises deploy generative artificial intelligence and automated personalized engines to scale digital commerce ecosystem initiatives. Organizations restructuring their digital ontology structuring achieve a 30% reduction in customer acquisition costs by capturing high-intent organic traffic.
  • The integration of cross functional enablement tools allows commercial teams to align multi modal search interfaces with sales pipelines, resulting in a 25% improvement in lead-to-opportunity conversion rates. Furthermore, implementing performance attribution software addresses measurement friction, increasing campaign ROI visibility by 40% across decentralized channels.
  • These systematic operational enhancements ensure that compelling dynamic narrative assets directly influence long-term pipeline acceleration and sustainable brand equity.

We can help! Our analysts can customize this contenting market research report to meet your requirements.

Get in touch

1. Executive Summary

1.1 Market overview

Executive Summary - Chart on Market Overview
Executive Summary - Data Table on Market Overview
Executive Summary - Chart on Global Market Characteristics
Executive Summary - Chart on Market by Geography
Executive Summary - Chart on Market Segmentation by End-user
Executive Summary - Chart on Market Segmentation by Platform
Executive Summary - Chart on Market Segmentation by Objective
Executive Summary - Chart on Incremental Growth
Executive Summary - Data Table on Incremental Growth
Executive Summary - Chart on Company Market Positioning

2. Technavio Analysis

2.1 Analysis of price sensitivity, lifecycle, customer purchase basket, adoption rates, and purchase criteria

2.2 Criticality of inputs and Factors of differentiation

Chart on Overview on criticality of inputs and factors of differentiation

2.3 Factors of disruption

Chart on Overview on factors of disruption

2.4 Impact of drivers and challenges

Chart on Impact of drivers and challenges in 2025 and 2030

3. Market Landscape

3.1 Market ecosystem

Chart on Parent Market
Data Table on - Parent Market

3.2 Market characteristics

Chart on Market characteristics analysis

3.3 Value chain analysis

Chart on Value chain analysis

4. Market Sizing

4.1 Market definition

Data Table on Offerings of companies included in the market definition

4.2 Market segment analysis

Market segments

4.3 Market size 2025

4.4 Market outlook: Forecast for 2025-2030

Chart on Global - Market size and forecast 2025-2030 ($ thousand)
Data Table on Global - Market size and forecast 2025-2030 ($ thousand)
Chart on Global Market: Year-over-year growth 2025-2030 (%)
Data Table on Global Market: Year-over-year growth 2025-2030 (%)

5. Historic Market Size

5.1 Global Content Marketing Market 2020 - 2024

Historic Market Size - Data Table on Global Content Marketing Market 2020 - 2024 ($ thousand)

5.2 End-user segment analysis 2020 - 2024

Historic Market Size - End-user Segment 2020 - 2024 ($ thousand)

5.3 Platform segment analysis 2020 - 2024

Historic Market Size - Platform Segment 2020 - 2024 ($ thousand)

5.4 Objective segment analysis 2020 - 2024

Historic Market Size - Objective Segment 2020 - 2024 ($ thousand)

5.5 Geography segment analysis 2020 - 2024

Historic Market Size - Geography Segment 2020 - 2024 ($ thousand)

5.6 Country segment analysis 2020 - 2024

Historic Market Size - Country Segment 2020 - 2024 ($ thousand)

6. Qualitative Analysis

6.1 Impact of AI on Global Content Marketing Market

6.2 Impact of Geopolitical Conflicts on Global Content Marketing Market

7. Five Forces Analysis

7.1 Five forces summary

Five forces analysis - Comparison between 2025 and 2030

7.2 Bargaining power of buyers

Bargaining power of buyers - Impact of key factors 2025 and 2030

7.3 Bargaining power of suppliers

Bargaining power of suppliers - Impact of key factors in 2025 and 2030

7.4 Threat of new entrants

Threat of new entrants - Impact of key factors in 2025 and 2030

7.5 Threat of substitutes

Threat of substitutes - Impact of key factors in 2025 and 2030

7.6 Threat of rivalry

Threat of rivalry - Impact of key factors in 2025 and 2030

7.7 Market condition

Chart on Market condition - Five forces 2025 and 2030

8. Market Segmentation by End-user

8.1 Market segments

Chart on End-user - Market share 2025-2030 (%)
Data Table on End-user - Market share 2025-2030 (%)

8.2 Comparison by End-user

Chart on Comparison by End-user
Data Table on Comparison by End-user

8.3 Retail - Market size and forecast 2025-2030

Chart on Retail - Market size and forecast 2025-2030 ($ thousand)
Data Table on Retail - Market size and forecast 2025-2030 ($ thousand)
Chart on Retail - Year-over-year growth 2025-2030 (%)
Data Table on Retail - Year-over-year growth 2025-2030 (%)

8.4 Automotive - Market size and forecast 2025-2030

Chart on Automotive - Market size and forecast 2025-2030 ($ thousand)
Data Table on Automotive - Market size and forecast 2025-2030 ($ thousand)
Chart on Automotive - Year-over-year growth 2025-2030 (%)
Data Table on Automotive - Year-over-year growth 2025-2030 (%)

8.5 Financial services - Market size and forecast 2025-2030

Chart on Financial services - Market size and forecast 2025-2030 ($ thousand)
Data Table on Financial services - Market size and forecast 2025-2030 ($ thousand)
Chart on Financial services - Year-over-year growth 2025-2030 (%)
Data Table on Financial services - Year-over-year growth 2025-2030 (%)

8.6 Telecom - Market size and forecast 2025-2030

Chart on Telecom - Market size and forecast 2025-2030 ($ thousand)
Data Table on Telecom - Market size and forecast 2025-2030 ($ thousand)
Chart on Telecom - Year-over-year growth 2025-2030 (%)
Data Table on Telecom - Year-over-year growth 2025-2030 (%)

8.7 Others - Market size and forecast 2025-2030

Chart on Others - Market size and forecast 2025-2030 ($ thousand)
Data Table on Others - Market size and forecast 2025-2030 ($ thousand)
Chart on Others - Year-over-year growth 2025-2030 (%)
Data Table on Others - Year-over-year growth 2025-2030 (%)

8.8 Market opportunity by End-user

Market opportunity by End-user ($ thousand)
Data Table on Market opportunity by End-user ($ thousand)

9. Market Segmentation by Platform

9.1 Market segments

Chart on Platform - Market share 2025-2030 (%)
Data Table on Platform - Market share 2025-2030 (%)

9.2 Comparison by Platform

Chart on Comparison by Platform
Data Table on Comparison by Platform

9.3 Blogging - Market size and forecast 2025-2030

Chart on Blogging - Market size and forecast 2025-2030 ($ thousand)
Data Table on Blogging - Market size and forecast 2025-2030 ($ thousand)
Chart on Blogging - Year-over-year growth 2025-2030 (%)
Data Table on Blogging - Year-over-year growth 2025-2030 (%)

9.4 Videos - Market size and forecast 2025-2030

Chart on Videos - Market size and forecast 2025-2030 ($ thousand)
Data Table on Videos - Market size and forecast 2025-2030 ($ thousand)
Chart on Videos - Year-over-year growth 2025-2030 (%)
Data Table on Videos - Year-over-year growth 2025-2030 (%)

9.5 Infographics - Market size and forecast 2025-2030

Chart on Infographics - Market size and forecast 2025-2030 ($ thousand)
Data Table on Infographics - Market size and forecast 2025-2030 ($ thousand)
Chart on Infographics - Year-over-year growth 2025-2030 (%)
Data Table on Infographics - Year-over-year growth 2025-2030 (%)

9.6 Case studies - Market size and forecast 2025-2030

Chart on Case studies - Market size and forecast 2025-2030 ($ thousand)
Data Table on Case studies - Market size and forecast 2025-2030 ($ thousand)
Chart on Case studies - Year-over-year growth 2025-2030 (%)
Data Table on Case studies - Year-over-year growth 2025-2030 (%)

9.7 Others - Market size and forecast 2025-2030

Chart on Others - Market size and forecast 2025-2030 ($ thousand)
Data Table on Others - Market size and forecast 2025-2030 ($ thousand)
Chart on Others - Year-over-year growth 2025-2030 (%)
Data Table on Others - Year-over-year growth 2025-2030 (%)

9.8 Market opportunity by Platform

Market opportunity by Platform ($ thousand)
Data Table on Market opportunity by Platform ($ thousand)

10. Market Segmentation by Objective

10.1 Market segments

Chart on Objective - Market share 2025-2030 (%)
Data Table on Objective - Market share 2025-2030 (%)

10.2 Comparison by Objective

Chart on Comparison by Objective
Data Table on Comparison by Objective

10.3 Lead generation - Market size and forecast 2025-2030

Chart on Lead generation - Market size and forecast 2025-2030 ($ thousand)
Data Table on Lead generation - Market size and forecast 2025-2030 ($ thousand)
Chart on Lead generation - Year-over-year growth 2025-2030 (%)
Data Table on Lead generation - Year-over-year growth 2025-2030 (%)

10.4 Brand awareness - Market size and forecast 2025-2030

Chart on Brand awareness - Market size and forecast 2025-2030 ($ thousand)
Data Table on Brand awareness - Market size and forecast 2025-2030 ($ thousand)
Chart on Brand awareness - Year-over-year growth 2025-2030 (%)
Data Table on Brand awareness - Year-over-year growth 2025-2030 (%)

10.5 Thought leadership - Market size and forecast 2025-2030

Chart on Thought leadership - Market size and forecast 2025-2030 ($ thousand)
Data Table on Thought leadership - Market size and forecast 2025-2030 ($ thousand)
Chart on Thought leadership - Year-over-year growth 2025-2030 (%)
Data Table on Thought leadership - Year-over-year growth 2025-2030 (%)

10.6 Others - Market size and forecast 2025-2030

Chart on Others - Market size and forecast 2025-2030 ($ thousand)
Data Table on Others - Market size and forecast 2025-2030 ($ thousand)
Chart on Others - Year-over-year growth 2025-2030 (%)
Data Table on Others - Year-over-year growth 2025-2030 (%)

10.7 Market opportunity by Objective

Market opportunity by Objective ($ thousand)
Data Table on Market opportunity by Objective ($ thousand)

11. Customer Landscape

11.1 Customer landscape overview

Analysis of price sensitivity, lifecycle, customer purchase basket, adoption rates, and purchase criteria

12. Geographic Landscape

12.1 Geographic segmentation

Chart on Market share by geography 2025-2030 (%)
Data Table on Market share by geography 2025-2030 (%)

12.2 Geographic comparison

Chart on Geographic comparison
Data Table on Geographic comparison

12.3 APAC - Market size and forecast 2025-2030

Chart on APAC - Market size and forecast 2025-2030 ($ thousand)
Data Table on APAC - Market size and forecast 2025-2030 ($ thousand)
Chart on APAC - Year-over-year growth 2025-2030 (%)
Data Table on APAC - Year-over-year growth 2025-2030 (%)
Chart on Regional Comparison - APAC
Data Table on Regional Comparison - APAC

12.3.1 China - Market size and forecast 2025-2030

Chart on China - Market size and forecast 2025-2030 ($ thousand)
Data Table on China - Market size and forecast 2025-2030 ($ thousand)
Chart on China - Year-over-year growth 2025-2030 (%)
Data Table on China - Year-over-year growth 2025-2030 (%)

12.3.2 Japan - Market size and forecast 2025-2030

Chart on Japan - Market size and forecast 2025-2030 ($ thousand)
Data Table on Japan - Market size and forecast 2025-2030 ($ thousand)
Chart on Japan - Year-over-year growth 2025-2030 (%)
Data Table on Japan - Year-over-year growth 2025-2030 (%)

12.3.3 India - Market size and forecast 2025-2030

Chart on India - Market size and forecast 2025-2030 ($ thousand)
Data Table on India - Market size and forecast 2025-2030 ($ thousand)
Chart on India - Year-over-year growth 2025-2030 (%)
Data Table on India - Year-over-year growth 2025-2030 (%)

12.3.4 South Korea - Market size and forecast 2025-2030

Chart on South Korea - Market size and forecast 2025-2030 ($ thousand)
Data Table on South Korea - Market size and forecast 2025-2030 ($ thousand)
Chart on South Korea - Year-over-year growth 2025-2030 (%)
Data Table on South Korea - Year-over-year growth 2025-2030 (%)

12.3.5 Australia - Market size and forecast 2025-2030

Chart on Australia - Market size and forecast 2025-2030 ($ thousand)
Data Table on Australia - Market size and forecast 2025-2030 ($ thousand)
Chart on Australia - Year-over-year growth 2025-2030 (%)
Data Table on Australia - Year-over-year growth 2025-2030 (%)

12.3.6 Indonesia - Market size and forecast 2025-2030

Chart on Indonesia - Market size and forecast 2025-2030 ($ thousand)
Data Table on Indonesia - Market size and forecast 2025-2030 ($ thousand)
Chart on Indonesia - Year-over-year growth 2025-2030 (%)
Data Table on Indonesia - Year-over-year growth 2025-2030 (%)

12.4 North America - Market size and forecast 2025-2030

Chart on North America - Market size and forecast 2025-2030 ($ thousand)
Data Table on North America - Market size and forecast 2025-2030 ($ thousand)
Chart on North America - Year-over-year growth 2025-2030 (%)
Data Table on North America - Year-over-year growth 2025-2030 (%)
Chart on Regional Comparison - North America
Data Table on Regional Comparison - North America

12.4.1 US - Market size and forecast 2025-2030

Chart on US - Market size and forecast 2025-2030 ($ thousand)
Data Table on US - Market size and forecast 2025-2030 ($ thousand)
Chart on US - Year-over-year growth 2025-2030 (%)
Data Table on US - Year-over-year growth 2025-2030 (%)

12.4.2 Canada - Market size and forecast 2025-2030

Chart on Canada - Market size and forecast 2025-2030 ($ thousand)
Data Table on Canada - Market size and forecast 2025-2030 ($ thousand)
Chart on Canada - Year-over-year growth 2025-2030 (%)
Data Table on Canada - Year-over-year growth 2025-2030 (%)

12.4.3 Mexico - Market size and forecast 2025-2030

Chart on Mexico - Market size and forecast 2025-2030 ($ thousand)
Data Table on Mexico - Market size and forecast 2025-2030 ($ thousand)
Chart on Mexico - Year-over-year growth 2025-2030 (%)
Data Table on Mexico - Year-over-year growth 2025-2030 (%)

12.5 Europe - Market size and forecast 2025-2030

Chart on Europe - Market size and forecast 2025-2030 ($ thousand)
Data Table on Europe - Market size and forecast 2025-2030 ($ thousand)
Chart on Europe - Year-over-year growth 2025-2030 (%)
Data Table on Europe - Year-over-year growth 2025-2030 (%)
Chart on Regional Comparison - Europe
Data Table on Regional Comparison - Europe

12.5.1 Germany - Market size and forecast 2025-2030

Chart on Germany - Market size and forecast 2025-2030 ($ thousand)
Data Table on Germany - Market size and forecast 2025-2030 ($ thousand)
Chart on Germany - Year-over-year growth 2025-2030 (%)
Data Table on Germany - Year-over-year growth 2025-2030 (%)

12.5.2 UK - Market size and forecast 2025-2030

Chart on UK - Market size and forecast 2025-2030 ($ thousand)
Data Table on UK - Market size and forecast 2025-2030 ($ thousand)
Chart on UK - Year-over-year growth 2025-2030 (%)
Data Table on UK - Year-over-year growth 2025-2030 (%)

12.5.3 France - Market size and forecast 2025-2030

Chart on France - Market size and forecast 2025-2030 ($ thousand)
Data Table on France - Market size and forecast 2025-2030 ($ thousand)
Chart on France - Year-over-year growth 2025-2030 (%)
Data Table on France - Year-over-year growth 2025-2030 (%)

12.5.4 Italy - Market size and forecast 2025-2030

Chart on Italy - Market size and forecast 2025-2030 ($ thousand)
Data Table on Italy - Market size and forecast 2025-2030 ($ thousand)
Chart on Italy - Year-over-year growth 2025-2030 (%)
Data Table on Italy - Year-over-year growth 2025-2030 (%)

12.5.5 Spain - Market size and forecast 2025-2030

Chart on Spain - Market size and forecast 2025-2030 ($ thousand)
Data Table on Spain - Market size and forecast 2025-2030 ($ thousand)
Chart on Spain - Year-over-year growth 2025-2030 (%)
Data Table on Spain - Year-over-year growth 2025-2030 (%)

12.5.6 The Netherlands - Market size and forecast 2025-2030

Chart on The Netherlands - Market size and forecast 2025-2030 ($ thousand)
Data Table on The Netherlands - Market size and forecast 2025-2030 ($ thousand)
Chart on The Netherlands - Year-over-year growth 2025-2030 (%)
Data Table on The Netherlands - Year-over-year growth 2025-2030 (%)

12.6 South America - Market size and forecast 2025-2030

Chart on South America - Market size and forecast 2025-2030 ($ thousand)
Data Table on South America - Market size and forecast 2025-2030 ($ thousand)
Chart on South America - Year-over-year growth 2025-2030 (%)
Data Table on South America - Year-over-year growth 2025-2030 (%)
Chart on Regional Comparison - South America
Data Table on Regional Comparison - South America

12.6.1 Brazil - Market size and forecast 2025-2030

Chart on Brazil - Market size and forecast 2025-2030 ($ thousand)
Data Table on Brazil - Market size and forecast 2025-2030 ($ thousand)
Chart on Brazil - Year-over-year growth 2025-2030 (%)
Data Table on Brazil - Year-over-year growth 2025-2030 (%)

12.6.2 Argentina - Market size and forecast 2025-2030

Chart on Argentina - Market size and forecast 2025-2030 ($ thousand)
Data Table on Argentina - Market size and forecast 2025-2030 ($ thousand)
Chart on Argentina - Year-over-year growth 2025-2030 (%)
Data Table on Argentina - Year-over-year growth 2025-2030 (%)

12.6.3 Chile - Market size and forecast 2025-2030

Chart on Chile - Market size and forecast 2025-2030 ($ thousand)
Data Table on Chile - Market size and forecast 2025-2030 ($ thousand)
Chart on Chile - Year-over-year growth 2025-2030 (%)
Data Table on Chile - Year-over-year growth 2025-2030 (%)

12.7 Middle East and Africa - Market size and forecast 2025-2030

Chart on Middle East and Africa - Market size and forecast 2025-2030 ($ thousand)
Data Table on Middle East and Africa - Market size and forecast 2025-2030 ($ thousand)
Chart on Middle East and Africa - Year-over-year growth 2025-2030 (%)
Data Table on Middle East and Africa - Year-over-year growth 2025-2030 (%)
Chart on Regional Comparison - Middle East and Africa
Data Table on Regional Comparison - Middle East and Africa

12.7.1 Saudi Arabia - Market size and forecast 2025-2030

Chart on Saudi Arabia - Market size and forecast 2025-2030 ($ thousand)
Data Table on Saudi Arabia - Market size and forecast 2025-2030 ($ thousand)
Chart on Saudi Arabia - Year-over-year growth 2025-2030 (%)
Data Table on Saudi Arabia - Year-over-year growth 2025-2030 (%)

12.7.2 UAE - Market size and forecast 2025-2030

Chart on UAE - Market size and forecast 2025-2030 ($ thousand)
Data Table on UAE - Market size and forecast 2025-2030 ($ thousand)
Chart on UAE - Year-over-year growth 2025-2030 (%)
Data Table on UAE - Year-over-year growth 2025-2030 (%)

12.7.3 South Africa - Market size and forecast 2025-2030

Chart on South Africa - Market size and forecast 2025-2030 ($ thousand)
Data Table on South Africa - Market size and forecast 2025-2030 ($ thousand)
Chart on South Africa - Year-over-year growth 2025-2030 (%)
Data Table on South Africa - Year-over-year growth 2025-2030 (%)

12.7.4 Israel - Market size and forecast 2025-2030

Chart on Israel - Market size and forecast 2025-2030 ($ thousand)
Data Table on Israel - Market size and forecast 2025-2030 ($ thousand)
Chart on Israel - Year-over-year growth 2025-2030 (%)
Data Table on Israel - Year-over-year growth 2025-2030 (%)

12.7.5 Turkey - Market size and forecast 2025-2030

Chart on Turkey - Market size and forecast 2025-2030 ($ thousand)
Data Table on Turkey - Market size and forecast 2025-2030 ($ thousand)
Chart on Turkey - Year-over-year growth 2025-2030 (%)
Data Table on Turkey - Year-over-year growth 2025-2030 (%)

12.8 Market opportunity by geography

Market opportunity by geography ($ thousand)
Data Tables on Market opportunity by geography ($ thousand)

13. Drivers, Challenges, and Opportunity

13.1 Market drivers

Proliferation of generative AI and automated personalization engines
Shift toward inbound marketing and authority building
Growth of immersive video and interactive media

13.2 Market challenges

Content saturation and audience fatigue across digital channels
Search ecosystem restructuring and decline of referral traffic
Measurement friction and cross-platform attribution inefficiencies

13.3 Impact of drivers and challenges

Impact of drivers and challenges in 2025 and 2030

13.4 Market opportunities

Shift toward generative engine optimization
Growing demand for expert-validated content
Unified content operations and revenue enablement

14. Competitive Landscape

14.1 Overview

14.2

Overview on criticality of inputs and factors of differentiation

14.3 Landscape disruption

Overview on factors of disruption

14.4 Industry risks

Impact of key risks on business

15. Competitive Analysis

15.1 Companies profiled

Companies covered

15.2 Company ranking index

15.3 Market positioning of companies

Matrix on companies position and classification

15.4 Anyword Inc.

Anyword Inc. - Overview
Anyword Inc. - Product / Service
Anyword Inc. - Key offerings
SWOT

15.5 Brafton Inc.

Brafton Inc. - Overview
Brafton Inc. - Product / Service
Brafton Inc. - Key offerings
SWOT

15.6 Bynder B.V.

Bynder B.V. - Overview
Bynder B.V. - Product / Service
Bynder B.V. - Key offerings
SWOT

15.7 Contentful GmbH

Contentful GmbH - Overview
Contentful GmbH - Product / Service
Contentful GmbH - Key offerings
SWOT

15.8 Contently Inc.

Contently Inc. - Overview
Contently Inc. - Product / Service
Contently Inc. - Key offerings
SWOT

15.9 HubSpot Inc.

HubSpot Inc. - Overview
HubSpot Inc. - Business segments
HubSpot Inc. - Key offerings
HubSpot Inc. - Segment focus
SWOT

15.10 Jasper AI Inc.

Jasper AI Inc. - Overview
Jasper AI Inc. - Product / Service
Jasper AI Inc. - Key offerings
SWOT

15.11 Meltwater NV

Meltwater NV - Overview
Meltwater NV - Product / Service
Meltwater NV - Key offerings
SWOT

15.12 Optimizely Inc.

Optimizely Inc. - Overview
Optimizely Inc. - Product / Service
Optimizely Inc. - Key offerings
SWOT

15.13 Seismic Software Inc.

Seismic Software Inc. - Overview
Seismic Software Inc. - Product / Service
Seismic Software Inc. - Key offerings
SWOT

15.14 Semrush Holdings Inc.

Semrush Holdings Inc. - Overview
Semrush Holdings Inc. - Business segments
Semrush Holdings Inc. - Key news
Semrush Holdings Inc. - Key offerings
Semrush Holdings Inc. - Segment focus
SWOT

15.15 Skyword Inc.

Skyword Inc. - Overview
Skyword Inc. - Product / Service
Skyword Inc. - Key offerings
SWOT

15.16 Sprinklr Inc.

Sprinklr Inc. - Overview
Sprinklr Inc. - Product / Service
Sprinklr Inc. - Key offerings
SWOT

15.17 StoryChief NV

StoryChief NV - Overview
StoryChief NV - Product / Service
StoryChief NV - Key offerings
SWOT

15.18 Teads Holding Co.

Teads Holding Co. - Overview
Teads Holding Co. - Product / Service
Teads Holding Co. - Key news
Teads Holding Co. - Key offerings
SWOT

16. Appendix

16.1 Scope of the report

Market definition
Objectives
Notes and caveats

16.2 Inclusions and exclusions checklist

Inclusions checklist
Exclusions checklist

16.3 Currency conversion rates for US$

16.4 Research methodology

16.5 Data procurement

Information sources

16.6 Data validation

16.7 Validation techniques employed for market sizing

16.8 Data synthesis

16.9 360 degree market analysis

16.10 List of abbreviations

Research Methodology

Technavio presents a detailed picture of the market by way of study, synthesis, and summation of data from multiple sources. The analysts have presented the various facets of the market with a particular focus on identifying the key industry influencers. The data thus presented is comprehensive, reliable, and the result of extensive research, both primary and secondary.

INFORMATION SOURCES

Primary sources

  • Manufacturers and suppliers
  • Channel partners
  • Industry experts
  • Strategic decision makers

Secondary sources

  • Industry journals and periodicals
  • Government data
  • Financial reports of key industry players
  • Historical data
  • Press releases

DATA ANALYSIS

Data Synthesis

  • Collation of data
  • Estimation of key figures
  • Analysis of derived insights

Data Validation

  • Triangulation with data models
  • Reference against proprietary databases
  • Corroboration with industry experts

REPORT WRITING

Qualitative

  • Market drivers
  • Market challenges
  • Market trends
  • Five forces analysis

Quantitative

  • Market size and forecast
  • Market segmentation
  • Geographical insights
  • Competitive landscape

Interested in this report?

Get your sample now to see our research methodology and insights!

Download Now

Frequently Asked Questions

Contenting market growth will increase by USD 594010.0 thousand thousand during 2026-2030.

The Contenting market is expected to grow at a CAGR of 13.7% during 2026-2030.

Contenting market is segmented by End-user (Retail, Automotive, Financial services, Telecom, Others) Platform (Blogging, Videos, Infographics, Case studies, Others) Objective (Lead generation, Brand awareness, Thought leadership, Others)

Anyword Inc., Brafton Inc., Bynder B.V., Contentful GmbH, Contently Inc., ContentStudio Inc., CoSchedule LLC, Flyp Technologies Inc., HubSpot Inc., Jasper AI Inc., Meltwater NV, Optimizely Inc., Seismic Software Inc., Semrush Holdings Inc., Siege Media, Skyword Inc., Sprinklr Inc., StoryChief NV, Teads Holding Co., Writer Inc. are a few of the key vendors in the Contenting market.

North America will register the highest growth rate of 36.5% among the other regions. Therefore, the Contenting market in North America is expected to garner significant business opportunities for the vendors during the forecast period.

China, Japan, India, South Korea, Australia, Indonesia, US, Canada, Mexico, Germany, UK, France, Italy, Spain, The Netherlands, Brazil, Argentina, Chile, Saudi Arabia, UAE, South Africa, Israel, Turkey

  • Proliferation of generative AI and automated personalization engines is the driving factor this market.

The Contenting market vendors should focus on grabbing business opportunities from the End-user segment as it accounted for the largest market share in the base year.
RIA - Research AI Assistant
Ask RIA