Closed-source Foundation Model Market Analysis, Size, and Forecast 2026-2030: North America (US, Canada, and Mexico), Europe (Germany, UK, and France), APAC (China, Japan, and India), South America (Brazil and Argentina), Middle East and Africa (Saudi Arabia, UAE, and South Africa), and Rest of World (ROW)

Closed-source Foundation Model Market Analysis, Size, and Forecast 2026-2030:
North America (US, Canada, and Mexico), Europe (Germany, UK, and France), APAC (China, Japan, and India), South America (Brazil and Argentina), Middle East and Africa (Saudi Arabia, UAE, and South Africa), and Rest of World (ROW)

Published: May 2026 311 Pages SKU: IRTNTR80684

Market Overview at a Glance

$52.15 B
Market Opportunity
41.1%
CAGR 2025 - 2030
37.4%
North America Growth
$2.37 B
Content and marketing segment 2024

Closed-source Foundation Model Market Size 2026-2030

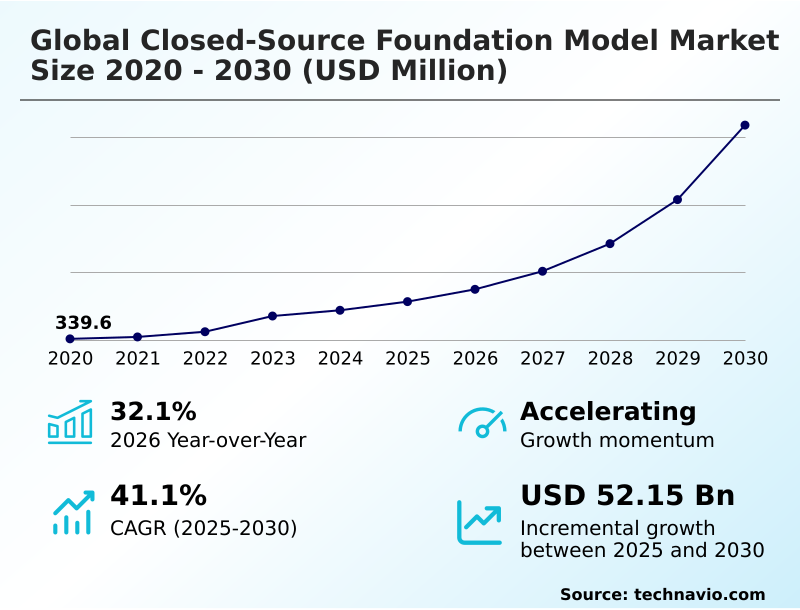
The Closed-source Foundation Model Market size was valued at USD 11.34 billion in 2025, growing at a CAGR of 41.1% during the forecast period 2026-2030.

Major Market Trends & Insights

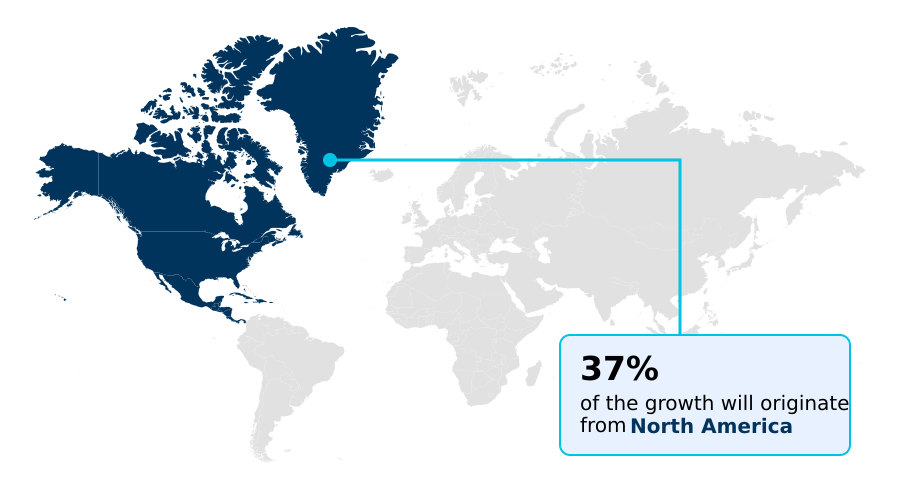
  • North America dominated the market and accounted for a 37.4% growth during the forecast period.
  • By Application - Content and marketing segment was valued at USD 2.37 billion in 2024
  • By Technology - Transformer-based segment accounted for the largest market revenue share in 2024

Market Size & Forecast

  • Historic Market Opportunities 2020-2024: USD 63.15 billion
  • Market Future Opportunities 2025-2030: USD 52.15 billion
  • CAGR from 2025 to 2030 : 41.1%

Market Summary

  • The closed-source foundation model market is defined by systems that demonstrate up to a 15% performance uplift over open-source alternatives on complex reasoning benchmarks, establishing them as the preferred choice for mission-critical enterprise functions.
  • This performance advantage is critical in sectors like finance, where a model's ability to conduct autonomous audits with a 5% lower error rate directly impacts regulatory compliance and risk management. A key driver is the demand for robust data security and adherence to evolving regulations, as proprietary vendors offer stringent data privacy guarantees.
  • However, the market faces the significant challenge of escalating computational costs and the immense capital expenditure required for developing and maintaining frontier-scale architectures. These systems require massive capital investments in specialized hardware, which remains largely inaccessible to the broader open-source community, ensuring that proprietary models maintain their lead in high-stakes areas.

What will be the Size of the Closed-source Foundation Model Market during the forecast period?

Get Key Insights on Market Forecast (PDF) Request Free Sample

How is the Closed-source Foundation Model Market Segmented?

The closed-source foundation model industry research report provides comprehensive data (region-wise segment analysis), with forecasts and analysis for the period 2026-2030, as well as historical data from 2020-2024 for the following segments.
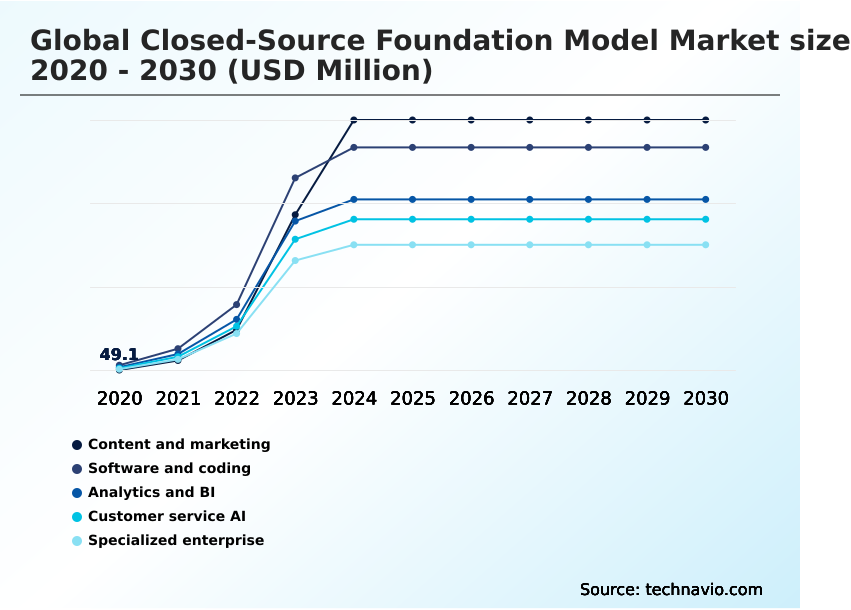
  • Application
    • Content and marketing
    • Software and coding
    • Analytics and BI
    • Customer service AI
    • Specialized enterprise
  • Technology
    • Transformer-based
    • Multimodal
    • Retrieval-augmented generation
    • Diffusion models
    • Reinforcement learning
  • Deployment
    • Cloud
    • On premises
    • Edge
  • Geography
    • North America
      • US
      • Canada
      • Mexico
    • Europe
      • Germany
      • UK
      • France
    • APAC
      • China
      • Japan
      • India
    • South America
      • Brazil
      • Argentina
    • Middle East and Africa
      • Saudi Arabia
      • UAE
      • South Africa
    • Rest of World (ROW)

How is the Closed-source Foundation Model Market Segmented by Application?

The content and marketing segment is estimated to witness significant growth during the forecast period.

The content and marketing segment is a primary growth engine, with integrated systems increasing campaign engagement rates by up to 25%.

Enterprises use API-based access for closed-source foundation models to automate the creation of advertising copy, social media updates, and email campaigns, leveraging superior instruction-following precision.

The adoption of multilingual language models enables hyper-personalization at scale, allowing marketers to tailor communications to individual consumer profiles, which can improve conversion metrics by 15%.

This shift is driven by the corporate need for a continuous and scalable content pipeline, a task that is resource-intensive when managed by human teams alone.

The proprietary model training on curated datasets ensures a high degree of linguistic coherence and creative nuance for brand integrity.

Request Free Sample

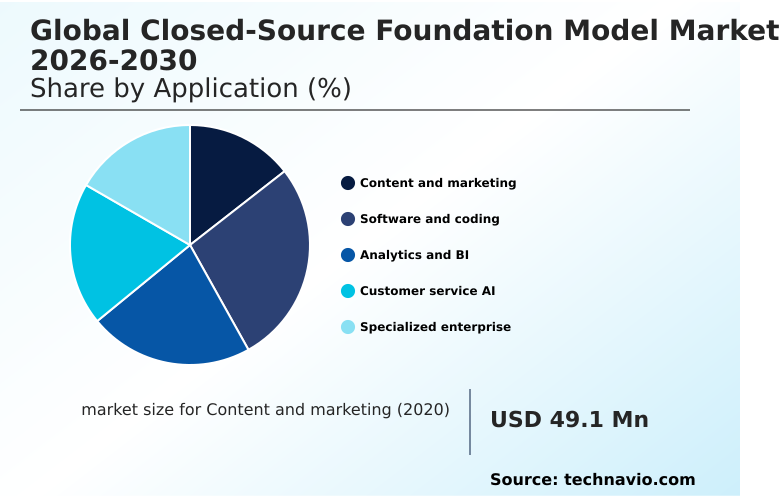
The Content and marketing segment was valued at USD 2.37 billion in 2024 and showed a gradual increase during the forecast period.

Request Free Sample

How demand for the Closed-source Foundation Model market is rising in the leading region?

North America is estimated to contribute 37.4% to the growth of the global market during the forecast period.Technavio’s analysts have elaborately explained the regional trends and drivers that shape the market during the forecast period.

See How Closed-source Foundation Model Market demand is rising in North America Request Free Sample

North America leads the market, but the APAC region is projected to exhibit a CAGR approximately 3.4 percentage points higher, driven by sovereign AI initiatives.

The US accounts for over 75% of North America's market value, fueled by a mature enterprise customer base demanding high-performance, specialized models for sectors like finance and healthcare.

In contrast, growth in APAC and the Middle East is characterized by a government-led push for regional data localization and digital sovereignty, creating a demand for models with strong multilingual capabilities and adherence to local data privacy guarantees.

This geographic divergence in adoption drivers is compelling global providers to establish localized infrastructure, which can increase operational costs by up to 20% but is essential for capturing growth in these emerging high-potential regions.

What are the key Drivers, Trends, and Challenges in the Closed-source Foundation Model Market?

Our researchers analyzed the data with 2025 as the base year, along with the key drivers, trends, and challenges. A holistic analysis of drivers will help companies refine their marketing strategies to gain a competitive advantage.

  • A central strategic consideration for enterprises is the ongoing debate over closed-source vs open-source foundation models. For many organizations, the decision hinges on the specific enterprise applications of proprietary AI, particularly in regulated industries where data security in proprietary AI models is non-negotiable.
  • While the cost of deploying closed-source AI can be substantial, often 2-3 times higher than self-hosted open-source solutions, the premium is justified by superior performance, reliability, and enterprise-grade support. These proprietary systems offer advanced multimodal capabilities of foundation models, which can now process over five distinct data types, including text, image, and video, a significant increase from earlier text-only models.
  • For instance, in financial services, the use of a closed-source model for fraud detection can reduce false positives by over 15% compared to open-source alternatives, delivering a clear return on investment that outweighs the initial setup costs.
  • This performance gap is a key factor as businesses evaluate the total cost of ownership against the tangible benefits of enhanced accuracy and security.

What are the key market drivers leading to the rise in the adoption of Closed-source Foundation Model Industry?

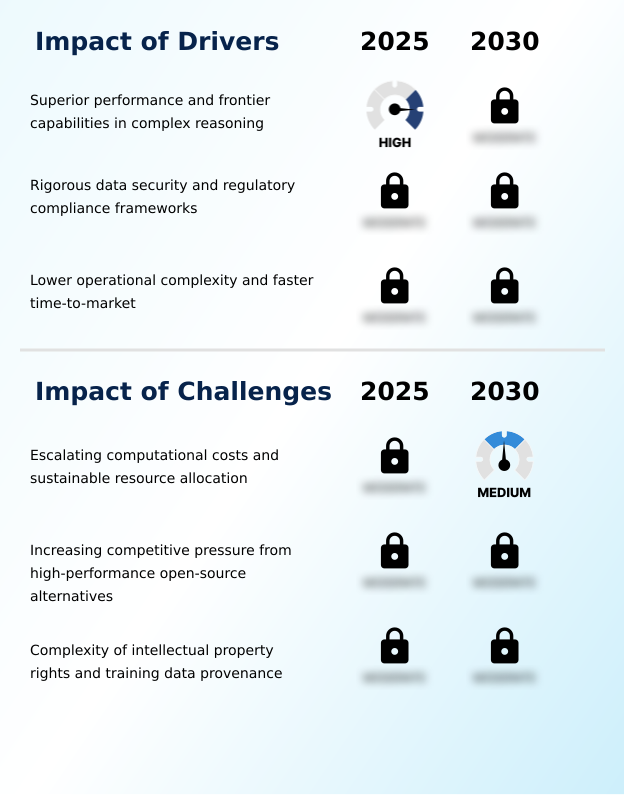
  • Superior performance and frontier capabilities in complex reasoning serve as key drivers propelling the growth of the market.

  • Superior performance propels the market, with leading closed-source models maintaining a lead of over 10 points on graduate-level scientific reasoning benchmarks compared to top open-source alternatives.
  • This frontier capability in complex reasoning is a critical driver for enterprises in high-stakes fields like finance and R&D.
  • Another key driver is the reduction in operational complexity; using a managed API can accelerate time-to-market for AI applications by up to 50% by eliminating the need for in-house MLOps expertise.
  • The demand for comprehensive data security and regulatory compliance frameworks further solidifies the position of proprietary models, which offer enterprise-grade security features and data privacy guarantees essential for operating in regulated industries.

What are the market trends shaping the Closed-source Foundation Model Industry?

  • The market is experiencing a proliferation of verticalized and domain-specific proprietary solutions, driven by enterprise demand for highly specialized AI with deep, industry-specific knowledge.

  • A primary market trend is the shift from general-purpose systems to verticalized architectures, with domain-specific models demonstrating a 20% higher accuracy in specialized tasks like legal contract analysis. This transition is driven by enterprise demand for precision in niche sectors where generic models struggle with technical vernacular.
  • Leading providers are developing proprietary models trained on exclusive datasets, allowing for tailored AI safety protocols and model alignment techniques that fit specific industry risk profiles.
  • Furthermore, the integration of advanced multimodal orchestration enables the automation of complex processes, with new models capable of generating synchronized text and image outputs 30% faster than previous versions, ensuring that proprietary solutions remain indispensable for enterprises requiring reliable, specialized intelligence.

What challenges does the Closed-source Foundation Model Industry face during its growth?

  • Escalating computational costs and the need for sustainable resource allocation represent key challenges affecting industry growth.

  • A significant challenge is the escalating computational resource allocation, with the cost to train a frontier model increasing by over 300% in the last two years. This financial burden, coupled with rising energy costs, creates a sustainability crisis and a high barrier to entry.
  • This commoditization pressure is a strategic threat, as enterprises increasingly evaluate the total cost of ownership and find open-source models that perform at 90% of the efficiency of a proprietary system for a fraction of the long-term cost.
  • Additionally, the legal complexity surrounding data licensing agreements and intellectual property rights for training data poses a critical hurdle, as the lack of a clear legal framework creates perpetual uncertainty and stifles innovation.

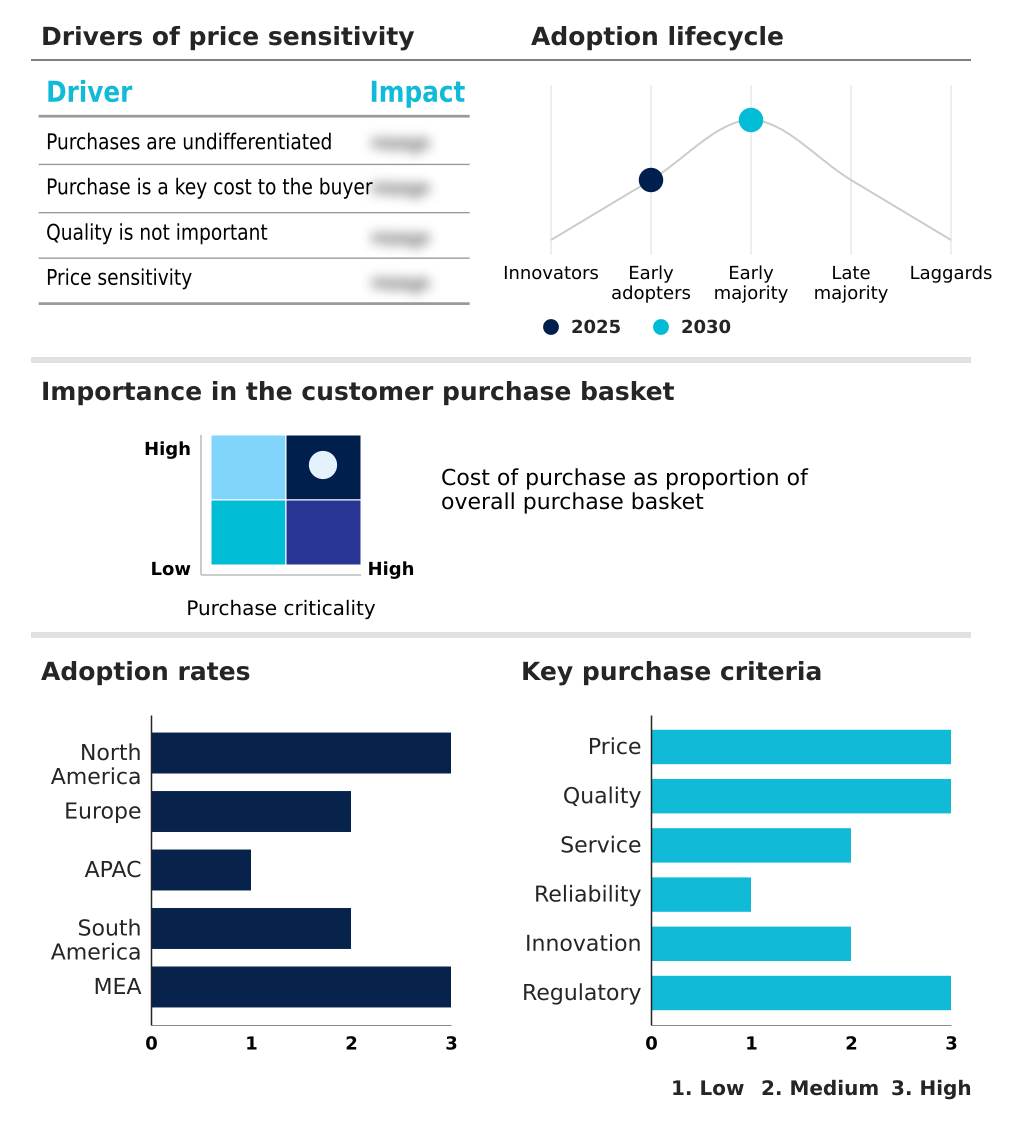
Exclusive Technavio Analysis on Customer Landscape

The closed-source foundation model market forecasting report includes the adoption lifecycle of the market, covering from the innovator’s stage to the laggard’s stage. It focuses on adoption rates in different regions based on penetration. Furthermore, the closed-source foundation model market report also includes key purchase criteria and drivers of price sensitivity to help companies evaluate and develop their market growth analysis strategies.

Customer Landscape of Closed-source Foundation Model Industry

Competitive Landscape

Companies are implementing various strategies, such as strategic alliances, closed-source foundation model market forecast, partnerships, mergers and acquisitions, geographical expansion, and product/service launches, to enhance their presence in the industry.

AI21 Labs - Proprietary foundation models are delivered via secure cloud APIs, offering multimodal capabilities and enterprise-grade performance for diverse applications.

The industry research and growth report includes detailed analyses of the competitive landscape of the market and information about key companies, including:

  • AI21 Labs
  • Aleph Alpha GmbH
  • Alibaba Cloud
  • Amazon.com Inc.
  • Anthropic
  • Baidu Inc.
  • ByteDance Ltd.
  • Cohere
  • DeepSeek
  • Google LLC
  • Huawei Technologies Co. Ltd.
  • Inflection AI Inc.
  • Microsoft Corp.
  • Mistral AI
  • NVIDIA Corp.
  • OpenAI
  • Reka AI
  • SAP SE
  • SenseTime Group Inc.
  • Tencent Holdings Ltd.

Qualitative and quantitative analysis of companies has been conducted to help clients understand the wider business environment as well as the strengths and weaknesses of key industry players. Data is qualitatively analyzed to categorize companies as pure play, category-focused, industry-focused, and diversified; it is quantitatively analyzed to categorize companies as dominant, leading, strong, tentative, and weak.

Market Intelligence Radar: High-Impact Developments & Growth Signals

  • In the Application Software industry, the enforcement of stringent data privacy regulations, such as GDPR, has increased demand for closed-source foundation model that offer robust data sovereignty mandates and auditable regulatory compliance frameworks, making these features a critical differentiator.
  • The widespread adoption of cloud-based delivery models and subscription services has lowered the barrier to entry for enterprises, accelerating the uptake of closed-source foundation model through scalable model-as-a-service platforms and managed API access.
  • A surge in enterprise demand for advanced automation has directly fueled the need for closed-source foundation model capable of executing complex, autonomous agentic workflows, moving beyond simple task automation to full process orchestration.
  • Growing investments in data and analytics tools across enterprises create a significant pull for closed-source foundation model that can offer sophisticated, low-latency inference capabilities to process and derive insights from massive, unstructured datasets in real-time.

Dive into Technavio’s robust research methodology, blending expert interviews, extensive data synthesis, and validated models for unparalleled Closed-source Foundation Model Market insights. See full methodology.

Market Scope
Page number 311
Base year 2025
Historic period 2020-2024
Forecast period 2026-2030
Growth momentum & CAGR Accelerate at a CAGR of 41.1%
Market growth 2026-2030 USD 52150.2 million
Market structure Fragmented
YoY growth 2025-2026(%) 32.1%
Key countries US, Canada, Mexico, Germany, UK, France, Italy, Spain, The Netherlands, China, Japan, India, South Korea, Australia, Indonesia, Brazil, Argentina, Chile, Saudi Arabia, UAE, South Africa, Israel and Turkey
Competitive landscape Leading Companies, Market Positioning of Companies, Competitive Strategies, and Industry Risks

Request Free Sample

Research Analyst Overview

  • The market ecosystem is anchored by a few hardware suppliers providing essential GPUs, on which foundation model providers build their proprietary systems. Access is predominantly granted through cloud-based deployment via APIs, with over 80% of enterprise interactions occurring on major cloud platforms.
  • These providers, including major technology corporations and specialized AI labs, offer model-as-a-service platforms that allow enterprise developers and data scientists to integrate advanced AI without managing the underlying infrastructure. The value chain is heavily influenced by the providers' continuous R&D, which delivers performance improvements like a 10% reduction in model hallucination rates annually.
  • End-users across finance, healthcare, and marketing consume these services to enhance productivity, with regulatory bodies increasingly scrutinizing data provenance and model alignment.

What are the Key Data Covered in this Closed-source Foundation Model Market Research and Growth Report?

  • What is the expected growth of the Closed-source Foundation Model Market between 2026 and 2030?

    • The Closed-source Foundation Model Market is expected to grow by USD 52.15 billion during 2026-2030, registering a CAGR of 41.1%. Year-over-year growth in 2026 is estimated at 32.1%%. This acceleration is shaped by superior performance and frontier capabilities in complex reasoning, which is intensifying demand across multiple end-use verticals covered in the report.

  • What segmentation does the market report cover?

    • The report is segmented by Application (Content and marketing, Software and coding, Analytics and BI, Customer service AI, and Specialized enterprise), Technology (Transformer-based, Multimodal, Retrieval-augmented generation, Diffusion models, and Reinforcement learning), Deployment (Cloud, On premises, and Edge) and Geography (North America, Europe, APAC, South America, Middle East and Africa). Among these, the Content and marketing segment is estimated to witness significant growth during the forecast period, driven by rising adoption across key application areas. Each segment includes detailed qualitative and quantitative analysis, along with historical data from 2020-2024 and forecasts through 2030 with year-over-year growth rates.

  • Which regions are analyzed in the report?

    • The report covers North America, Europe, APAC, South America and Middle East and Africa. North America is estimated to contribute 37.4% to market growth during the forecast period. Country-level analysis includes US, Canada, Mexico, Germany, UK, France, Italy, Spain, The Netherlands, China, Japan, India, South Korea, Australia, Indonesia, Brazil, Argentina, Chile, Saudi Arabia, UAE, South Africa, Israel and Turkey, with dedicated market size tables and year-over-year growth for each.

  • What are the key growth drivers and market challenges?

    • The primary driver is superior performance and frontier capabilities in complex reasoning, which is accelerating investment and industry demand. The main challenge is escalating computational costs and sustainable resource allocation, creating operational barriers for key market participants. The report quantifies the impact of each driver and challenge across 2026 and 2030 with comparative analysis.

  • Who are the major players in the Closed-source Foundation Model Market?

    • Key vendors include AI21 Labs, Aleph Alpha GmbH, Alibaba Cloud, Amazon.com Inc., Anthropic, Baidu Inc., ByteDance Ltd., Cohere, DeepSeek, Google LLC, Huawei Technologies Co. Ltd., Inflection AI Inc., Microsoft Corp., Mistral AI, NVIDIA Corp., OpenAI, Reka AI, SAP SE, SenseTime Group Inc. and Tencent Holdings Ltd.. The report provides qualitative and quantitative analysis categorizing companies as dominant, leading, strong, tentative, and weak based on their market positioning. Company profiles include business segment analysis, SWOT assessment, key offerings, and recent strategic developments.

Market Research Insights

  • The competitive landscape is concentrated among a few dominant firms, with the top three players commanding over 70% of API call volume for enterprise-grade generative AI. Key players like Microsoft are pushing towards hyper-personalized computing experiences through strategic initiatives, such as developing personalized AI agents integrated directly into operating systems.
  • This move reflects a broader market trend toward deeper enterprise integration and specialization, addressing the escalating demand for industry-specific AI solutions that deliver tangible business outcomes, with some partnerships targeting a 20% improvement in workflow efficiency. These developments are a direct response to enterprise needs for enhanced productivity and compliance with regional data governance standards.
  • However, the high cost of R&D and intense competition for specialized talent remain significant challenges for all companies.

We can help! Our analysts can customize this closed-source foundation model market research report to meet your requirements.

Get in touch

1. Executive Summary

1.1 Market overview

Executive Summary - Chart on Market Overview
Executive Summary - Data Table on Market Overview
Executive Summary - Chart on Global Market Characteristics
Executive Summary - Chart on Market by Geography
Executive Summary - Chart on Market Segmentation by Application
Executive Summary - Chart on Market Segmentation by Technology
Executive Summary - Chart on Market Segmentation by Deployment
Executive Summary - Chart on Incremental Growth
Executive Summary - Data Table on Incremental Growth
Executive Summary - Chart on Company Market Positioning

2. Technavio Analysis

2.1 Analysis of price sensitivity, lifecycle, customer purchase basket, adoption rates, and purchase criteria

2.2 Criticality of inputs and Factors of differentiation

Chart on Overview on criticality of inputs and factors of differentiation

2.3 Factors of disruption

Chart on Overview on factors of disruption

2.4 Impact of drivers and challenges

Chart on Impact of drivers and challenges in 2025 and 2030

3. Market Landscape

3.1 Market ecosystem

Chart on Parent Market
Data Table on - Parent Market

3.2 Market characteristics

Chart on Market characteristics analysis

3.3 Value chain analysis

Chart on Value chain analysis

4. Market Sizing

4.1 Market definition

Data Table on Offerings of companies included in the market definition

4.2 Market segment analysis

Market segments

4.3 Market size 2025

4.4 Market outlook: Forecast for 2025-2030

Chart on Global - Market size and forecast 2025-2030 ($ million)
Data Table on Global - Market size and forecast 2025-2030 ($ million)
Chart on Global Market: Year-over-year growth 2025-2030 (%)
Data Table on Global Market: Year-over-year growth 2025-2030 (%)

5. Historic Market Size

5.1 Global Closed-Source Foundation Model Market 2020 - 2024

Historic Market Size - Data Table on Global Closed-Source Foundation Model Market 2020 - 2024 ($ million)

5.2 Application segment analysis 2020 - 2024

Historic Market Size - Application Segment 2020 - 2024 ($ million)

5.3 Technology segment analysis 2020 - 2024

Historic Market Size - Technology Segment 2020 - 2024 ($ million)

5.4 Deployment segment analysis 2020 - 2024

Historic Market Size - Deployment Segment 2020 - 2024 ($ million)

5.5 Geography segment analysis 2020 - 2024

Historic Market Size - Geography Segment 2020 - 2024 ($ million)

5.6 Country segment analysis 2020 - 2024

Historic Market Size - Country Segment 2020 - 2024 ($ million)

6. Qualitative Analysis

6.1 Impact of geopolitical conflicts on global closed-source foundation model market

7. Five Forces Analysis

7.1 Five forces summary

Five forces analysis - Comparison between 2025 and 2030

7.2 Bargaining power of buyers

Bargaining power of buyers - Impact of key factors 2025 and 2030

7.3 Bargaining power of suppliers

Bargaining power of suppliers - Impact of key factors in 2025 and 2030

7.4 Threat of new entrants

Threat of new entrants - Impact of key factors in 2025 and 2030

7.5 Threat of substitutes

Threat of substitutes - Impact of key factors in 2025 and 2030

7.6 Threat of rivalry

Threat of rivalry - Impact of key factors in 2025 and 2030

7.7 Market condition

Chart on Market condition - Five forces 2025 and 2030

8. Market Segmentation by Application

8.1 Market segments

Chart on Application - Market share 2025-2030 (%)
Data Table on Application - Market share 2025-2030 (%)

8.2 Comparison by Application

Chart on Comparison by Application
Data Table on Comparison by Application

8.3 Content and marketing - Market size and forecast 2025-2030

Chart on Content and marketing - Market size and forecast 2025-2030 ($ million)
Data Table on Content and marketing - Market size and forecast 2025-2030 ($ million)
Chart on Content and marketing - Year-over-year growth 2025-2030 (%)
Data Table on Content and marketing - Year-over-year growth 2025-2030 (%)

8.4 Software and coding - Market size and forecast 2025-2030

Chart on Software and coding - Market size and forecast 2025-2030 ($ million)
Data Table on Software and coding - Market size and forecast 2025-2030 ($ million)
Chart on Software and coding - Year-over-year growth 2025-2030 (%)
Data Table on Software and coding - Year-over-year growth 2025-2030 (%)

8.5 Analytics and BI - Market size and forecast 2025-2030

Chart on Analytics and BI - Market size and forecast 2025-2030 ($ million)
Data Table on Analytics and BI - Market size and forecast 2025-2030 ($ million)
Chart on Analytics and BI - Year-over-year growth 2025-2030 (%)
Data Table on Analytics and BI - Year-over-year growth 2025-2030 (%)

8.6 Customer service AI - Market size and forecast 2025-2030

Chart on Customer service AI - Market size and forecast 2025-2030 ($ million)
Data Table on Customer service AI - Market size and forecast 2025-2030 ($ million)
Chart on Customer service AI - Year-over-year growth 2025-2030 (%)
Data Table on Customer service AI - Year-over-year growth 2025-2030 (%)

8.7 Specialized enterprise - Market size and forecast 2025-2030

Chart on Specialized enterprise - Market size and forecast 2025-2030 ($ million)
Data Table on Specialized enterprise - Market size and forecast 2025-2030 ($ million)
Chart on Specialized enterprise - Year-over-year growth 2025-2030 (%)
Data Table on Specialized enterprise - Year-over-year growth 2025-2030 (%)

8.8 Market opportunity by Application

Market opportunity by Application ($ million)
Data Table on Market opportunity by Application ($ million)

9. Market Segmentation by Technology

9.1 Market segments

Chart on Technology - Market share 2025-2030 (%)
Data Table on Technology - Market share 2025-2030 (%)

9.2 Comparison by Technology

Chart on Comparison by Technology
Data Table on Comparison by Technology

9.3 Transformer-based - Market size and forecast 2025-2030

Chart on Transformer-based - Market size and forecast 2025-2030 ($ million)
Data Table on Transformer-based - Market size and forecast 2025-2030 ($ million)
Chart on Transformer-based - Year-over-year growth 2025-2030 (%)
Data Table on Transformer-based - Year-over-year growth 2025-2030 (%)

9.4 Multimodal - Market size and forecast 2025-2030

Chart on Multimodal - Market size and forecast 2025-2030 ($ million)
Data Table on Multimodal - Market size and forecast 2025-2030 ($ million)
Chart on Multimodal - Year-over-year growth 2025-2030 (%)
Data Table on Multimodal - Year-over-year growth 2025-2030 (%)

9.5 Retrieval-augmented generation - Market size and forecast 2025-2030

Chart on Retrieval-augmented generation - Market size and forecast 2025-2030 ($ million)
Data Table on Retrieval-augmented generation - Market size and forecast 2025-2030 ($ million)
Chart on Retrieval-augmented generation - Year-over-year growth 2025-2030 (%)
Data Table on Retrieval-augmented generation - Year-over-year growth 2025-2030 (%)

9.6 Diffusion models - Market size and forecast 2025-2030

Chart on Diffusion models - Market size and forecast 2025-2030 ($ million)
Data Table on Diffusion models - Market size and forecast 2025-2030 ($ million)
Chart on Diffusion models - Year-over-year growth 2025-2030 (%)
Data Table on Diffusion models - Year-over-year growth 2025-2030 (%)

9.7 Reinforcement learning - Market size and forecast 2025-2030

Chart on Reinforcement learning - Market size and forecast 2025-2030 ($ million)
Data Table on Reinforcement learning - Market size and forecast 2025-2030 ($ million)
Chart on Reinforcement learning - Year-over-year growth 2025-2030 (%)
Data Table on Reinforcement learning - Year-over-year growth 2025-2030 (%)

9.8 Market opportunity by Technology

Market opportunity by Technology ($ million)
Data Table on Market opportunity by Technology ($ million)

10. Market Segmentation by Deployment

10.1 Market segments

Chart on Deployment - Market share 2025-2030 (%)
Data Table on Deployment - Market share 2025-2030 (%)

10.2 Comparison by Deployment

Chart on Comparison by Deployment
Data Table on Comparison by Deployment

10.3 Cloud - Market size and forecast 2025-2030

Chart on Cloud - Market size and forecast 2025-2030 ($ million)
Data Table on Cloud - Market size and forecast 2025-2030 ($ million)
Chart on Cloud - Year-over-year growth 2025-2030 (%)
Data Table on Cloud - Year-over-year growth 2025-2030 (%)

10.4 On premises - Market size and forecast 2025-2030

Chart on On premises - Market size and forecast 2025-2030 ($ million)
Data Table on On premises - Market size and forecast 2025-2030 ($ million)
Chart on On premises - Year-over-year growth 2025-2030 (%)
Data Table on On premises - Year-over-year growth 2025-2030 (%)

10.5 Edge - Market size and forecast 2025-2030

Chart on Edge - Market size and forecast 2025-2030 ($ million)
Data Table on Edge - Market size and forecast 2025-2030 ($ million)
Chart on Edge - Year-over-year growth 2025-2030 (%)
Data Table on Edge - Year-over-year growth 2025-2030 (%)

10.6 Market opportunity by Deployment

Market opportunity by Deployment ($ million)
Data Table on Market opportunity by Deployment ($ million)

11. Customer Landscape

11.1 Customer landscape overview

Analysis of price sensitivity, lifecycle, customer purchase basket, adoption rates, and purchase criteria

12. Geographic Landscape

12.1 Geographic segmentation

Chart on Market share by geography 2025-2030 (%)
Data Table on Market share by geography 2025-2030 (%)

12.2 Geographic comparison

Chart on Geographic comparison
Data Table on Geographic comparison

12.3 North America - Market size and forecast 2025-2030

Chart on North America - Market size and forecast 2025-2030 ($ million)
Data Table on North America - Market size and forecast 2025-2030 ($ million)
Chart on North America - Year-over-year growth 2025-2030 (%)
Data Table on North America - Year-over-year growth 2025-2030 (%)
Chart on Regional Comparison - North America
Data Table on Regional Comparison - North America

12.3.1 US - Market size and forecast 2025-2030

Chart on US - Market size and forecast 2025-2030 ($ million)
Data Table on US - Market size and forecast 2025-2030 ($ million)
Chart on US - Year-over-year growth 2025-2030 (%)
Data Table on US - Year-over-year growth 2025-2030 (%)

12.3.2 Canada - Market size and forecast 2025-2030

Chart on Canada - Market size and forecast 2025-2030 ($ million)
Data Table on Canada - Market size and forecast 2025-2030 ($ million)
Chart on Canada - Year-over-year growth 2025-2030 (%)
Data Table on Canada - Year-over-year growth 2025-2030 (%)

12.3.3 Mexico - Market size and forecast 2025-2030

Chart on Mexico - Market size and forecast 2025-2030 ($ million)
Data Table on Mexico - Market size and forecast 2025-2030 ($ million)
Chart on Mexico - Year-over-year growth 2025-2030 (%)
Data Table on Mexico - Year-over-year growth 2025-2030 (%)

12.4 Europe - Market size and forecast 2025-2030

Chart on Europe - Market size and forecast 2025-2030 ($ million)
Data Table on Europe - Market size and forecast 2025-2030 ($ million)
Chart on Europe - Year-over-year growth 2025-2030 (%)
Data Table on Europe - Year-over-year growth 2025-2030 (%)
Chart on Regional Comparison - Europe
Data Table on Regional Comparison - Europe

12.4.1 Germany - Market size and forecast 2025-2030

Chart on Germany - Market size and forecast 2025-2030 ($ million)
Data Table on Germany - Market size and forecast 2025-2030 ($ million)
Chart on Germany - Year-over-year growth 2025-2030 (%)
Data Table on Germany - Year-over-year growth 2025-2030 (%)

12.4.2 UK - Market size and forecast 2025-2030

Chart on UK - Market size and forecast 2025-2030 ($ million)
Data Table on UK - Market size and forecast 2025-2030 ($ million)
Chart on UK - Year-over-year growth 2025-2030 (%)
Data Table on UK - Year-over-year growth 2025-2030 (%)

12.4.3 France - Market size and forecast 2025-2030

Chart on France - Market size and forecast 2025-2030 ($ million)
Data Table on France - Market size and forecast 2025-2030 ($ million)
Chart on France - Year-over-year growth 2025-2030 (%)
Data Table on France - Year-over-year growth 2025-2030 (%)

12.4.4 Italy - Market size and forecast 2025-2030

Chart on Italy - Market size and forecast 2025-2030 ($ million)
Data Table on Italy - Market size and forecast 2025-2030 ($ million)
Chart on Italy - Year-over-year growth 2025-2030 (%)
Data Table on Italy - Year-over-year growth 2025-2030 (%)

12.4.5 Spain - Market size and forecast 2025-2030

Chart on Spain - Market size and forecast 2025-2030 ($ million)
Data Table on Spain - Market size and forecast 2025-2030 ($ million)
Chart on Spain - Year-over-year growth 2025-2030 (%)
Data Table on Spain - Year-over-year growth 2025-2030 (%)

12.4.6 The Netherlands - Market size and forecast 2025-2030

Chart on The Netherlands - Market size and forecast 2025-2030 ($ million)
Data Table on The Netherlands - Market size and forecast 2025-2030 ($ million)
Chart on The Netherlands - Year-over-year growth 2025-2030 (%)
Data Table on The Netherlands - Year-over-year growth 2025-2030 (%)

12.5 APAC - Market size and forecast 2025-2030

Chart on APAC - Market size and forecast 2025-2030 ($ million)
Data Table on APAC - Market size and forecast 2025-2030 ($ million)
Chart on APAC - Year-over-year growth 2025-2030 (%)
Data Table on APAC - Year-over-year growth 2025-2030 (%)
Chart on Regional Comparison - APAC
Data Table on Regional Comparison - APAC

12.5.1 China - Market size and forecast 2025-2030

Chart on China - Market size and forecast 2025-2030 ($ million)
Data Table on China - Market size and forecast 2025-2030 ($ million)
Chart on China - Year-over-year growth 2025-2030 (%)
Data Table on China - Year-over-year growth 2025-2030 (%)

12.5.2 Japan - Market size and forecast 2025-2030

Chart on Japan - Market size and forecast 2025-2030 ($ million)
Data Table on Japan - Market size and forecast 2025-2030 ($ million)
Chart on Japan - Year-over-year growth 2025-2030 (%)
Data Table on Japan - Year-over-year growth 2025-2030 (%)

12.5.3 India - Market size and forecast 2025-2030

Chart on India - Market size and forecast 2025-2030 ($ million)
Data Table on India - Market size and forecast 2025-2030 ($ million)
Chart on India - Year-over-year growth 2025-2030 (%)
Data Table on India - Year-over-year growth 2025-2030 (%)

12.5.4 South Korea - Market size and forecast 2025-2030

Chart on South Korea - Market size and forecast 2025-2030 ($ million)
Data Table on South Korea - Market size and forecast 2025-2030 ($ million)
Chart on South Korea - Year-over-year growth 2025-2030 (%)
Data Table on South Korea - Year-over-year growth 2025-2030 (%)

12.5.5 Australia - Market size and forecast 2025-2030

Chart on Australia - Market size and forecast 2025-2030 ($ million)
Data Table on Australia - Market size and forecast 2025-2030 ($ million)
Chart on Australia - Year-over-year growth 2025-2030 (%)
Data Table on Australia - Year-over-year growth 2025-2030 (%)

12.5.6 Indonesia - Market size and forecast 2025-2030

Chart on Indonesia - Market size and forecast 2025-2030 ($ million)
Data Table on Indonesia - Market size and forecast 2025-2030 ($ million)
Chart on Indonesia - Year-over-year growth 2025-2030 (%)
Data Table on Indonesia - Year-over-year growth 2025-2030 (%)

12.6 South America - Market size and forecast 2025-2030

Chart on South America - Market size and forecast 2025-2030 ($ million)
Data Table on South America - Market size and forecast 2025-2030 ($ million)
Chart on South America - Year-over-year growth 2025-2030 (%)
Data Table on South America - Year-over-year growth 2025-2030 (%)
Chart on Regional Comparison - South America
Data Table on Regional Comparison - South America

12.6.1 Brazil - Market size and forecast 2025-2030

Chart on Brazil - Market size and forecast 2025-2030 ($ million)
Data Table on Brazil - Market size and forecast 2025-2030 ($ million)
Chart on Brazil - Year-over-year growth 2025-2030 (%)
Data Table on Brazil - Year-over-year growth 2025-2030 (%)

12.6.2 Argentina - Market size and forecast 2025-2030

Chart on Argentina - Market size and forecast 2025-2030 ($ million)
Data Table on Argentina - Market size and forecast 2025-2030 ($ million)
Chart on Argentina - Year-over-year growth 2025-2030 (%)
Data Table on Argentina - Year-over-year growth 2025-2030 (%)

12.6.3 Chile - Market size and forecast 2025-2030

Chart on Chile - Market size and forecast 2025-2030 ($ million)
Data Table on Chile - Market size and forecast 2025-2030 ($ million)
Chart on Chile - Year-over-year growth 2025-2030 (%)
Data Table on Chile - Year-over-year growth 2025-2030 (%)

12.7 Middle East and Africa - Market size and forecast 2025-2030

Chart on Middle East and Africa - Market size and forecast 2025-2030 ($ million)
Data Table on Middle East and Africa - Market size and forecast 2025-2030 ($ million)
Chart on Middle East and Africa - Year-over-year growth 2025-2030 (%)
Data Table on Middle East and Africa - Year-over-year growth 2025-2030 (%)
Chart on Regional Comparison - Middle East and Africa
Data Table on Regional Comparison - Middle East and Africa

12.7.1 Saudi Arabia - Market size and forecast 2025-2030

Chart on Saudi Arabia - Market size and forecast 2025-2030 ($ million)
Data Table on Saudi Arabia - Market size and forecast 2025-2030 ($ million)
Chart on Saudi Arabia - Year-over-year growth 2025-2030 (%)
Data Table on Saudi Arabia - Year-over-year growth 2025-2030 (%)

12.7.2 UAE - Market size and forecast 2025-2030

Chart on UAE - Market size and forecast 2025-2030 ($ million)
Data Table on UAE - Market size and forecast 2025-2030 ($ million)
Chart on UAE - Year-over-year growth 2025-2030 (%)
Data Table on UAE - Year-over-year growth 2025-2030 (%)

12.7.3 South Africa - Market size and forecast 2025-2030

Chart on South Africa - Market size and forecast 2025-2030 ($ million)
Data Table on South Africa - Market size and forecast 2025-2030 ($ million)
Chart on South Africa - Year-over-year growth 2025-2030 (%)
Data Table on South Africa - Year-over-year growth 2025-2030 (%)

12.7.4 Israel - Market size and forecast 2025-2030

Chart on Israel - Market size and forecast 2025-2030 ($ million)
Data Table on Israel - Market size and forecast 2025-2030 ($ million)
Chart on Israel - Year-over-year growth 2025-2030 (%)
Data Table on Israel - Year-over-year growth 2025-2030 (%)

12.7.5 Turkey - Market size and forecast 2025-2030

Chart on Turkey - Market size and forecast 2025-2030 ($ million)
Data Table on Turkey - Market size and forecast 2025-2030 ($ million)
Chart on Turkey - Year-over-year growth 2025-2030 (%)
Data Table on Turkey - Year-over-year growth 2025-2030 (%)

12.8 Market opportunity by geography

Market opportunity by geography ($ million)
Data Tables on Market opportunity by geography ($ million)

13. Drivers, Challenges, and Opportunity

13.1 Market drivers

Superior performance and frontier capabilities in complex reasoning
Rigorous data security and regulatory compliance frameworks
Lower operational complexity and faster time-to-market

13.2 Market challenges

Escalating computational costs and sustainable resource allocation
Increasing competitive pressure from high-performance open-source alternatives
Complexity of intellectual property rights and training data provenance

13.3 Impact of drivers and challenges

Impact of drivers and challenges in 2025 and 2030

13.4 Market opportunities

Proliferation of verticalized and domain-specific proprietary solutions
Expansion of sovereign AI initiatives and regional data localization
Integration of advanced multimodal orchestration and agentic workflows

14. Competitive Landscape

14.1 Overview

14.2

Overview on criticality of inputs and factors of differentiation

14.3 Landscape disruption

Overview on factors of disruption

14.4 Industry risks

Impact of key risks on business

15. Competitive Analysis

15.1 Companies profiled

Companies covered

15.2 Company ranking index

15.3 Market positioning of companies

Matrix on companies position and classification

15.4 Alibaba Cloud

Alibaba Cloud - Overview
Alibaba Cloud - Product / Service
Alibaba Cloud - Key offerings
SWOT

15.5 Amazon.com Inc.

Amazon.com Inc. - Overview
Amazon.com Inc. - Business segments
Amazon.com Inc. - Key news
Amazon.com Inc. - Key offerings
Amazon.com Inc. - Segment focus
SWOT

15.6 Baidu Inc.

Baidu Inc. - Overview
Baidu Inc. - Business segments
Baidu Inc. - Key news
Baidu Inc. - Key offerings
Baidu Inc. - Segment focus
SWOT

15.7 ByteDance Ltd.

ByteDance Ltd. - Overview
ByteDance Ltd. - Product / Service
ByteDance Ltd. - Key offerings
SWOT

15.8 DeepSeek

DeepSeek - Overview
DeepSeek - Product / Service
DeepSeek - Key offerings
SWOT

15.9 Google LLC

Google LLC - Overview
Google LLC - Product / Service
Google LLC - Key offerings
SWOT

15.10 Huawei Technologies Co. Ltd.

Huawei Technologies Co. Ltd. - Overview
Huawei Technologies Co. Ltd. - Product / Service
Huawei Technologies Co. Ltd. - Key offerings
SWOT

15.11 Inflection AI Inc.

Inflection AI Inc. - Overview
Inflection AI Inc. - Product / Service
Inflection AI Inc. - Key offerings
SWOT

15.12 Microsoft Corp.

Microsoft Corp. - Overview
Microsoft Corp. - Business segments
Microsoft Corp. - Key news
Microsoft Corp. - Key offerings
Microsoft Corp. - Segment focus
SWOT

15.13 Mistral AI

Mistral AI - Overview
Mistral AI - Product / Service
Mistral AI - Key offerings
SWOT

15.14 NVIDIA Corp.

NVIDIA Corp. - Overview
NVIDIA Corp. - Business segments
NVIDIA Corp. - Key news
NVIDIA Corp. - Key offerings
NVIDIA Corp. - Segment focus
SWOT

15.15 OpenAI

OpenAI - Overview
OpenAI - Product / Service
OpenAI - Key offerings
SWOT

15.16 SAP SE

SAP SE - Overview
SAP SE - Business segments
SAP SE - Key news
SAP SE - Key offerings
SAP SE - Segment focus
SWOT

15.17 SenseTime Group Inc.

SenseTime Group Inc. - Overview
SenseTime Group Inc. - Product / Service
SenseTime Group Inc. - Key offerings
SWOT

15.18 Tencent Holdings Ltd.

Tencent Holdings Ltd. - Overview
Tencent Holdings Ltd. - Business segments
Tencent Holdings Ltd. - Key offerings
Tencent Holdings Ltd. - Segment focus
SWOT

16. Appendix

16.1 Scope of the report

Market definition
Objectives
Notes and caveats

16.2 Inclusions and exclusions checklist

Inclusions checklist
Exclusions checklist

16.3 Currency conversion rates for US$

16.4 Research methodology

16.5 Data procurement

Information sources

16.6 Data validation

16.7 Validation techniques employed for market sizing

16.8 Data synthesis

16.9 360 degree market analysis

16.10 List of abbreviations

Research Methodology

Technavio presents a detailed picture of the market by way of study, synthesis, and summation of data from multiple sources. The analysts have presented the various facets of the market with a particular focus on identifying the key industry influencers. The data thus presented is comprehensive, reliable, and the result of extensive research, both primary and secondary.

INFORMATION SOURCES

Primary sources

  • Manufacturers and suppliers
  • Channel partners
  • Industry experts
  • Strategic decision makers

Secondary sources

  • Industry journals and periodicals
  • Government data
  • Financial reports of key industry players
  • Historical data
  • Press releases

DATA ANALYSIS

Data Synthesis

  • Collation of data
  • Estimation of key figures
  • Analysis of derived insights

Data Validation

  • Triangulation with data models
  • Reference against proprietary databases
  • Corroboration with industry experts

REPORT WRITING

Qualitative

  • Market drivers
  • Market challenges
  • Market trends
  • Five forces analysis

Quantitative

  • Market size and forecast
  • Market segmentation
  • Geographical insights
  • Competitive landscape

Interested in this report?

Get your sample now to see our research methodology and insights!

Download Now

Frequently Asked Questions

Closed-source Foundation Model market growth will increase by USD 52150.2 million during 2026-2030.

The Closed-source Foundation Model market is expected to grow at a CAGR of 41.1% during 2026-2030.

Closed-source Foundation Model market is segmented by Application (Content and marketing, Software and coding, Analytics and BI, Customer service AI, Specialized enterprise) Technology (Transformer-based, Multimodal, Retrieval-augmented generation, Diffusion models, Reinforcement learning) Deployment (Cloud, On premises, Edge)

AI21 Labs, Aleph Alpha GmbH, Alibaba Cloud, Amazon.com Inc., Anthropic, Baidu Inc., ByteDance Ltd., Cohere, DeepSeek, Google LLC, Huawei Technologies Co. Ltd., Inflection AI Inc., Microsoft Corp., Mistral AI, NVIDIA Corp., OpenAI, Reka AI, SAP SE, SenseTime Group Inc., Tencent Holdings Ltd. are a few of the key vendors in the Closed-source Foundation Model market.

North America will register the highest growth rate of 37.4% among the other regions. Therefore, the Closed-source Foundation Model market in North America is expected to garner significant business opportunities for the vendors during the forecast period.

US, Canada, Mexico, Germany, UK, France, Italy, Spain, The Netherlands, China, Japan, India, South Korea, Australia, Indonesia, Brazil, Argentina, Chile, Saudi Arabia, UAE, South Africa, Israel, Turkey

  • Superior performance and frontier capabilities in complex reasoning is the driving factor this market.

The Closed-source Foundation Model market vendors should focus on grabbing business opportunities from the Application segment as it accounted for the largest market share in the base year.
RIA - Research AI Assistant
Ask RIA