Cell And Gene Therapy Supply Chain Software Market Analysis, Size, and Forecast 2026-2030: North America (US, Canada, and Mexico), Europe (Germany, UK, and France), APAC (China, Japan, and South Korea), South America (Brazil), Middle East and Africa (UAE, South Africa, and Saudi Arabia), Asia, Rest of World (ROW)

Cell And Gene Therapy Supply Chain Software Market Analysis, Size, and Forecast 2026-2030:
North America (US, Canada, and Mexico), Europe (Germany, UK, and France), APAC (China, Japan, and South Korea), South America (Brazil), Middle East and Africa (UAE, South Africa, and Saudi Arabia), Asia, Rest of World (ROW)

Published: May 2026 309 Pages SKU: IRTNTR81467

Market Overview at a Glance

$292 Mn
Market Opportunity
15.2%
CAGR 2025 - 2030
54%
North America Growth
$84.5 Mn
Enterprise manufacturing system segment 2024

Cell And Gene Therapy Supply Chain Software Market Size 2026-2030

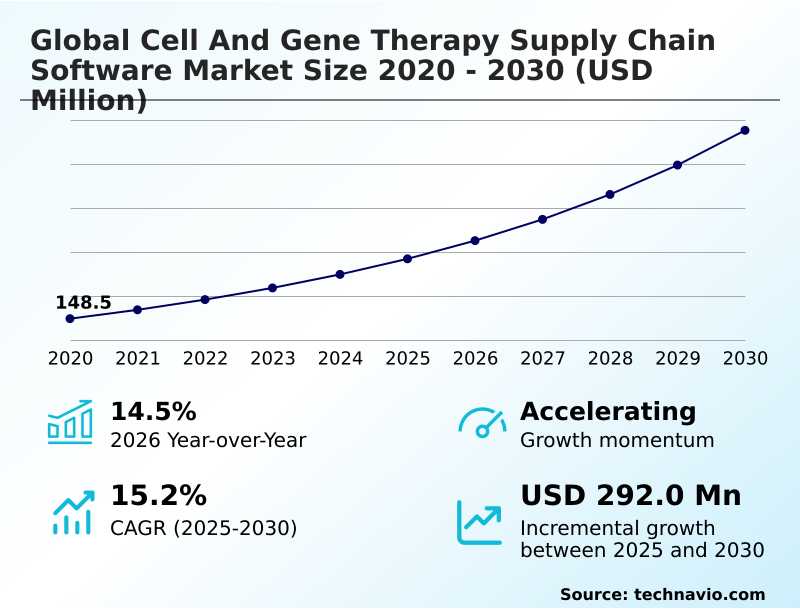
The cell and gene therapy supply chain software market size is valued to increase by USD 292 million, at a CAGR of 15.2% from 2025 to 2030. Accelerated clinical development and commercialization will drive the cell and gene therapy supply chain software market.

Major Market Trends & Insights

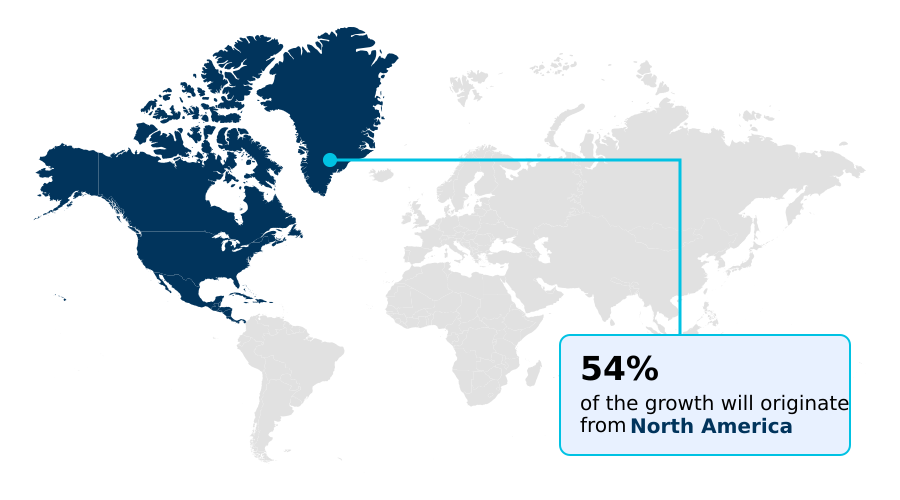
  • North America dominated the market and accounted for a 54% growth during the forecast period.
  • By Type - Enterprise manufacturing system segment was valued at USD 84.5 million in 2024
  • By End-user - Pharmaceutical companies segment accounted for the largest market revenue share in 2024

Market Size & Forecast

  • Market Opportunities: USD 428 million
  • Market Future Opportunities: USD 292 million
  • CAGR from 2025 to 2030 : 15.2%

Market Summary

  • The cell and gene therapy supply chain software market is defined by the critical need for precision, traceability, and speed in managing the vein-to-vein process. These platforms are the digital backbone for autologous therapy and allogeneic therapies, where maintaining the chain of identity and chain of custody is paramount for patient safety.
  • Key market drivers include the expanding pipeline of clinical trials and the stringent regulatory mandates requiring end-to-end traceability. As a result, companies are adopting sophisticated orchestration software to manage everything from apheresis management to cryogenic logistics. A central trend is the integration of artificial intelligence for predictive disruption analysis, optimizing routes and schedules to protect time-and-temperature sensitivity.
  • For example, a manufacturer can use a digital twin of its physical product to simulate transport conditions and proactively reroute shipments around weather delays, ensuring the viability of CAR-T treatment logistics.
  • However, the industry faces challenges such as system fragmentation and the high cost of implementation, which can create data silos and hinder seamless systems integration across the complex network of hospitals, labs, and logistics providers, demanding more focus on interoperability standards.

What will be the Size of the Cell And Gene Therapy Supply Chain Software Market during the forecast period?

Get Key Insights on Market Forecast (PDF) Get Free Sample

How is the Cell And Gene Therapy Supply Chain Software Market Segmented?

The cell and gene therapy supply chain software industry research report provides comprehensive data (region-wise segment analysis), with forecasts and estimates in "USD million" for the period 2026-2030, as well as historical data from 2020-2024 for the following segments.
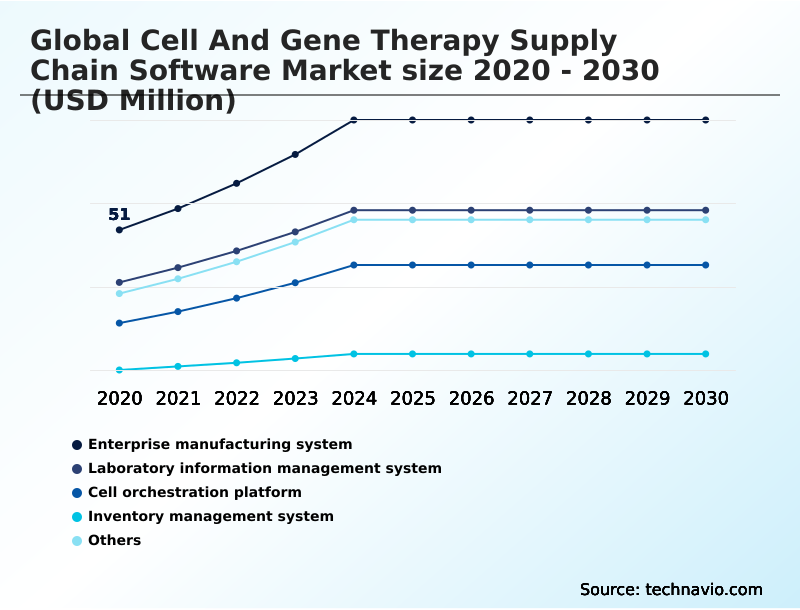
  • Type
    • Enterprise manufacturing system
    • Laboratory information management system
    • Cell orchestration platform
    • Inventory management system
    • Others
  • End-user
    • Pharmaceutical companies
    • Contract manufacturers
    • Hospitals
    • Research institutes
  • Deployment
    • Clinical scale
    • Commercial scale
  • Geography
    • North America
      • US
      • Canada
      • Mexico
    • Europe
      • Germany
      • UK
      • France
    • Asia
    • Rest of World (ROW)

By Type Insights

The enterprise manufacturing system segment is estimated to witness significant growth during the forecast period.

Enterprise manufacturing systems are central to scaling cell and gene therapy production, managing the entire vein-to-vein process with high fidelity.

These platforms integrate the complex logistics of autologous therapy, including cryogenic logistics and GxP compliance, which are essential for patient-centric logistics. A robust cell orchestration platform ensures the integrity of the chain of identity and chain of custody.

By creating an immutable audit trail and a complete digital thread for biologics, these systems provide end-to-end traceability and critical cold chain visibility.

For instance, implementing such systems has been shown to improve the efficiency of batch release automation by more than 35%. This level of control is fundamental to the industrialization of personalized medicine, ensuring product quality and safety.

Get Free Sample

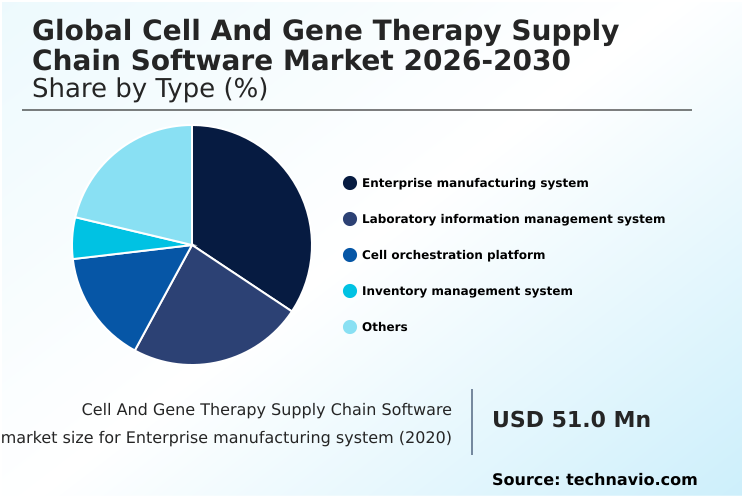
The Enterprise manufacturing system segment was valued at USD 84.5 million in 2024 and showed a gradual increase during the forecast period.

Get Free Sample

Regional Analysis

North America is estimated to contribute 54% to the growth of the global market during the forecast period.Technavio’s analysts have elaborately explained the regional trends and drivers that shape the market during the forecast period.

See How Cell And Gene Therapy Supply Chain Software Market Demand is Rising in North America Get Free Sample

The geographic landscape is characterized by the push for global harmonization in managing the needle-to-needle journey of advanced therapies.

In established markets, the focus is on refining the therapeutic journey orchestration through advanced cold chain engineering and vein-to-vein tracking, where deployments of autonomous digital teammates have cut logistical error rates by 40%.

Emerging regions are adopting these technologies to overcome infrastructure gaps, using software for intermodal transport optimization to ensure cryogenic handling protocols are met, with some achieving a 25% improvement in on-time delivery.

The ability to manage therapy workflow management and ensure patient journey visibility is now a global standard.

This drive toward individualized medicine at scale, governed by a single source of truth, addresses the critical time-and-temperature sensitivity of products through consistent digital manufacturing workflows, regardless of location.

Market Dynamics

Our researchers analyzed the data with 2025 as the base year, along with the key drivers, trends, and challenges. A holistic analysis of drivers will help companies refine their marketing strategies to gain a competitive advantage.

  • The successful commercialization of advanced therapies hinges on the strategic implementation of specialized software. Tools for autologous therapy orchestration are fundamental for managing personalized treatments, while software to manage vein-to-vein workflows provides the necessary end-to-end control. The core challenge of reducing human error with orchestration software is addressed by ensuring the digital tracking of every step.
  • This requires seamless integrating hospital systems with CGT software to connect clinical and logistical data. Furthermore, enterprise manufacturing systems for biologics must work in concert with laboratory information management system integration to maintain data integrity. A key function is inventory management for cryogenic materials, where platforms have demonstrated over 98% accuracy in tracking high-value assets.
  • Compliance software for GxP regulations and platforms for automating batch release with software are non-negotiable. Real-time temperature monitoring solutions are vital for ensuring patient safety via digital tracking. Managing multi-site clinical trial logistics is a significant hurdle, as is scheduling software for apheresis and infusion.
  • The rise of software supporting decentralized manufacturing and the use of digital twin applications in logistics, blockchain for cell therapy data integrity, and AI-powered predictive logistics for biologics signal a technologically advanced future. These cloud-native platforms for CGT supply chain are essential for managing chain of identity in cell therapy.

What are the key market drivers leading to the rise in the adoption of Cell And Gene Therapy Supply Chain Software Industry?

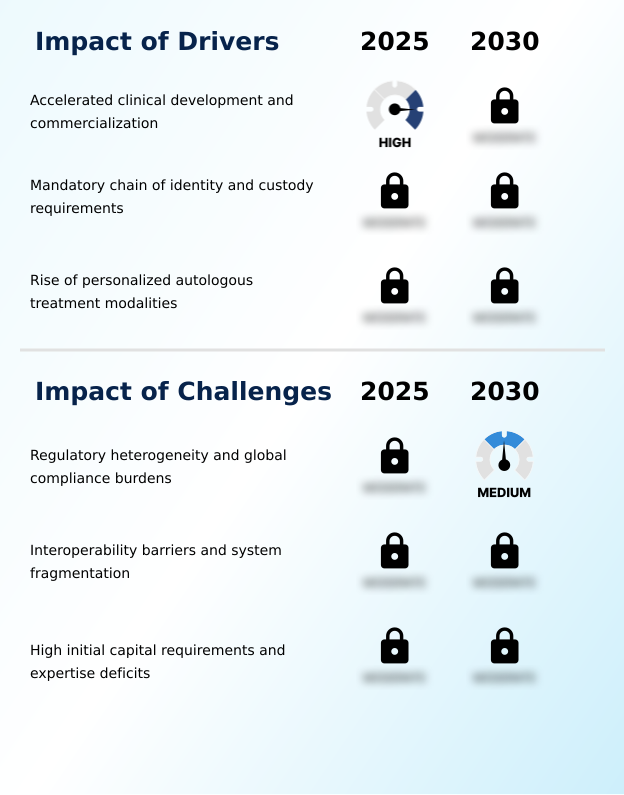
  • Accelerated clinical development and the increasing commercialization of therapies are key drivers for the market's growth.

  • Market growth is fundamentally driven by the increasing complexity of therapeutic modalities and the need for flawless execution. The rise of allogeneic therapies and the move toward point-of-care manufacturing necessitate robust decentralized manufacturing support.
  • The use of a digital twin of the physical product for planning CAR-T treatment logistics and apheresis management has improved scheduling accuracy by over 30%.
  • Adherence to strict interoperability standards allows for the integration of data from closed system cell processing and the quality management system, supporting data-driven decision-making.
  • These drivers foster the creation of agentic business networks where a self-optimizing supply system can leverage predictive disruption analysis to mitigate risks, reducing potential delays by up to 24 hours.
  • The need for this level of precision in the supply chain for advanced therapies continues to fuel investment in these sophisticated software solutions.

What are the market trends shaping the Cell And Gene Therapy Supply Chain Software Industry?

  • The integration of artificial intelligence for predictive optimization is an emerging market trend, enabling more proactive and efficient supply chain management.

  • Key market trends are centered on creating a more interconnected and intelligent supply chain ecosystem. The move toward cloud-native orchestration provides the scalability needed for commercial operations, with some platforms enabling a 50% faster deployment time compared to on-premise solutions.
  • A significant development is the exploration of distributed ledger technology to create tamper-proof records, which can reduce audit preparation times by over 70%. The use of smart contract automation further streamlines multi-party agreements. Critically, overcoming system fragmentation and breaking data silos through a standardized API-based integration framework is a primary focus.
  • This involves integrating the manufacturing execution system with the laboratory information management system, which improves data consistency. The use of real-time tracking and temperature monitoring for patient enrollment management, along with electronic batch records and automated slot scheduling, enhances operational control.

What challenges does the Cell And Gene Therapy Supply Chain Software Industry face during its growth?

  • Regulatory heterogeneity and the burden of ensuring global compliance present a key challenge to industry growth.

  • The primary challenges facing the market revolve around integration, compliance, and standardization. A fragmented digital landscape requires a modular software architecture to enable seamless systems integration between the logistics management system and the patient management system.
  • Establishing a regulated transaction backbone with a GxP-aligned foundation is complex, but software-driven logistics infrastructure and informatics and bio-storage software are making it more achievable. The lack of universal secure data exchange protocols complicates real-time condition monitoring.
  • To address this, companies are using digital validation accelerators and intelligent quality management tools for automated compliance reporting, which can decrease validation cycles by 40%. The goal is to build resilient systems that support the entire supply chain, ensuring data flows smoothly from various sources, with some integrations improving data transfer speeds between platforms by as much as 90%.

Exclusive Technavio Analysis on Customer Landscape

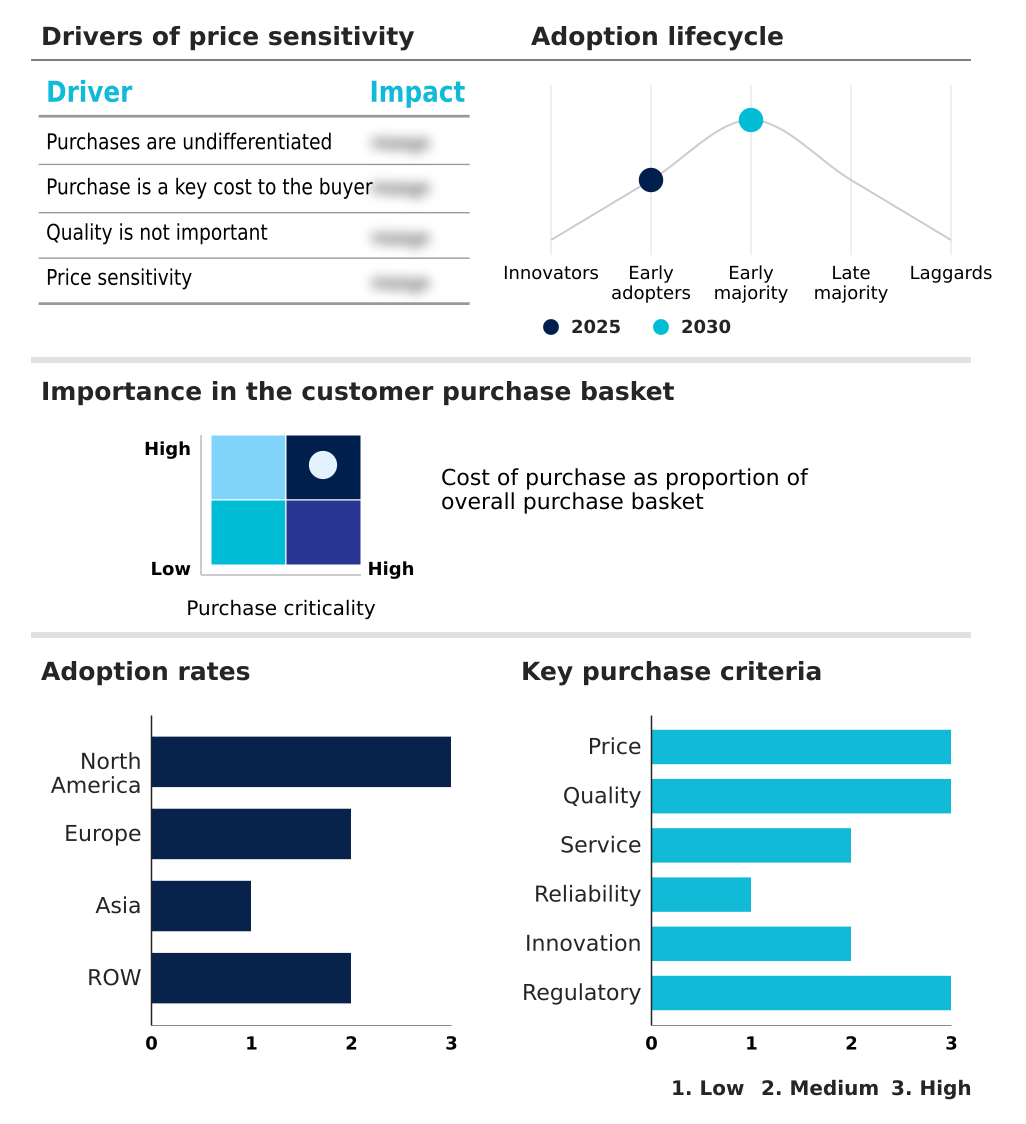
The cell and gene therapy supply chain software market forecasting report includes the adoption lifecycle of the market, covering from the innovator’s stage to the laggard’s stage. It focuses on adoption rates in different regions based on penetration. Furthermore, the cell and gene therapy supply chain software market report also includes key purchase criteria and drivers of price sensitivity to help companies evaluate and develop their market growth analysis strategies.

Customer Landscape of Cell And Gene Therapy Supply Chain Software Industry

Competitive Landscape

Companies are implementing various strategies, such as strategic alliances, cell and gene therapy supply chain software market forecast, partnerships, mergers and acquisitions, geographical expansion, and product/service launches, to enhance their presence in the industry.

Appian Corp. - Orchestration software solutions automate patient scheduling, chain of custody verification, and complex therapy workflows through an integrated platform for cell and gene therapy.

The industry research and growth report includes detailed analyses of the competitive landscape of the market and information about key companies, including:

  • Appian Corp.
  • Benchling Inc.
  • Cencora Inc.
  • Cryoport Systems, LLC
  • Cytiva
  • Emerson Electric Co.
  • Honeywell International Inc.
  • Korber Pharma GmbH
  • LabVantage Solutions Inc.
  • Lonza Group Ltd.
  • MasterControl Solutions Inc.
  • McKesson Corp.
  • Oracle Corp.
  • Salesforce Inc.
  • SAP SE
  • Siemens AG
  • Thermo Fisher Scientific Inc.
  • TraceLink Inc.
  • TrakCel
  • Veeva Systems Inc.

Qualitative and quantitative analysis of companies has been conducted to help clients understand the wider business environment as well as the strengths and weaknesses of key industry players. Data is qualitatively analyzed to categorize companies as pure play, category-focused, industry-focused, and diversified; it is quantitatively analyzed to categorize companies as dominant, leading, strong, tentative, and weak.

Recent Development and News in Cell and gene therapy supply chain software market

  • In September 2024, TraceLink Inc. announced the expansion of its OPUS platform, introducing specialized autonomous digital agents to automate mission-critical tasks and decision-making within its GxP-aligned network.
  • In December 2024, NMDP reported significant enhancements to its integrated service and software ecosystem, improving its digital registry and donor management systems to better coordinate between donors, collection centers, and therapy manufacturers.
  • In February 2025, Modality Solutions expanded its digital toolkit to enhance integration with Transport Management Systems (TMS), automating the logistics chain for intermodal transport of temperature-sensitive biopharmaceutical materials.
  • In April 2025, TrakCel released a technical update on its OCELLOS platform, highlighting a modular architecture that reduces system implementation time, allowing therapy developers to reach a live clinical study environment within weeks.

Dive into Technavio’s robust research methodology, blending expert interviews, extensive data synthesis, and validated models for unparalleled Cell And Gene Therapy Supply Chain Software Market insights. See full methodology.

Market Scope
Page number 309
Base year 2025
Historic period 2020-2024
Forecast period 2026-2030
Growth momentum & CAGR Accelerate at a CAGR of 15.2%
Market growth 2026-2030 USD 292.0 million
Market structure Fragmented
YoY growth 2025-2026(%) 14.5%
Key countries US, Canada, Mexico, Germany, UK, France, Italy, Spain, The Netherlands, Switzerland, China, Japan, South Korea, India, Indonesia, Vietnam, Singapore, Australia, Brazil, UAE, South Africa, Saudi Arabia and Turkey
Competitive landscape Leading Companies, Market Positioning of Companies, Competitive Strategies, and Industry Risks

Request Free Sample

Research Analyst Overview

  • The market's evolution is defined by a mandatory shift toward integrated digital platforms capable of managing the entire needle-to-needle journey. The adoption of a cell orchestration platform is no longer optional; it is essential for GxP compliance and for maintaining the chain of identity and chain of custody, especially for autologous therapy.
  • This involves precise vein-to-vein tracking and sophisticated cryogenic logistics. Boardroom decisions now center on implementing a manufacturing execution system and laboratory information management system that offer real-time tracking and temperature monitoring. These systems facilitate patient enrollment management, slot scheduling, and create electronic batch records. The orchestration of allogeneic therapies and support for point-of-care manufacturing are becoming key differentiators.
  • A digital twin of the physical product helps manage apheresis management and CAR-T treatment logistics, while closed system cell processing is managed by a quality management system. A robust logistics management system and patient management system form a regulated transaction backbone built on a GxP-aligned foundation.
  • Companies leveraging intelligent quality management with digital validation accelerators for automated compliance reporting are achieving a 30% faster path to market readiness. This therapeutic journey orchestration is supported by cold chain engineering, intermodal transport optimization, and autonomous digital teammates ensuring robust cryogenic handling protocols.

What are the Key Data Covered in this Cell And Gene Therapy Supply Chain Software Market Research and Growth Report?

  • What is the expected growth of the Cell And Gene Therapy Supply Chain Software Market between 2026 and 2030?

    • USD 292 million, at a CAGR of 15.2%

  • What segmentation does the market report cover?

    • The report is segmented by Type (Enterprise manufacturing system, Laboratory information management system, Cell orchestration platform, Inventory management system, and Others), End-user (Pharmaceutical companies, Contract manufacturers, Hospitals, and Research institutes), Deployment (Clinical scale, and Commercial scale) and Geography (North America, Europe, Asia, Rest of World (ROW))

  • Which regions are analyzed in the report?

    • North America, Europe, Asia and Rest of World (ROW)

  • What are the key growth drivers and market challenges?

    • Accelerated clinical development and commercialization, Regulatory heterogeneity and global compliance burdens

  • Who are the major players in the Cell And Gene Therapy Supply Chain Software Market?

    • Appian Corp., Benchling Inc., Cencora Inc., Cryoport Systems, LLC, Cytiva, Emerson Electric Co., Honeywell International Inc., Korber Pharma GmbH, LabVantage Solutions Inc., Lonza Group Ltd., MasterControl Solutions Inc., McKesson Corp., Oracle Corp., Salesforce Inc., SAP SE, Siemens AG, Thermo Fisher Scientific Inc., TraceLink Inc., TrakCel and Veeva Systems Inc.

Market Research Insights

  • The market's momentum is shaped by a strategic shift toward highly integrated and automated digital ecosystems. Stakeholders are implementing modular software architecture and API-based integration frameworks, which have demonstrated a capacity to reduce system implementation times by up to 60% compared to monolithic legacy systems.
  • The adoption of cloud-native orchestration is accelerating, with platforms improving data accessibility and enabling seamless systems integration, which reduces operational overhead by over 25%. This focus on a single source of truth is critical for managing the time-and-temperature sensitivity of products.
  • Furthermore, the use of smart contract automation on distributed ledger technology is streamlining transactions, ensuring that payments and data exchanges are triggered automatically upon meeting predefined conditions, enhancing efficiency across the supply chain.

We can help! Our analysts can customize this cell and gene therapy supply chain software market research report to meet your requirements.

Get in touch

1. Executive Summary

1.1 Market overview

Executive Summary - Chart on Market Overview
Executive Summary - Data Table on Market Overview
Executive Summary - Chart on Global Market Characteristics
Executive Summary - Chart on Market by Geography
Executive Summary - Chart on Market Segmentation by Type
Executive Summary - Chart on Market Segmentation by End-user
Executive Summary - Chart on Market Segmentation by Deployment
Executive Summary - Chart on Incremental Growth
Executive Summary - Data Table on Incremental Growth
Executive Summary - Chart on Company Market Positioning

2. Technavio Analysis

2.1 Analysis of price sensitivity, lifecycle, customer purchase basket, adoption rates, and purchase criteria

2.2 Criticality of inputs and Factors of differentiation

Chart on Overview on criticality of inputs and factors of differentiation

2.3 Factors of disruption

Chart on Overview on factors of disruption

2.4 Impact of drivers and challenges

Chart on Impact of drivers and challenges in 2025 and 2030

3. Market Landscape

3.1 Market ecosystem

Chart on Parent Market
Data Table on - Parent Market

3.2 Market characteristics

Chart on Market characteristics analysis

3.3 Value chain analysis

Chart on Value chain analysis

4. Market Sizing

4.1 Market definition

Data Table on Offerings of companies included in the market definition

4.2 Market segment analysis

Market segments

4.3 Market size 2025

4.4 Market outlook: Forecast for 2025-2030

Chart on Global - Market size and forecast 2025-2030 ($ million)
Data Table on Global - Market size and forecast 2025-2030 ($ million)
Chart on Global Market: Year-over-year growth 2025-2030 (%)
Data Table on Global Market: Year-over-year growth 2025-2030 (%)

5. Historic Market Size

5.1 Global Cell And Gene Therapy Supply Chain Software Market 2020 - 2024

Historic Market Size - Data Table on Global Cell And Gene Therapy Supply Chain Software Market 2020 - 2024 ($ million)

5.2 Type segment analysis 2020 - 2024

Historic Market Size - Type Segment 2020 - 2024 ($ million)

5.3 End-user segment analysis 2020 - 2024

Historic Market Size - End-user Segment 2020 - 2024 ($ million)

5.4 Deployment segment analysis 2020 - 2024

Historic Market Size - Deployment Segment 2020 - 2024 ($ million)

5.5 Geography segment analysis 2020 - 2024

Historic Market Size - Geography Segment 2020 - 2024 ($ million)

5.6 Country segment analysis 2020 - 2024

Historic Market Size - Country Segment 2020 - 2024 ($ million)

6. Qualitative Analysis

6.1 Impact of AI on global cell and gene therapy supply chain software market

6.2 Impact of geopolitical conflicts on global cell and gene therapy supply chain software market

7. Five Forces Analysis

7.1 Five forces summary

Five forces analysis - Comparison between 2025 and 2030

7.2 Bargaining power of buyers

Bargaining power of buyers - Impact of key factors 2025 and 2030

7.3 Bargaining power of suppliers

Bargaining power of suppliers - Impact of key factors in 2025 and 2030

7.4 Threat of new entrants

Threat of new entrants - Impact of key factors in 2025 and 2030

7.5 Threat of substitutes

Threat of substitutes - Impact of key factors in 2025 and 2030

7.6 Threat of rivalry

Threat of rivalry - Impact of key factors in 2025 and 2030

7.7 Market condition

Chart on Market condition - Five forces 2025 and 2030

8. Market Segmentation by Type

8.1 Market segments

Chart on Type - Market share 2025-2030 (%)
Data Table on Type - Market share 2025-2030 (%)

8.2 Comparison by Type

Chart on Comparison by Type
Data Table on Comparison by Type

8.3 Enterprise manufacturing system - Market size and forecast 2025-2030

Chart on Enterprise manufacturing system - Market size and forecast 2025-2030 ($ million)
Data Table on Enterprise manufacturing system - Market size and forecast 2025-2030 ($ million)
Chart on Enterprise manufacturing system - Year-over-year growth 2025-2030 (%)
Data Table on Enterprise manufacturing system - Year-over-year growth 2025-2030 (%)

8.4 Laboratory information management system - Market size and forecast 2025-2030

Chart on Laboratory information management system - Market size and forecast 2025-2030 ($ million)
Data Table on Laboratory information management system - Market size and forecast 2025-2030 ($ million)
Chart on Laboratory information management system - Year-over-year growth 2025-2030 (%)
Data Table on Laboratory information management system - Year-over-year growth 2025-2030 (%)

8.5 Cell orchestration platform - Market size and forecast 2025-2030

Chart on Cell orchestration platform - Market size and forecast 2025-2030 ($ million)
Data Table on Cell orchestration platform - Market size and forecast 2025-2030 ($ million)
Chart on Cell orchestration platform - Year-over-year growth 2025-2030 (%)
Data Table on Cell orchestration platform - Year-over-year growth 2025-2030 (%)

8.6 Inventory management system - Market size and forecast 2025-2030

Chart on Inventory management system - Market size and forecast 2025-2030 ($ million)
Data Table on Inventory management system - Market size and forecast 2025-2030 ($ million)
Chart on Inventory management system - Year-over-year growth 2025-2030 (%)
Data Table on Inventory management system - Year-over-year growth 2025-2030 (%)

8.7 Others - Market size and forecast 2025-2030

Chart on Others - Market size and forecast 2025-2030 ($ million)
Data Table on Others - Market size and forecast 2025-2030 ($ million)
Chart on Others - Year-over-year growth 2025-2030 (%)
Data Table on Others - Year-over-year growth 2025-2030 (%)

8.8 Market opportunity by Type

Market opportunity by Type ($ million)
Data Table on Market opportunity by Type ($ million)

9. Market Segmentation by End-user

9.1 Market segments

Chart on End-user - Market share 2025-2030 (%)
Data Table on End-user - Market share 2025-2030 (%)

9.2 Comparison by End-user

Chart on Comparison by End-user
Data Table on Comparison by End-user

9.3 Pharmaceutical companies - Market size and forecast 2025-2030

Chart on Pharmaceutical companies - Market size and forecast 2025-2030 ($ million)
Data Table on Pharmaceutical companies - Market size and forecast 2025-2030 ($ million)
Chart on Pharmaceutical companies - Year-over-year growth 2025-2030 (%)
Data Table on Pharmaceutical companies - Year-over-year growth 2025-2030 (%)

9.4 Contract manufacturers - Market size and forecast 2025-2030

Chart on Contract manufacturers - Market size and forecast 2025-2030 ($ million)
Data Table on Contract manufacturers - Market size and forecast 2025-2030 ($ million)
Chart on Contract manufacturers - Year-over-year growth 2025-2030 (%)
Data Table on Contract manufacturers - Year-over-year growth 2025-2030 (%)

9.5 Hospitals - Market size and forecast 2025-2030

Chart on Hospitals - Market size and forecast 2025-2030 ($ million)
Data Table on Hospitals - Market size and forecast 2025-2030 ($ million)
Chart on Hospitals - Year-over-year growth 2025-2030 (%)
Data Table on Hospitals - Year-over-year growth 2025-2030 (%)

9.6 Research institutes - Market size and forecast 2025-2030

Chart on Research institutes - Market size and forecast 2025-2030 ($ million)
Data Table on Research institutes - Market size and forecast 2025-2030 ($ million)
Chart on Research institutes - Year-over-year growth 2025-2030 (%)
Data Table on Research institutes - Year-over-year growth 2025-2030 (%)

9.7 Market opportunity by End-user

Market opportunity by End-user ($ million)
Data Table on Market opportunity by End-user ($ million)

10. Market Segmentation by Deployment

10.1 Market segments

Chart on Deployment - Market share 2025-2030 (%)
Data Table on Deployment - Market share 2025-2030 (%)

10.2 Comparison by Deployment

Chart on Comparison by Deployment
Data Table on Comparison by Deployment

10.3 Clinical scale - Market size and forecast 2025-2030

Chart on Clinical scale - Market size and forecast 2025-2030 ($ million)
Data Table on Clinical scale - Market size and forecast 2025-2030 ($ million)
Chart on Clinical scale - Year-over-year growth 2025-2030 (%)
Data Table on Clinical scale - Year-over-year growth 2025-2030 (%)

10.4 Commercial scale - Market size and forecast 2025-2030

Chart on Commercial scale - Market size and forecast 2025-2030 ($ million)
Data Table on Commercial scale - Market size and forecast 2025-2030 ($ million)
Chart on Commercial scale - Year-over-year growth 2025-2030 (%)
Data Table on Commercial scale - Year-over-year growth 2025-2030 (%)

10.5 Market opportunity by Deployment

Market opportunity by Deployment ($ million)
Data Table on Market opportunity by Deployment ($ million)

11. Customer Landscape

11.1 Customer landscape overview

Analysis of price sensitivity, lifecycle, customer purchase basket, adoption rates, and purchase criteria

12. Geographic Landscape

12.1 Geographic segmentation

Chart on Market share by geography 2025-2030 (%)
Data Table on Market share by geography 2025-2030 (%)

12.2 Geographic comparison

Chart on Geographic comparison
Data Table on Geographic comparison

12.3 North America - Market size and forecast 2025-2030

Chart on North America - Market size and forecast 2025-2030 ($ million)
Data Table on North America - Market size and forecast 2025-2030 ($ million)
Chart on North America - Year-over-year growth 2025-2030 (%)
Data Table on North America - Year-over-year growth 2025-2030 (%)
Chart on Regional Comparison - North America
Data Table on Regional Comparison - North America

12.3.1 US - Market size and forecast 2025-2030

Chart on US - Market size and forecast 2025-2030 ($ million)
Data Table on US - Market size and forecast 2025-2030 ($ million)
Chart on US - Year-over-year growth 2025-2030 (%)
Data Table on US - Year-over-year growth 2025-2030 (%)

12.3.2 Canada - Market size and forecast 2025-2030

Chart on Canada - Market size and forecast 2025-2030 ($ million)
Data Table on Canada - Market size and forecast 2025-2030 ($ million)
Chart on Canada - Year-over-year growth 2025-2030 (%)
Data Table on Canada - Year-over-year growth 2025-2030 (%)

12.3.3 Mexico - Market size and forecast 2025-2030

Chart on Mexico - Market size and forecast 2025-2030 ($ million)
Data Table on Mexico - Market size and forecast 2025-2030 ($ million)
Chart on Mexico - Year-over-year growth 2025-2030 (%)
Data Table on Mexico - Year-over-year growth 2025-2030 (%)

12.4 Europe - Market size and forecast 2025-2030

Chart on Europe - Market size and forecast 2025-2030 ($ million)
Data Table on Europe - Market size and forecast 2025-2030 ($ million)
Chart on Europe - Year-over-year growth 2025-2030 (%)
Data Table on Europe - Year-over-year growth 2025-2030 (%)
Chart on Regional Comparison - Europe
Data Table on Regional Comparison - Europe

12.4.1 Germany - Market size and forecast 2025-2030

Chart on Germany - Market size and forecast 2025-2030 ($ million)
Data Table on Germany - Market size and forecast 2025-2030 ($ million)
Chart on Germany - Year-over-year growth 2025-2030 (%)
Data Table on Germany - Year-over-year growth 2025-2030 (%)

12.4.2 UK - Market size and forecast 2025-2030

Chart on UK - Market size and forecast 2025-2030 ($ million)
Data Table on UK - Market size and forecast 2025-2030 ($ million)
Chart on UK - Year-over-year growth 2025-2030 (%)
Data Table on UK - Year-over-year growth 2025-2030 (%)

12.4.3 France - Market size and forecast 2025-2030

Chart on France - Market size and forecast 2025-2030 ($ million)
Data Table on France - Market size and forecast 2025-2030 ($ million)
Chart on France - Year-over-year growth 2025-2030 (%)
Data Table on France - Year-over-year growth 2025-2030 (%)

12.4.4 Italy - Market size and forecast 2025-2030

Chart on Italy - Market size and forecast 2025-2030 ($ million)
Data Table on Italy - Market size and forecast 2025-2030 ($ million)
Chart on Italy - Year-over-year growth 2025-2030 (%)
Data Table on Italy - Year-over-year growth 2025-2030 (%)

12.4.5 Spain - Market size and forecast 2025-2030

Chart on Spain - Market size and forecast 2025-2030 ($ million)
Data Table on Spain - Market size and forecast 2025-2030 ($ million)
Chart on Spain - Year-over-year growth 2025-2030 (%)
Data Table on Spain - Year-over-year growth 2025-2030 (%)

12.4.6 The Netherlands - Market size and forecast 2025-2030

Chart on The Netherlands - Market size and forecast 2025-2030 ($ million)
Data Table on The Netherlands - Market size and forecast 2025-2030 ($ million)
Chart on The Netherlands - Year-over-year growth 2025-2030 (%)
Data Table on The Netherlands - Year-over-year growth 2025-2030 (%)

12.4.7 Switzerland - Market size and forecast 2025-2030

Chart on Switzerland - Market size and forecast 2025-2030 ($ million)
Data Table on Switzerland - Market size and forecast 2025-2030 ($ million)
Chart on Switzerland - Year-over-year growth 2025-2030 (%)
Data Table on Switzerland - Year-over-year growth 2025-2030 (%)

12.5 Asia - Market size and forecast 2025-2030

Chart on Asia - Market size and forecast 2025-2030 ($ million)
Data Table on Asia - Market size and forecast 2025-2030 ($ million)
Chart on Asia - Year-over-year growth 2025-2030 (%)
Data Table on Asia - Year-over-year growth 2025-2030 (%)
Chart on Regional Comparison - Asia
Data Table on Regional Comparison - Asia

12.5.1 China - Market size and forecast 2025-2030

Chart on China - Market size and forecast 2025-2030 ($ million)
Data Table on China - Market size and forecast 2025-2030 ($ million)
Chart on China - Year-over-year growth 2025-2030 (%)
Data Table on China - Year-over-year growth 2025-2030 (%)

12.5.2 Japan - Market size and forecast 2025-2030

Chart on Japan - Market size and forecast 2025-2030 ($ million)
Data Table on Japan - Market size and forecast 2025-2030 ($ million)
Chart on Japan - Year-over-year growth 2025-2030 (%)
Data Table on Japan - Year-over-year growth 2025-2030 (%)

12.5.3 South Korea - Market size and forecast 2025-2030

Chart on South Korea - Market size and forecast 2025-2030 ($ million)
Data Table on South Korea - Market size and forecast 2025-2030 ($ million)
Chart on South Korea - Year-over-year growth 2025-2030 (%)
Data Table on South Korea - Year-over-year growth 2025-2030 (%)

12.5.4 India - Market size and forecast 2025-2030

Chart on India - Market size and forecast 2025-2030 ($ million)
Data Table on India - Market size and forecast 2025-2030 ($ million)
Chart on India - Year-over-year growth 2025-2030 (%)
Data Table on India - Year-over-year growth 2025-2030 (%)

12.5.5 Indonesia - Market size and forecast 2025-2030

Chart on Indonesia - Market size and forecast 2025-2030 ($ million)
Data Table on Indonesia - Market size and forecast 2025-2030 ($ million)
Chart on Indonesia - Year-over-year growth 2025-2030 (%)
Data Table on Indonesia - Year-over-year growth 2025-2030 (%)

12.5.6 Vietnam - Market size and forecast 2025-2030

Chart on Vietnam - Market size and forecast 2025-2030 ($ million)
Data Table on Vietnam - Market size and forecast 2025-2030 ($ million)
Chart on Vietnam - Year-over-year growth 2025-2030 (%)
Data Table on Vietnam - Year-over-year growth 2025-2030 (%)

12.5.7 Singapore - Market size and forecast 2025-2030

Chart on Singapore - Market size and forecast 2025-2030 ($ million)
Data Table on Singapore - Market size and forecast 2025-2030 ($ million)
Chart on Singapore - Year-over-year growth 2025-2030 (%)
Data Table on Singapore - Year-over-year growth 2025-2030 (%)

12.6 Rest of World (ROW) - Market size and forecast 2025-2030

Chart on Rest of World (ROW) - Market size and forecast 2025-2030 ($ million)
Data Table on Rest of World (ROW) - Market size and forecast 2025-2030 ($ million)
Chart on Rest of World (ROW) - Year-over-year growth 2025-2030 (%)
Data Table on Rest of World (ROW) - Year-over-year growth 2025-2030 (%)
Chart on Regional Comparison - Rest of World (ROW)
Data Table on Regional Comparison - Rest of World (ROW)

12.6.1 Australia - Market size and forecast 2025-2030

Chart on Australia - Market size and forecast 2025-2030 ($ million)
Data Table on Australia - Market size and forecast 2025-2030 ($ million)
Chart on Australia - Year-over-year growth 2025-2030 (%)
Data Table on Australia - Year-over-year growth 2025-2030 (%)

12.6.2 Brazil - Market size and forecast 2025-2030

Chart on Brazil - Market size and forecast 2025-2030 ($ million)
Data Table on Brazil - Market size and forecast 2025-2030 ($ million)
Chart on Brazil - Year-over-year growth 2025-2030 (%)
Data Table on Brazil - Year-over-year growth 2025-2030 (%)

12.6.3 UAE - Market size and forecast 2025-2030

Chart on UAE - Market size and forecast 2025-2030 ($ million)
Data Table on UAE - Market size and forecast 2025-2030 ($ million)
Chart on UAE - Year-over-year growth 2025-2030 (%)
Data Table on UAE - Year-over-year growth 2025-2030 (%)

12.6.4 South Africa - Market size and forecast 2025-2030

Chart on South Africa - Market size and forecast 2025-2030 ($ million)
Data Table on South Africa - Market size and forecast 2025-2030 ($ million)
Chart on South Africa - Year-over-year growth 2025-2030 (%)
Data Table on South Africa - Year-over-year growth 2025-2030 (%)

12.6.5 Saudi Arabia - Market size and forecast 2025-2030

Chart on Saudi Arabia - Market size and forecast 2025-2030 ($ million)
Data Table on Saudi Arabia - Market size and forecast 2025-2030 ($ million)
Chart on Saudi Arabia - Year-over-year growth 2025-2030 (%)
Data Table on Saudi Arabia - Year-over-year growth 2025-2030 (%)

12.6.6 Turkey - Market size and forecast 2025-2030

Chart on Turkey - Market size and forecast 2025-2030 ($ million)
Data Table on Turkey - Market size and forecast 2025-2030 ($ million)
Chart on Turkey - Year-over-year growth 2025-2030 (%)
Data Table on Turkey - Year-over-year growth 2025-2030 (%)

12.7 Market opportunity by geography

Market opportunity by geography ($ million)
Data Tables on Market opportunity by geography ($ million)

13. Drivers, Challenges, and Opportunity

13.1 Market drivers

Accelerated clinical development and commercialization
Mandatory chain of identity and custody requirements
Rise of personalized autologous treatment modalities

13.2 Market challenges

Regulatory heterogeneity and global compliance burdens
Interoperability barriers and system fragmentation
High initial capital requirements and expertise deficits

13.3 Impact of drivers and challenges

Impact of drivers and challenges in 2025 and 2030

13.4 Market opportunities

Integration of artificial intelligence for predictive optimization
Adoption of cloud-native orchestration architectures
Implementation of distributed ledger technology for data security

14. Competitive Landscape

14.1 Overview

14.2

Overview on criticality of inputs and factors of differentiation

14.3 Landscape disruption

Overview on factors of disruption

14.4 Industry risks

Impact of key risks on business

15. Competitive Analysis

15.1 Companies profiled

Companies covered

15.2 Company ranking index

15.3 Market positioning of companies

Matrix on companies position and classification

15.4 Appian Corp.

Appian Corp. - Overview
Appian Corp. - Business segments
Appian Corp. - Key offerings
Appian Corp. - Segment focus
SWOT

15.5 Cencora Inc.

Cencora Inc. - Overview
Cencora Inc. - Business segments
Cencora Inc. - Key offerings
Cencora Inc. - Segment focus
SWOT

15.6 Cryoport Systems, LLC

Cryoport Systems, LLC - Overview
Cryoport Systems, LLC - Product / Service
Cryoport Systems, LLC - Key offerings
SWOT

15.7 Cytiva

Cytiva - Overview
Cytiva - Product / Service
Cytiva - Key offerings
SWOT

15.8 Emerson Electric Co.

Emerson Electric Co. - Overview
Emerson Electric Co. - Business segments
Emerson Electric Co. - Key news
Emerson Electric Co. - Key offerings
Emerson Electric Co. - Segment focus
SWOT

15.9 Honeywell International Inc.

Honeywell International Inc. - Overview
Honeywell International Inc. - Business segments
Honeywell International Inc. - Key news
Honeywell International Inc. - Key offerings
Honeywell International Inc. - Segment focus
SWOT

15.10 McKesson Corp.

McKesson Corp. - Overview
McKesson Corp. - Business segments
McKesson Corp. - Key offerings
McKesson Corp. - Segment focus
SWOT

15.11 Oracle Corp.

Oracle Corp. - Overview
Oracle Corp. - Business segments
Oracle Corp. - Key news
Oracle Corp. - Key offerings
Oracle Corp. - Segment focus
SWOT

15.12 Salesforce Inc.

Salesforce Inc. - Overview
Salesforce Inc. - Business segments
Salesforce Inc. - Key news
Salesforce Inc. - Key offerings
Salesforce Inc. - Segment focus
SWOT

15.13 SAP SE

SAP SE - Overview
SAP SE - Business segments
SAP SE - Key news
SAP SE - Key offerings
SAP SE - Segment focus
SWOT

15.14 Siemens AG

Siemens AG - Overview
Siemens AG - Business segments
Siemens AG - Key news
Siemens AG - Key offerings
Siemens AG - Segment focus
SWOT

15.15 Thermo Fisher Scientific Inc.

Thermo Fisher Scientific Inc. - Overview
Thermo Fisher Scientific Inc. - Business segments
Thermo Fisher Scientific Inc. - Key news
Thermo Fisher Scientific Inc. - Key offerings
Thermo Fisher Scientific Inc. - Segment focus
SWOT

15.16 TraceLink Inc.

TraceLink Inc. - Overview
TraceLink Inc. - Product / Service
TraceLink Inc. - Key offerings
SWOT

15.17 TrakCel

TrakCel - Overview
TrakCel - Product / Service
TrakCel - Key offerings
SWOT

15.18 Veeva Systems Inc.

Veeva Systems Inc. - Overview
Veeva Systems Inc. - Business segments
Veeva Systems Inc. - Key offerings
Veeva Systems Inc. - Segment focus
SWOT

16. Appendix

16.1 Scope of the report

Market definition
Objectives
Notes and caveats

16.2 Inclusions and exclusions checklist

Inclusions checklist
Exclusions checklist

16.3 Currency conversion rates for US$

16.4 Research methodology

16.5 Data procurement

Information sources

16.6 Data validation

16.7 Validation techniques employed for market sizing

16.8 Data synthesis

16.9 360 degree market analysis

16.10 List of abbreviations

Research Methodology

Technavio presents a detailed picture of the market by way of study, synthesis, and summation of data from multiple sources. The analysts have presented the various facets of the market with a particular focus on identifying the key industry influencers. The data thus presented is comprehensive, reliable, and the result of extensive research, both primary and secondary.

INFORMATION SOURCES

Primary sources

  • Manufacturers and suppliers
  • Channel partners
  • Industry experts
  • Strategic decision makers

Secondary sources

  • Industry journals and periodicals
  • Government data
  • Financial reports of key industry players
  • Historical data
  • Press releases

DATA ANALYSIS

Data Synthesis

  • Collation of data
  • Estimation of key figures
  • Analysis of derived insights

Data Validation

  • Triangulation with data models
  • Reference against proprietary databases
  • Corroboration with industry experts

REPORT WRITING

Qualitative

  • Market drivers
  • Market challenges
  • Market trends
  • Five forces analysis

Quantitative

  • Market size and forecast
  • Market segmentation
  • Geographical insights
  • Competitive landscape

Interested in this report?

Get your sample now to see our research methodology and insights!

Download Now

Frequently Asked Questions

Cell And Gene Therapy Supply Chain Software market growth will increase by USD 292.0 million during 2026-2030.

The Cell And Gene Therapy Supply Chain Software market is expected to grow at a CAGR of 15.2% during 2026-2030.

Cell And Gene Therapy Supply Chain Software market is segmented by Type (Enterprise manufacturing system, Laboratory information management system, Cell orchestration platform, Inventory management system, Others) End-user (Pharmaceutical companies, Contract manufacturers, Hospitals, Research institutes) Deployment (Clinical scale, Commercial scale)

Appian Corp., Benchling Inc., Cencora Inc., Cryoport Systems, LLC, Cytiva, Emerson Electric Co., Honeywell International Inc., Korber Pharma GmbH, LabVantage Solutions Inc., Lonza Group Ltd., MasterControl Solutions Inc., McKesson Corp., Oracle Corp., Salesforce Inc., SAP SE, Siemens AG, Thermo Fisher Scientific Inc., TraceLink Inc., TrakCel, Veeva Systems Inc. are a few of the key vendors in the Cell And Gene Therapy Supply Chain Software market.

North America will register the highest growth rate of 54% among the other regions. Therefore, the Cell And Gene Therapy Supply Chain Software market in North America is expected to garner significant business opportunities for the vendors during the forecast period.

US, Canada, Mexico, Germany, UK, France, Italy, Spain, The Netherlands, Switzerland, China, Japan, South Korea, India, Indonesia, Vietnam, Singapore, Australia, Brazil, UAE, South Africa, Saudi Arabia, Turkey

  • Accelerated clinical development and commercialization is the driving factor this market.

The Cell And Gene Therapy Supply Chain Software market vendors should focus on grabbing business opportunities from the Type segment as it accounted for the largest market share in the base year.
RIA - Research AI Assistant
Ask RIA