Buy-now-pay-later Solutions In E-commerce Market Analysis, Size, and Forecast 2026-2030: North America (US, Canada, and Mexico), Europe (UK, Germany, and France), APAC (China, India, and Japan), Middle East and Africa (Saudi Arabia, UAE, and South Africa), South America (Brazil, Argentina, and Colombia), and Rest of World (ROW)

Buy-now-pay-later Solutions In E-commerce Market Analysis, Size, and Forecast 2026-2030:
North America (US, Canada, and Mexico), Europe (UK, Germany, and France), APAC (China, India, and Japan), Middle East and Africa (Saudi Arabia, UAE, and South Africa), South America (Brazil, Argentina, and Colombia), and Rest of World (ROW)

Published: May 2026 299 Pages SKU: IRTNTR81367

Market Overview at a Glance

$27.85 B
Market Opportunity
32.3%
CAGR 2025 - 2030
32.6%
North America Growth
$4.94 B
On-platform segment 2024

Buy-Now-Pay-Later Solutions In E-Commerce Market Size and Growth Forecast 2026-2030

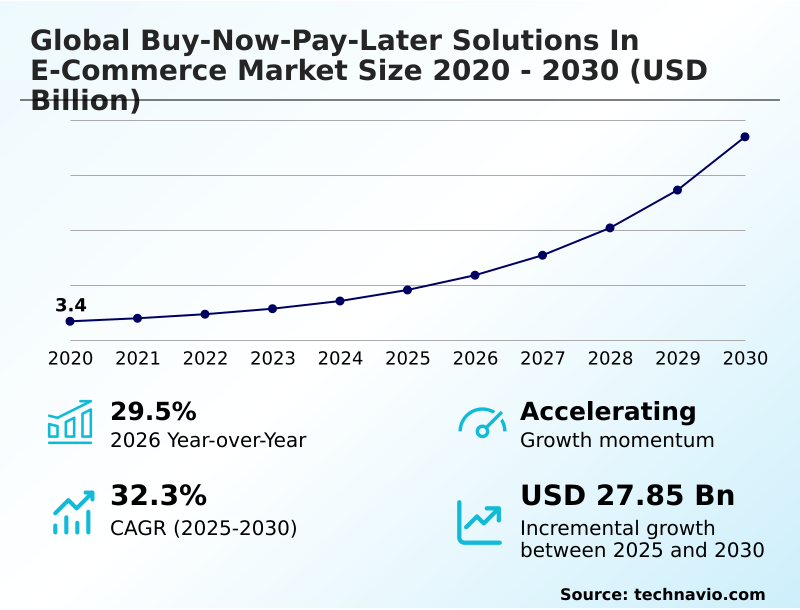
The Buy-Now-Pay-Later Solutions In E-Commerce Market size was valued at USD 9.10 billion in 2025 growing at a CAGR of 32.3% during the forecast period 2026-2030.

North America accounts for 32.6% of incremental growth during the forecast period. The On-platform segment by Channel was valued at USD 4.94 billion in 2024, while the Interest-free BNPL segment holds the largest revenue share by Method.

The market is projected to grow by USD 33.54 billion from 2020 to 2030, with USD 27.85 billion of the growth expected during the forecast period of 2025 to 2030.

Get Key Insights on Market Forecast (PDF) Request Free Sample

Buy-Now-Pay-Later Solutions In E-Commerce Market Overview

The buy-now-pay-later solutions in e-commerce market is defined by a fundamental shift in consumer credit, driven by the demand for more flexible deferred payment models over traditional revolving debt. This transformation compels merchants to prioritize e-commerce checkout integration of various installment payment solutions. North America is expected to contribute over 32% of market growth, fueled by younger demographics rejecting conventional credit cards. The underlying financial technology framework leverages real-time risk assessment and alternative credit scoring, expanding access to credit. For instance, a mid-sized online fashion retailer implementing a 'Pay in 4' option at checkout typically sees shopping cart abandonment rates fall by over 20%, directly boosting conversion. This is made possible by sophisticated credit underwriting algorithms that provide instantaneous credit decisions. The strategic adoption of these tools is no longer a niche advantage but a core requirement for competing effectively in the digital retail environment, influencing everything from customer acquisition cost to overall revenue.

Drivers, Trends, and Challenges in the Buy-Now-Pay-Later Solutions In E-Commerce Market

The evolution of the buy-now-pay-later solutions in e-commerce market is increasingly dictated by regulatory and macroeconomic pressures. For instance, regulatory challenges for BNPL in Europe, under frameworks like the Consumer Credit Directive, are forcing platforms to enhance data privacy in BNPL affordability checks.

In this environment, the impact of rising interest rates on BNPL providers is severe, squeezing margins and compelling a strategic pivot toward more resilient models. This includes diversifying beyond deferred payment for fashion e-commerce into high-margin areas like BNPL for high-ticket electronics and expanding into BNPL solutions for service industries.

An operational example is a travel agency offering installment plans for vacation packages, which can reduce sales friction by over 30% compared to requiring full upfront payment. To combat rising fraud, the use of AI in BNPL risk assessment is becoming standard practice to detect and prevent sophisticated synthetic identity fraud in BNPL.

Furthermore, the open banking impact on BNPL underwriting is enabling more accurate risk modeling. Technology is also driving new commercial applications, from B2B BNPL for invoice financing to the deeper BNPL integration in mobile super-apps, particularly in emerging markets where it advances financial inclusion.

The strategic imperative is clear: providers must balance omnichannel retail implementation with robust risk management, particularly in managing reverse logistics in try-before-you-buy models, to ensure sustainable profitability.

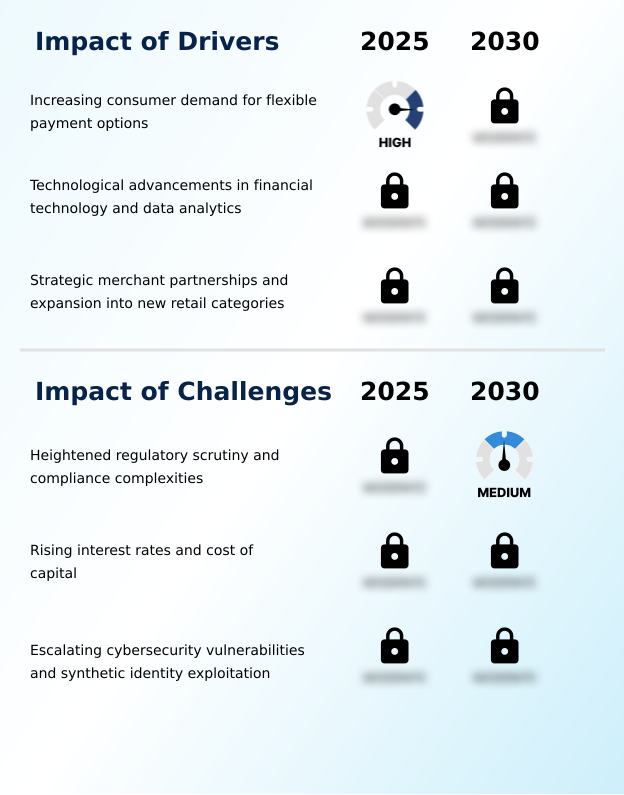
Primary Growth Driver: Increasing consumer demand for flexible and transparent payment options is a key driver for the market.

Market expansion is fueled by a confluence of technological innovation and strategic commercial diversification.

At the core, advanced credit underwriting algorithms allow providers to offer a frictionless checkout experience, which is proven to drive an average order value increase and reduce cart abandonment.

The use of proprietary risk algorithms for real-time risk assessment enables instantaneous credit decisions, expanding access to a wider consumer base without a corresponding rise in defaults. Beyond technology, growth is propelled by aggressive merchant partnership diversification.

The market is moving decisively beyond its origins in fashion and apparel to penetrate high-ticket item financing for categories like electronics and home goods.

Furthermore, expansion into service-oriented industries, including travel and healthcare, is unlocking significant new revenue streams and embedding installment payments into more facets of daily life.

Emerging Market Trend: The deepening penetration of mobile commerce and the widespread adoption of digital wallets are creating significant growth avenues, particularly in emerging economies.

Key trends are reshaping the market's architecture, moving it beyond a simple retail checkout feature into a deeply integrated financial service. The convergence with traditional banking is accelerating, with established financial institutions launching their own white-label installment platforms to leverage their existing customer bases and low-cost capital. This mainstream financial ecosystem convergence is compelling standalone providers to innovate rapidly.

Simultaneously, mobile-first payment strategies are paramount, particularly in APAC, which shows the highest regional growth potential. The seamless digital wallet integration of installment options is a primary driver for both customer acquisition and financial inclusion for unbanked populations.

A third major trend is the alignment with ESG goals through purpose-driven purchasing integration, where platforms facilitate green premium financing for sustainable products, resonating with ethically conscious consumers.

Key Industry Challenge: Heightened regulatory scrutiny and the increasing complexities of compliance represent a key challenge affecting industry growth.

The industry faces significant structural headwinds that threaten profitability and operational models. Foremost among these is the increasing regulatory compliance burden, as authorities in markets like North America and Europe mandate stringent affordability checks to mitigate consumer over-indebtedness risk, adding significant operational costs.

This is compounded by macroeconomic pressures, where cost of capital fluctuations, driven by rising interest rates, directly erode the margins of the interest-free installment model. The third primary challenge is the persistent threat of sophisticated fraud, necessitating heavy investment in cybersecurity vulnerability mitigation.

Combating threats like synthetic identity fraud requires advanced biometric spoofing prevention and behavioral data analysis, which can introduce friction into the checkout process, directly contradicting the core value proposition of seamless transactions.

Explore Full Market Dynamics Analysis Request Free Sample

Buy-Now-Pay-Later Solutions In E-Commerce Market Segmentation

The buy-now-pay-later solutions in e-commerce industry research report provides comprehensive data including region-wise segment analysis, with forecasts and analysis for the period 2026-2030, as well as historical data from 2020-2024 for the following segments.

Market Segment by Channel
  • On-platform
  • Off-platform
Market Segment by Method
  • Interest-free BNPL
  • Interest-bearing installments
  • Deferred payment
Market Segment by End-user
  • Fashion and apparel
  • Consumer electronics
  • Home and furniture
  • Beauty and personal care
  • Others
Market Segment by Geography
North America
US, Canada, Mexico
Europe
UK, Germany, France, Italy, The Netherlands, Spain
APAC
China, India, Japan, Australia, South Korea, Indonesia
Middle East and Africa
Saudi Arabia, UAE, South Africa, Israel, Turkey
South America
Brazil, Argentina, Colombia

Channel Segment Analysis

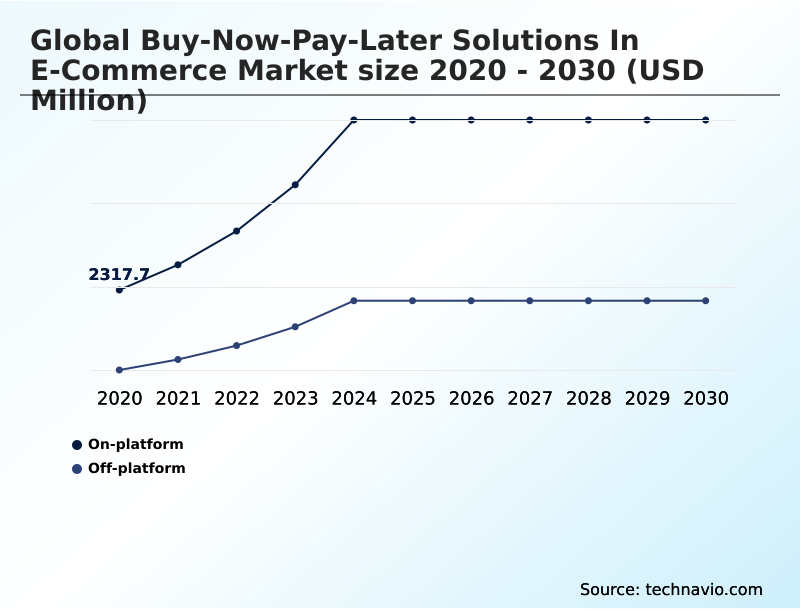
The on-platform segment is estimated to witness significant growth during the forecast period.

On-platform solutions, where buy-now-pay-later options are embedded directly into a retailer's e-commerce checkout integration, represent the market's principal channel.

This model, accounting for the majority of transaction value, is critical for reducing shopping cart abandonment rates by providing a frictionless checkout experience.

Merchants favor this native integration as it keeps consumers within their branded ecosystem, fostering loyalty and enabling an average order value increase. The technical deployment relies on robust embedded finance capabilities and secure payment gateway security protocols to manage data.

By presenting installment payment solutions upfront on product pages, retailers can significantly influence purchasing decisions without redirecting customers to third-party sites, thus maintaining control over the entire user journey and transactional data flow.

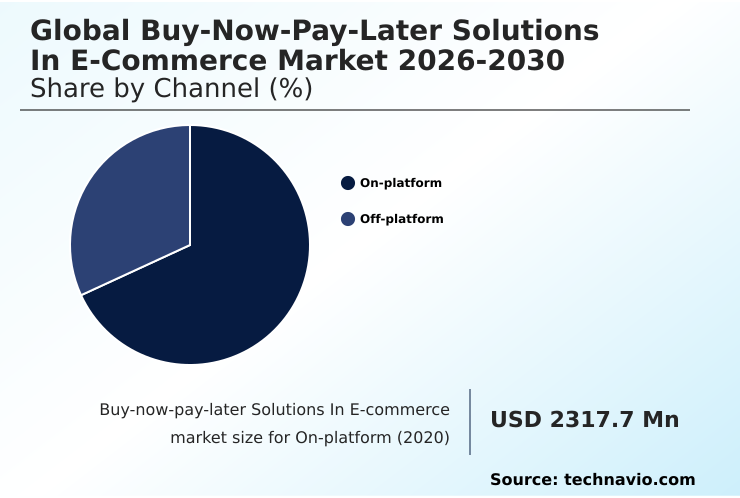
The On-platform segment was valued at USD 4.94 billion in 2024 and showed a gradual increase during the forecast period.

Buy-Now-Pay-Later Solutions In E-Commerce Market by Region: North America Leads with 32.6% Growth Share

North America is estimated to contribute 32.6% to the growth of the global market during the forecast period.

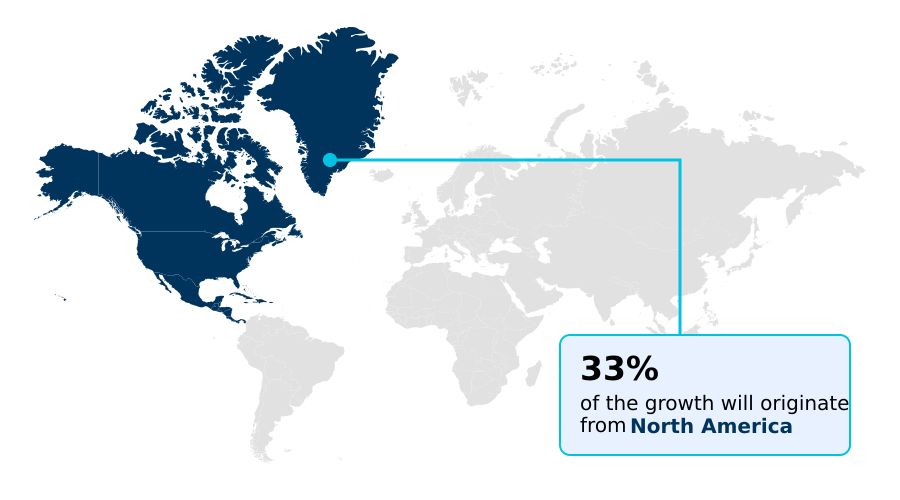
The geographic landscape of the market is diverse, with North America poised to account for nearly 33% of the total growth opportunity, driven by consumer demand for alternatives to traditional credit.

In contrast, the APAC region, exhibiting the highest growth rate at over 33%, is defined by mobile-first payment strategies and the role of BNPL in promoting financial inclusion for unbanked populations.

In the Middle East, growth hinges on the availability of Sharia-compliant financing, highlighting the importance of localized payment preferences. European markets are navigating tightening regulations under the Consumer Credit Directive, which impacts cross-border transaction processing.

This regional fragmentation necessitates that providers tailor their open banking APIs and digital wallet integration strategies to align with local financial ecosystems and compliance mandates, moving beyond a one-size-fits-all approach to capture global market share.

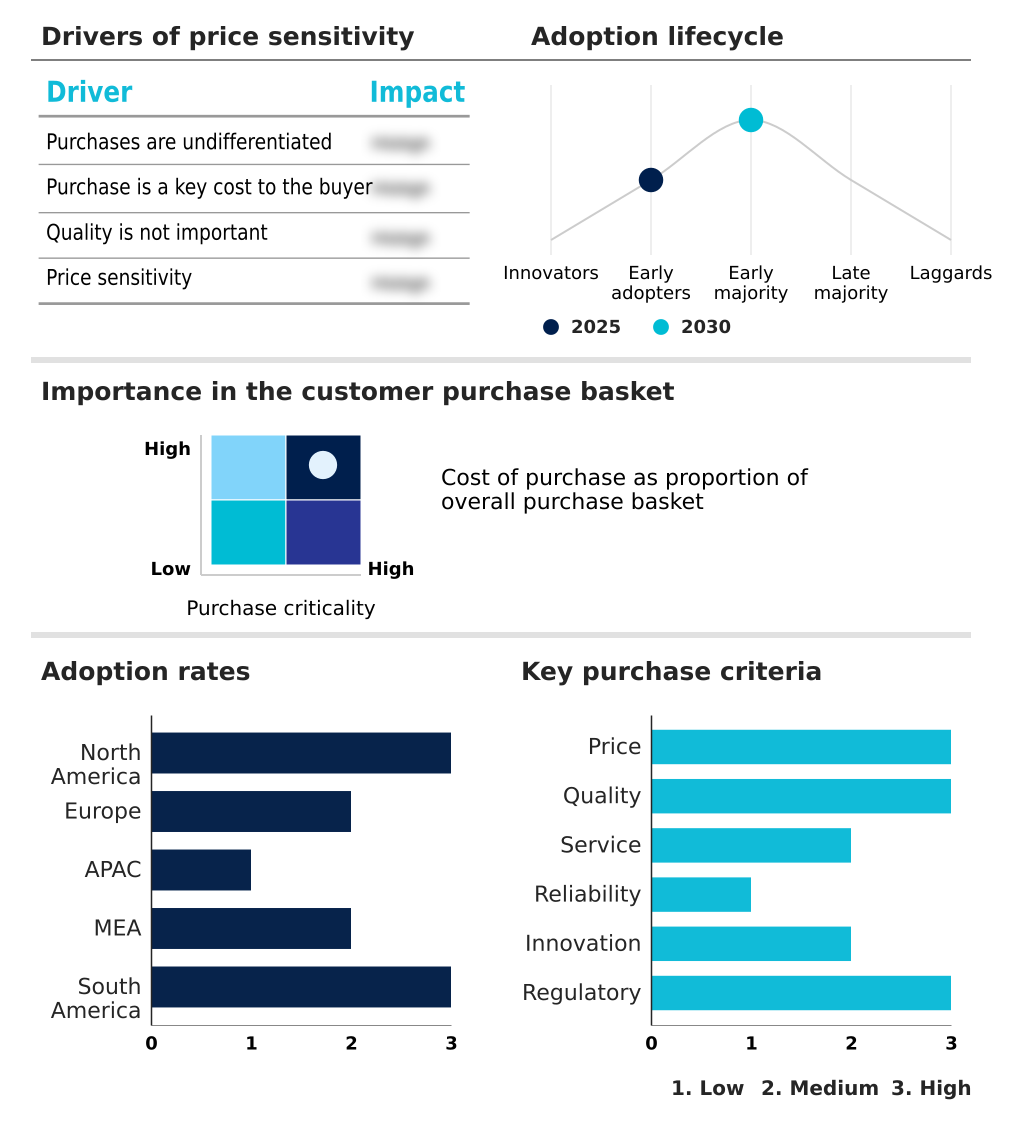
Customer Landscape Analysis for the Buy-Now-Pay-Later Solutions In E-Commerce Market

The buy-now-pay-later solutions in e-commerce market forecasting report includes the adoption lifecycle of the market, covering from the innovator’s stage to the laggard’s stage. It focuses on adoption rates in different regions based on penetration. Furthermore, the buy-now-pay-later solutions in e-commerce market report also includes key purchase criteria and drivers of price sensitivity to help companies evaluate and develop their market growth analysis strategies.

Competitive Landscape of the Buy-Now-Pay-Later Solutions In E-Commerce Market

Companies are implementing various strategies, such as strategic alliances, partnerships, mergers and acquisitions, geographical expansion, and product/service launches, to enhance their presence in the buy-now-pay-later solutions in e-commerce market industry.

Adyen NV - Offers a global payment platform that integrates multiple BNPL providers, enabling rapid deployment for e-commerce merchants through a single, unified gateway.

The industry research and growth report includes detailed analyses of the competitive landscape of the market and information about key companies, including:

  • Adyen NV
  • Affirm Holdings Inc.
  • Alma
  • Billie
  • Block Inc.
  • Cross River Bank
  • Four Technologies Inc.
  • Klarna Bank AB
  • KUESKI
  • Marqeta Inc.
  • PayPal Holdings Inc.
  • Plaid Inc.
  • Solaris SE
  • Splitit
  • Stripe Inc.
  • Sunbit Now LLC
  • Tabby LLC.
  • Tamara Finance Company
  • Unit Finance Inc.
  • Upgrade Inc.

Qualitative and quantitative analysis of companies has been conducted to help clients understand the wider business environment as well as the strengths and weaknesses of key industry players. Data is qualitatively analyzed to categorize companies as pure play, category-focused, industry-focused, and diversified; it is quantitatively analyzed to categorize companies as dominant, leading, strong, tentative, and weak.

Recent Developments in the Buy-Now-Pay-Later Solutions In E-Commerce Market

  • In March 2025, Klarna entered into a major agreement with Walmart, replacing Affirm as the exclusive BNPL partner to streamline checkout financing for the retail giant's e-commerce platform.
  • In May 2025, CrediLinq, an AI-driven B2B embedded finance enablement platform, raised USD 8.5 million in Series A funding to fuel its international expansion into the US, UK, and Australia and develop its credit infrastructure.
  • In January 2025, Billie announced a strategic partnership with a leading European e-procurement platform, integrating its automated B2B invoice financing solution to serve a vast network of enterprise buyers.
  • In November 2024, Tabby launched its physical card in the UAE and Saudi Arabia, enabling users to leverage their BNPL credit line for in-store purchases and significantly expanding its omnichannel payment presence.

Research Analyst Overview: Buy-Now-Pay-Later Solutions In E-Commerce Market

The buy-now-pay-later solutions in e-commerce market's structure is solidifying around on-platform integrations, which capture the majority of transaction value and present a critical boardroom decision regarding technology investment versus outsourcing.

A key consideration is the total cost of ownership for a native e-commerce checkout integration, which offers greater control over the customer journey but requires significant upfront and ongoing investment in the financial technology framework.

This decision is increasingly shaped by regulatory pressures, such as the EU's Consumer Credit Directive, which mandates stringent affordability checks and necessitates robust, compliant credit underwriting algorithms. Consequently, capital allocation is shifting toward developing proprietary real-time risk assessment capabilities and securing embedded finance capabilities that can scale across jurisdictions.

For leadership teams, the strategic focus must be on how installment payment solutions can be deployed not just as a payment method, but as a data-rich tool for understanding consumer behavior, enhancing loyalty, and driving profitable growth while navigating a complex global compliance landscape.

Dive into Technavio’s robust research methodology, blending expert interviews, extensive data synthesis, and validated models for unparalleled Buy-Now-Pay-Later Solutions In E-Commerce Market insights. See full methodology.

Request Free Sample

Market Scope
Page number 299
Base year 2025
Historic period 2020-2024
Forecast period 2026-2030
Growth momentum & CAGR Accelerate at a CAGR of 32.3%
Market growth 2026-2030 USD 27845.7 million
Market structure Fragmented
YoY growth 2025-2026(%) 29.5%
Key countries US, Canada, Mexico, UK, Germany, France, Italy, The Netherlands, Spain, China, India, Japan, Australia, South Korea, Indonesia, Saudi Arabia, UAE, South Africa, Israel, Turkey, Brazil, Argentina and Colombia
Competitive landscape Leading Companies, Market Positioning of Companies, Competitive Strategies, and Industry Risks

Buy-Now-Pay-Later Solutions In E-Commerce Market: Key Questions Answered in This Report

  • What is the expected growth of the Buy-Now-Pay-Later Solutions In E-Commerce Market between 2026 and 2030?

    • The Buy-Now-Pay-Later Solutions In E-Commerce Market is expected to grow by USD 27.85 billion during 2026-2030, registering a CAGR of 32.3%. Year-over-year growth in 2026 is estimated at 29.5%%. This acceleration is shaped by increasing consumer demand for flexible payment options, which is intensifying demand across multiple end-use verticals covered in the report.

  • What segmentation does the market report cover?

    • The report is segmented by Channel (On-platform, and Off-platform), Method (Interest-free BNPL, Interest-bearing installments, and Deferred payment), End-user (Fashion and apparel, Consumer electronics, Home and furniture, Beauty and personal care, and Others) and Geography (North America, Europe, APAC, Middle East and Africa, South America). Among these, the On-platform segment is estimated to witness significant growth during the forecast period, driven by rising adoption across key application areas. Each segment includes detailed qualitative and quantitative analysis, along with historical data from 2020-2024 and forecasts through 2030 with year-over-year growth rates.

  • Which regions are analyzed in the report?

    • The report covers North America, Europe, APAC, Middle East and Africa and South America. North America is estimated to contribute 32.6% to market growth during the forecast period. Country-level analysis includes US, Canada, Mexico, UK, Germany, France, Italy, The Netherlands, Spain, China, India, Japan, Australia, South Korea, Indonesia, Saudi Arabia, UAE, South Africa, Israel, Turkey, Brazil, Argentina and Colombia, with dedicated market size tables and year-over-year growth for each.

  • What are the key growth drivers and market challenges?

    • The primary driver is increasing consumer demand for flexible payment options, which is accelerating investment and industry demand. The main challenge is heightened regulatory scrutiny and compliance complexities, creating operational barriers for key market participants. The report quantifies the impact of each driver and challenge across 2026 and 2030 with comparative analysis.

  • Who are the major players in the Buy-Now-Pay-Later Solutions In E-Commerce Market?

    • Key vendors include Adyen NV, Affirm Holdings Inc., Alma, Billie, Block Inc., Cross River Bank, Four Technologies Inc., Klarna Bank AB, KUESKI, Marqeta Inc., PayPal Holdings Inc., Plaid Inc., Solaris SE, Splitit, Stripe Inc., Sunbit Now LLC, Tabby LLC., Tamara Finance Company, Unit Finance Inc. and Upgrade Inc.. The report provides qualitative and quantitative analysis categorizing companies as dominant, leading, strong, tentative, and weak based on their market positioning. Company profiles include business segment analysis, SWOT assessment, key offerings, and recent strategic developments.

Buy-Now-Pay-Later Solutions In E-Commerce Market Research Insights

Market dynamics are shaped by the need for a frictionless checkout experience, which directly impacts customer acquisition cost and lifetime value. Providers focus on delivering instantaneous credit decisions by using proprietary risk algorithms to analyze behavioral data, a practice under review by bodies like the US Consumer Financial Protection Bureau for its data harvesting practices and potential consumer over-indebtedness risk.

A key operational goal is to achieve a significant average order value increase while minimizing default rates. For merchants, the choice between on-platform vs off-platform models involves trade-offs between brand control and market reach.

The implementation of transparent fee structures is crucial for building consumer trust and navigating an environment where regulatory compliance burdens are increasing, forcing a diversification of revenue streams to maintain profitability.

We can help! Our analysts can customize this buy-now-pay-later solutions in e-commerce market research report to meet your requirements.

Get in touch

1. Executive Summary

1.1 Market overview

Executive Summary - Chart on Market Overview
Executive Summary - Data Table on Market Overview
Executive Summary - Chart on Global Market Characteristics
Executive Summary - Chart on Market by Geography
Executive Summary - Chart on Market Segmentation by Channel
Executive Summary - Chart on Market Segmentation by Method
Executive Summary - Chart on Market Segmentation by End-user
Executive Summary - Chart on Incremental Growth
Executive Summary - Data Table on Incremental Growth
Executive Summary - Chart on Company Market Positioning

2. Technavio Analysis

2.1 Analysis of price sensitivity, lifecycle, customer purchase basket, adoption rates, and purchase criteria

2.2 Criticality of inputs and Factors of differentiation

Chart on Overview on criticality of inputs and factors of differentiation

2.3 Factors of disruption

Chart on Overview on factors of disruption

2.4 Impact of drivers and challenges

Chart on Impact of drivers and challenges in 2025 and 2030

3. Market Landscape

3.1 Market ecosystem

Chart on Parent Market
Data Table on - Parent Market

3.2 Market characteristics

Chart on Market characteristics analysis

3.3 Value chain analysis

Chart on Value chain analysis

4. Market Sizing

4.1 Market definition

Data Table on Offerings of companies included in the market definition

4.2 Market segment analysis

Market segments

4.3 Market size 2025

4.4 Market outlook: Forecast for 2025-2030

Chart on Global - Market size and forecast 2025-2030 ($ million)
Data Table on Global - Market size and forecast 2025-2030 ($ million)
Chart on Global Market: Year-over-year growth 2025-2030 (%)
Data Table on Global Market: Year-over-year growth 2025-2030 (%)

5. Historic Market Size

5.1 Global Buy-Now-Pay-Later Solutions In E-Commerce Market 2020 - 2024

Historic Market Size - Data Table on Global Buy-Now-Pay-Later Solutions In E-Commerce Market 2020 - 2024 ($ million)

5.2 Channel segment analysis 2020 - 2024

Historic Market Size - Channel Segment 2020 - 2024 ($ million)

5.3 Method segment analysis 2020 - 2024

Historic Market Size - Method Segment 2020 - 2024 ($ million)

5.4 End-user segment analysis 2020 - 2024

Historic Market Size - End-user Segment 2020 - 2024 ($ million)

5.5 Geography segment analysis 2020 - 2024

Historic Market Size - Geography Segment 2020 - 2024 ($ million)

5.6 Country segment analysis 2020 - 2024

Historic Market Size - Country Segment 2020 - 2024 ($ million)

6. Qualitative Analysis

6.1 Impact of AI on Global Buy-Now-Pay-Later Solutions in E-Commerce Market

6.2 Impact of Geopolitical Conflicts on Global Buy-Now-Pay-Later Solutions in E-Commerce Market

7. Five Forces Analysis

7.1 Five forces summary

Five forces analysis - Comparison between 2025 and 2030

7.2 Bargaining power of buyers

Bargaining power of buyers - Impact of key factors 2025 and 2030

7.3 Bargaining power of suppliers

Bargaining power of suppliers - Impact of key factors in 2025 and 2030

7.4 Threat of new entrants

Threat of new entrants - Impact of key factors in 2025 and 2030

7.5 Threat of substitutes

Threat of substitutes - Impact of key factors in 2025 and 2030

7.6 Threat of rivalry

Threat of rivalry - Impact of key factors in 2025 and 2030

7.7 Market condition

Chart on Market condition - Five forces 2025 and 2030

8. Market Segmentation by Channel

8.1 Market segments

Chart on Channel - Market share 2025-2030 (%)
Data Table on Channel - Market share 2025-2030 (%)

8.2 Comparison by Channel

Chart on Comparison by Channel
Data Table on Comparison by Channel

8.3 On-platform - Market size and forecast 2025-2030

Chart on On-platform - Market size and forecast 2025-2030 ($ million)
Data Table on On-platform - Market size and forecast 2025-2030 ($ million)
Chart on On-platform - Year-over-year growth 2025-2030 (%)
Data Table on On-platform - Year-over-year growth 2025-2030 (%)

8.4 Off-platform - Market size and forecast 2025-2030

Chart on Off-platform - Market size and forecast 2025-2030 ($ million)
Data Table on Off-platform - Market size and forecast 2025-2030 ($ million)
Chart on Off-platform - Year-over-year growth 2025-2030 (%)
Data Table on Off-platform - Year-over-year growth 2025-2030 (%)

8.5 Market opportunity by Channel

Market opportunity by Channel ($ million)
Data Table on Market opportunity by Channel ($ million)

9. Market Segmentation by Method

9.1 Market segments

Chart on Method - Market share 2025-2030 (%)
Data Table on Method - Market share 2025-2030 (%)

9.2 Comparison by Method

Chart on Comparison by Method
Data Table on Comparison by Method

9.3 Interest-free BNPL - Market size and forecast 2025-2030

Chart on Interest-free BNPL - Market size and forecast 2025-2030 ($ million)
Data Table on Interest-free BNPL - Market size and forecast 2025-2030 ($ million)
Chart on Interest-free BNPL - Year-over-year growth 2025-2030 (%)
Data Table on Interest-free BNPL - Year-over-year growth 2025-2030 (%)

9.4 Interest-bearing installments - Market size and forecast 2025-2030

Chart on Interest-bearing installments - Market size and forecast 2025-2030 ($ million)
Data Table on Interest-bearing installments - Market size and forecast 2025-2030 ($ million)
Chart on Interest-bearing installments - Year-over-year growth 2025-2030 (%)
Data Table on Interest-bearing installments - Year-over-year growth 2025-2030 (%)

9.5 Deferred payment - Market size and forecast 2025-2030

Chart on Deferred payment - Market size and forecast 2025-2030 ($ million)
Data Table on Deferred payment - Market size and forecast 2025-2030 ($ million)
Chart on Deferred payment - Year-over-year growth 2025-2030 (%)
Data Table on Deferred payment - Year-over-year growth 2025-2030 (%)

9.6 Market opportunity by Method

Market opportunity by Method ($ million)
Data Table on Market opportunity by Method ($ million)

10. Market Segmentation by End-user

10.1 Market segments

Chart on End-user - Market share 2025-2030 (%)
Data Table on End-user - Market share 2025-2030 (%)

10.2 Comparison by End-user

Chart on Comparison by End-user
Data Table on Comparison by End-user

10.3 Fashion and apparel - Market size and forecast 2025-2030

Chart on Fashion and apparel - Market size and forecast 2025-2030 ($ million)
Data Table on Fashion and apparel - Market size and forecast 2025-2030 ($ million)
Chart on Fashion and apparel - Year-over-year growth 2025-2030 (%)
Data Table on Fashion and apparel - Year-over-year growth 2025-2030 (%)

10.4 Consumer electronics - Market size and forecast 2025-2030

Chart on Consumer electronics - Market size and forecast 2025-2030 ($ million)
Data Table on Consumer electronics - Market size and forecast 2025-2030 ($ million)
Chart on Consumer electronics - Year-over-year growth 2025-2030 (%)
Data Table on Consumer electronics - Year-over-year growth 2025-2030 (%)

10.5 Home and furniture - Market size and forecast 2025-2030

Chart on Home and furniture - Market size and forecast 2025-2030 ($ million)
Data Table on Home and furniture - Market size and forecast 2025-2030 ($ million)
Chart on Home and furniture - Year-over-year growth 2025-2030 (%)
Data Table on Home and furniture - Year-over-year growth 2025-2030 (%)

10.6 Beauty and personal care - Market size and forecast 2025-2030

Chart on Beauty and personal care - Market size and forecast 2025-2030 ($ million)
Data Table on Beauty and personal care - Market size and forecast 2025-2030 ($ million)
Chart on Beauty and personal care - Year-over-year growth 2025-2030 (%)
Data Table on Beauty and personal care - Year-over-year growth 2025-2030 (%)

10.7 Others - Market size and forecast 2025-2030

Chart on Others - Market size and forecast 2025-2030 ($ million)
Data Table on Others - Market size and forecast 2025-2030 ($ million)
Chart on Others - Year-over-year growth 2025-2030 (%)
Data Table on Others - Year-over-year growth 2025-2030 (%)

10.8 Market opportunity by End-user

Market opportunity by End-user ($ million)
Data Table on Market opportunity by End-user ($ million)

11. Customer Landscape

11.1 Customer landscape overview

Analysis of price sensitivity, lifecycle, customer purchase basket, adoption rates, and purchase criteria

12. Geographic Landscape

12.1 Geographic segmentation

Chart on Market share by geography 2025-2030 (%)
Data Table on Market share by geography 2025-2030 (%)

12.2 Geographic comparison

Chart on Geographic comparison
Data Table on Geographic comparison

12.3 North America - Market size and forecast 2025-2030

Chart on North America - Market size and forecast 2025-2030 ($ million)
Data Table on North America - Market size and forecast 2025-2030 ($ million)
Chart on North America - Year-over-year growth 2025-2030 (%)
Data Table on North America - Year-over-year growth 2025-2030 (%)
Chart on Regional Comparison - North America
Data Table on Regional Comparison - North America

12.3.1 US - Market size and forecast 2025-2030

Chart on US - Market size and forecast 2025-2030 ($ million)
Data Table on US - Market size and forecast 2025-2030 ($ million)
Chart on US - Year-over-year growth 2025-2030 (%)
Data Table on US - Year-over-year growth 2025-2030 (%)

12.3.2 Canada - Market size and forecast 2025-2030

Chart on Canada - Market size and forecast 2025-2030 ($ million)
Data Table on Canada - Market size and forecast 2025-2030 ($ million)
Chart on Canada - Year-over-year growth 2025-2030 (%)
Data Table on Canada - Year-over-year growth 2025-2030 (%)

12.3.3 Mexico - Market size and forecast 2025-2030

Chart on Mexico - Market size and forecast 2025-2030 ($ million)
Data Table on Mexico - Market size and forecast 2025-2030 ($ million)
Chart on Mexico - Year-over-year growth 2025-2030 (%)
Data Table on Mexico - Year-over-year growth 2025-2030 (%)

12.4 Europe - Market size and forecast 2025-2030

Chart on Europe - Market size and forecast 2025-2030 ($ million)
Data Table on Europe - Market size and forecast 2025-2030 ($ million)
Chart on Europe - Year-over-year growth 2025-2030 (%)
Data Table on Europe - Year-over-year growth 2025-2030 (%)
Chart on Regional Comparison - Europe
Data Table on Regional Comparison - Europe

12.4.1 UK - Market size and forecast 2025-2030

Chart on UK - Market size and forecast 2025-2030 ($ million)
Data Table on UK - Market size and forecast 2025-2030 ($ million)
Chart on UK - Year-over-year growth 2025-2030 (%)
Data Table on UK - Year-over-year growth 2025-2030 (%)

12.4.2 Germany - Market size and forecast 2025-2030

Chart on Germany - Market size and forecast 2025-2030 ($ million)
Data Table on Germany - Market size and forecast 2025-2030 ($ million)
Chart on Germany - Year-over-year growth 2025-2030 (%)
Data Table on Germany - Year-over-year growth 2025-2030 (%)

12.4.3 France - Market size and forecast 2025-2030

Chart on France - Market size and forecast 2025-2030 ($ million)
Data Table on France - Market size and forecast 2025-2030 ($ million)
Chart on France - Year-over-year growth 2025-2030 (%)
Data Table on France - Year-over-year growth 2025-2030 (%)

12.4.4 Italy - Market size and forecast 2025-2030

Chart on Italy - Market size and forecast 2025-2030 ($ million)
Data Table on Italy - Market size and forecast 2025-2030 ($ million)
Chart on Italy - Year-over-year growth 2025-2030 (%)
Data Table on Italy - Year-over-year growth 2025-2030 (%)

12.4.5 The Netherlands - Market size and forecast 2025-2030

Chart on The Netherlands - Market size and forecast 2025-2030 ($ million)
Data Table on The Netherlands - Market size and forecast 2025-2030 ($ million)
Chart on The Netherlands - Year-over-year growth 2025-2030 (%)
Data Table on The Netherlands - Year-over-year growth 2025-2030 (%)

12.4.6 Spain - Market size and forecast 2025-2030

Chart on Spain - Market size and forecast 2025-2030 ($ million)
Data Table on Spain - Market size and forecast 2025-2030 ($ million)
Chart on Spain - Year-over-year growth 2025-2030 (%)
Data Table on Spain - Year-over-year growth 2025-2030 (%)

12.5 APAC - Market size and forecast 2025-2030

Chart on APAC - Market size and forecast 2025-2030 ($ million)
Data Table on APAC - Market size and forecast 2025-2030 ($ million)
Chart on APAC - Year-over-year growth 2025-2030 (%)
Data Table on APAC - Year-over-year growth 2025-2030 (%)
Chart on Regional Comparison - APAC
Data Table on Regional Comparison - APAC

12.5.1 China - Market size and forecast 2025-2030

Chart on China - Market size and forecast 2025-2030 ($ million)
Data Table on China - Market size and forecast 2025-2030 ($ million)
Chart on China - Year-over-year growth 2025-2030 (%)
Data Table on China - Year-over-year growth 2025-2030 (%)

12.5.2 India - Market size and forecast 2025-2030

Chart on India - Market size and forecast 2025-2030 ($ million)
Data Table on India - Market size and forecast 2025-2030 ($ million)
Chart on India - Year-over-year growth 2025-2030 (%)
Data Table on India - Year-over-year growth 2025-2030 (%)

12.5.3 Japan - Market size and forecast 2025-2030

Chart on Japan - Market size and forecast 2025-2030 ($ million)
Data Table on Japan - Market size and forecast 2025-2030 ($ million)
Chart on Japan - Year-over-year growth 2025-2030 (%)
Data Table on Japan - Year-over-year growth 2025-2030 (%)

12.5.4 Australia - Market size and forecast 2025-2030

Chart on Australia - Market size and forecast 2025-2030 ($ million)
Data Table on Australia - Market size and forecast 2025-2030 ($ million)
Chart on Australia - Year-over-year growth 2025-2030 (%)
Data Table on Australia - Year-over-year growth 2025-2030 (%)

12.5.5 South Korea - Market size and forecast 2025-2030

Chart on South Korea - Market size and forecast 2025-2030 ($ million)
Data Table on South Korea - Market size and forecast 2025-2030 ($ million)
Chart on South Korea - Year-over-year growth 2025-2030 (%)
Data Table on South Korea - Year-over-year growth 2025-2030 (%)

12.5.6 Indonesia - Market size and forecast 2025-2030

Chart on Indonesia - Market size and forecast 2025-2030 ($ million)
Data Table on Indonesia - Market size and forecast 2025-2030 ($ million)
Chart on Indonesia - Year-over-year growth 2025-2030 (%)
Data Table on Indonesia - Year-over-year growth 2025-2030 (%)

12.6 Middle East and Africa - Market size and forecast 2025-2030

Chart on Middle East and Africa - Market size and forecast 2025-2030 ($ million)
Data Table on Middle East and Africa - Market size and forecast 2025-2030 ($ million)
Chart on Middle East and Africa - Year-over-year growth 2025-2030 (%)
Data Table on Middle East and Africa - Year-over-year growth 2025-2030 (%)
Chart on Regional Comparison - Middle East and Africa
Data Table on Regional Comparison - Middle East and Africa

12.6.1 Saudi Arabia - Market size and forecast 2025-2030

Chart on Saudi Arabia - Market size and forecast 2025-2030 ($ million)
Data Table on Saudi Arabia - Market size and forecast 2025-2030 ($ million)
Chart on Saudi Arabia - Year-over-year growth 2025-2030 (%)
Data Table on Saudi Arabia - Year-over-year growth 2025-2030 (%)

12.6.2 UAE - Market size and forecast 2025-2030

Chart on UAE - Market size and forecast 2025-2030 ($ million)
Data Table on UAE - Market size and forecast 2025-2030 ($ million)
Chart on UAE - Year-over-year growth 2025-2030 (%)
Data Table on UAE - Year-over-year growth 2025-2030 (%)

12.6.3 South Africa - Market size and forecast 2025-2030

Chart on South Africa - Market size and forecast 2025-2030 ($ million)
Data Table on South Africa - Market size and forecast 2025-2030 ($ million)
Chart on South Africa - Year-over-year growth 2025-2030 (%)
Data Table on South Africa - Year-over-year growth 2025-2030 (%)

12.6.4 Israel - Market size and forecast 2025-2030

Chart on Israel - Market size and forecast 2025-2030 ($ million)
Data Table on Israel - Market size and forecast 2025-2030 ($ million)
Chart on Israel - Year-over-year growth 2025-2030 (%)
Data Table on Israel - Year-over-year growth 2025-2030 (%)

12.6.5 Turkey - Market size and forecast 2025-2030

Chart on Turkey - Market size and forecast 2025-2030 ($ million)
Data Table on Turkey - Market size and forecast 2025-2030 ($ million)
Chart on Turkey - Year-over-year growth 2025-2030 (%)
Data Table on Turkey - Year-over-year growth 2025-2030 (%)

12.7 South America - Market size and forecast 2025-2030

Chart on South America - Market size and forecast 2025-2030 ($ million)
Data Table on South America - Market size and forecast 2025-2030 ($ million)
Chart on South America - Year-over-year growth 2025-2030 (%)
Data Table on South America - Year-over-year growth 2025-2030 (%)
Chart on Regional Comparison - South America
Data Table on Regional Comparison - South America

12.7.1 Brazil - Market size and forecast 2025-2030

Chart on Brazil - Market size and forecast 2025-2030 ($ million)
Data Table on Brazil - Market size and forecast 2025-2030 ($ million)
Chart on Brazil - Year-over-year growth 2025-2030 (%)
Data Table on Brazil - Year-over-year growth 2025-2030 (%)

12.7.2 Argentina - Market size and forecast 2025-2030

Chart on Argentina - Market size and forecast 2025-2030 ($ million)
Data Table on Argentina - Market size and forecast 2025-2030 ($ million)
Chart on Argentina - Year-over-year growth 2025-2030 (%)
Data Table on Argentina - Year-over-year growth 2025-2030 (%)

12.7.3 Colombia - Market size and forecast 2025-2030

Chart on Colombia - Market size and forecast 2025-2030 ($ million)
Data Table on Colombia - Market size and forecast 2025-2030 ($ million)
Chart on Colombia - Year-over-year growth 2025-2030 (%)
Data Table on Colombia - Year-over-year growth 2025-2030 (%)

12.8 Market opportunity by geography

Market opportunity by geography ($ million)
Data Tables on Market opportunity by geography ($ million)

13. Drivers, Challenges, and Opportunity

13.1 Market drivers

Increasing consumer demand for flexible payment options
Technological advancements in financial technology and data analytics
Strategic merchant partnerships and expansion into new retail categories

13.2 Market challenges

Heightened regulatory scrutiny and compliance complexities
Rising interest rates and cost of capital
Escalating cybersecurity vulnerabilities and synthetic identity exploitation

13.3 Impact of drivers and challenges

Impact of drivers and challenges in 2025 and 2030

13.4 Market opportunities

Deepening penetration of mobile commerce and digital wallets in emerging economies
Convergence with traditional banking and mainstream financial ecosystems
Integration of sustainable commerce and purpose-driven purchasing

14. Competitive Landscape

14.1 Overview

14.2

Overview on criticality of inputs and factors of differentiation

14.3 Landscape disruption

Overview on factors of disruption

14.4 Industry risks

Impact of key risks on business

15. Competitive Analysis

15.1 Companies profiled

Companies covered

15.2 Company ranking index

15.3 Market positioning of companies

Matrix on companies position and classification

15.4 Adyen NV

Adyen NV - Overview
Adyen NV - Product / Service
Adyen NV - Key news
Adyen NV - Key offerings
SWOT

15.5 Affirm Holdings Inc.

Affirm Holdings Inc. - Overview
Affirm Holdings Inc. - Product / Service
Affirm Holdings Inc. - Key news
Affirm Holdings Inc. - Key offerings
SWOT

15.6 Alma

Alma - Overview
Alma - Product / Service
Alma - Key offerings
SWOT

15.7 Billie

Billie - Overview
Billie - Product / Service
Billie - Key offerings
SWOT

15.8 Block Inc.

Block Inc. - Overview
Block Inc. - Business segments
Block Inc. - Key news
Block Inc. - Key offerings
Block Inc. - Segment focus
SWOT

15.9 Klarna Bank AB

Klarna Bank AB - Overview
Klarna Bank AB - Product / Service
Klarna Bank AB - Key offerings
SWOT

15.10 KUESKI

KUESKI - Overview
KUESKI - Product / Service
KUESKI - Key offerings
SWOT

15.11 Marqeta Inc.

Marqeta Inc. - Overview
Marqeta Inc. - Product / Service
Marqeta Inc. - Key news
Marqeta Inc. - Key offerings
SWOT

15.12 PayPal Holdings Inc.

PayPal Holdings Inc. - Overview
PayPal Holdings Inc. - Product / Service
PayPal Holdings Inc. - Key news
PayPal Holdings Inc. - Key offerings
SWOT

15.13 Plaid Inc.

Plaid Inc. - Overview
Plaid Inc. - Product / Service
Plaid Inc. - Key offerings
SWOT

15.14 Splitit

Splitit - Overview
Splitit - Product / Service
Splitit - Key offerings
SWOT

15.15 Stripe Inc.

Stripe Inc. - Overview
Stripe Inc. - Product / Service
Stripe Inc. - Key offerings
SWOT

15.16 Sunbit Now LLC

Sunbit Now LLC - Overview
Sunbit Now LLC - Product / Service
Sunbit Now LLC - Key offerings
SWOT

15.17 Tabby LLC.

Tabby LLC. - Overview
Tabby LLC. - Product / Service
Tabby LLC. - Key offerings
SWOT

15.18 Tamara Finance Company

Tamara Finance Company - Overview
Tamara Finance Company - Product / Service
Tamara Finance Company - Key offerings
SWOT

16. Appendix

16.1 Scope of the report

Market definition
Objectives
Notes and caveats

16.2 Inclusions and exclusions checklist

Inclusions checklist
Exclusions checklist

16.3 Currency conversion rates for US$

16.4 Research methodology

16.5 Data procurement

Information sources

16.6 Data validation

16.7 Validation techniques employed for market sizing

16.8 Data synthesis

16.9 360 degree market analysis

16.10 List of abbreviations

Research Methodology

Technavio presents a detailed picture of the market by way of study, synthesis, and summation of data from multiple sources. The analysts have presented the various facets of the market with a particular focus on identifying the key industry influencers. The data thus presented is comprehensive, reliable, and the result of extensive research, both primary and secondary.

INFORMATION SOURCES

Primary sources

  • Manufacturers and suppliers
  • Channel partners
  • Industry experts
  • Strategic decision makers

Secondary sources

  • Industry journals and periodicals
  • Government data
  • Financial reports of key industry players
  • Historical data
  • Press releases

DATA ANALYSIS

Data Synthesis

  • Collation of data
  • Estimation of key figures
  • Analysis of derived insights

Data Validation

  • Triangulation with data models
  • Reference against proprietary databases
  • Corroboration with industry experts

REPORT WRITING

Qualitative

  • Market drivers
  • Market challenges
  • Market trends
  • Five forces analysis

Quantitative

  • Market size and forecast
  • Market segmentation
  • Geographical insights
  • Competitive landscape

Interested in this report?

Get your sample now to see our research methodology and insights!

Download Now

Frequently Asked Questions

Buy-Now-Pay-Later Solutions In E-Commerce market growth will increase by USD 27845.7 million during 2026-2030.

The Buy-Now-Pay-Later Solutions In E-Commerce market is expected to grow at a CAGR of 32.3% during 2026-2030.

Buy-Now-Pay-Later Solutions In E-Commerce market is segmented by Channel (On-platform, Off-platform) Method (Interest-free BNPL, Interest-bearing installments, Deferred payment) End-user (Fashion and apparel, Consumer electronics, Home and furniture, Beauty and personal care, Others)

Adyen NV, Affirm Holdings Inc., Alma, Billie, Block Inc., Cross River Bank, Four Technologies Inc., Klarna Bank AB, KUESKI, Marqeta Inc., PayPal Holdings Inc., Plaid Inc., Solaris SE, Splitit, Stripe Inc., Sunbit Now LLC, Tabby LLC., Tamara Finance Company, Unit Finance Inc., Upgrade Inc. are a few of the key vendors in the Buy-Now-Pay-Later Solutions In E-Commerce market.

North America will register the highest growth rate of 32.6% among the other regions. Therefore, the Buy-Now-Pay-Later Solutions In E-Commerce market in North America is expected to garner significant business opportunities for the vendors during the forecast period.

US, Canada, Mexico, UK, Germany, France, Italy, The Netherlands, Spain, China, India, Japan, Australia, South Korea, Indonesia, Saudi Arabia, UAE, South Africa, Israel, Turkey, Brazil, Argentina, Colombia

  • Increasing consumer demand for flexible payment options is the driving factor this market.

The Buy-Now-Pay-Later Solutions In E-Commerce market vendors should focus on grabbing business opportunities from the Channel segment as it accounted for the largest market share in the base year.
RIA - Research AI Assistant
Ask RIA