Benefits Administration Service Market Analysis, Size, and Forecast 2026-2030: North America (US, Canada, and Mexico), Europe (Germany, UK, and France), APAC (China, Japan, and India), Middle East and Africa (Saudi Arabia, UAE, and South Africa), South America (Brazil and Argentina), and Rest of World (ROW)

Benefits Administration Service Market Analysis, Size, and Forecast 2026-2030:
North America (US, Canada, and Mexico), Europe (Germany, UK, and France), APAC (China, Japan, and India), Middle East and Africa (Saudi Arabia, UAE, and South Africa), South America (Brazil and Argentina), and Rest of World (ROW)

Published: May 2026 303 Pages SKU: IRTNTR80024

Market Overview at a Glance

$151.4 B
Market Opportunity
3.1%
CAGR 2025 - 2030
31.7%
North America Growth
$429.8 B
Core benefits administration segment 2024

Benefits Administration Service Market Size 2026-2030

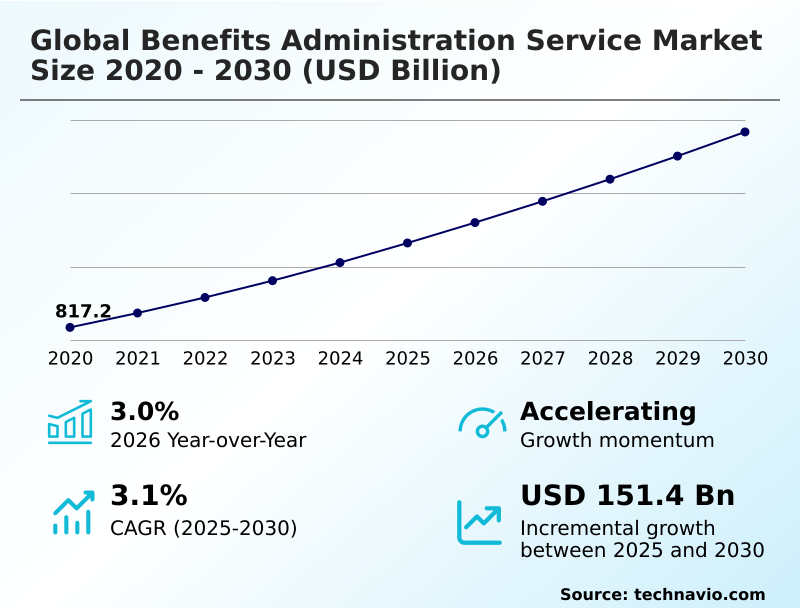
The benefits administration service market size is valued to increase by USD 151.4 billion, at a CAGR of 3.1% from 2025 to 2030. Increasing complexity of regulatory compliance and legislative mandates will drive the benefits administration service market.

Major Market Trends & Insights

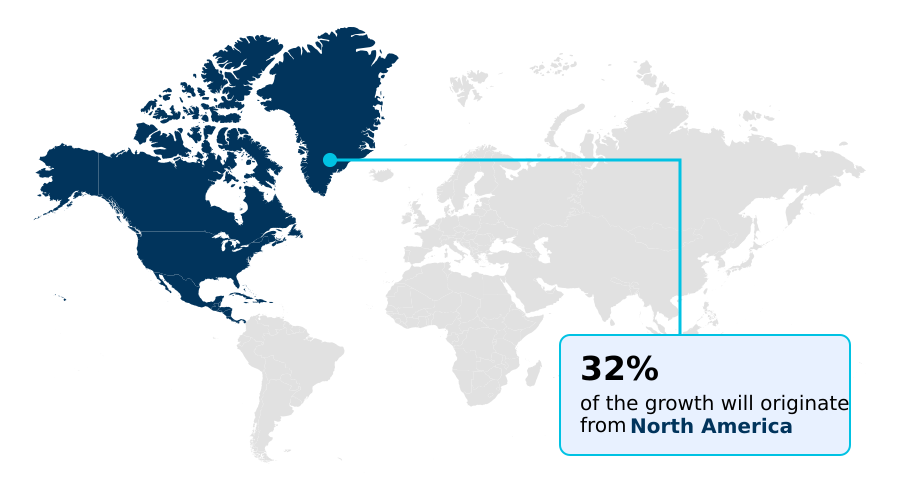
  • North America dominated the market and accounted for a 31.7% growth during the forecast period.
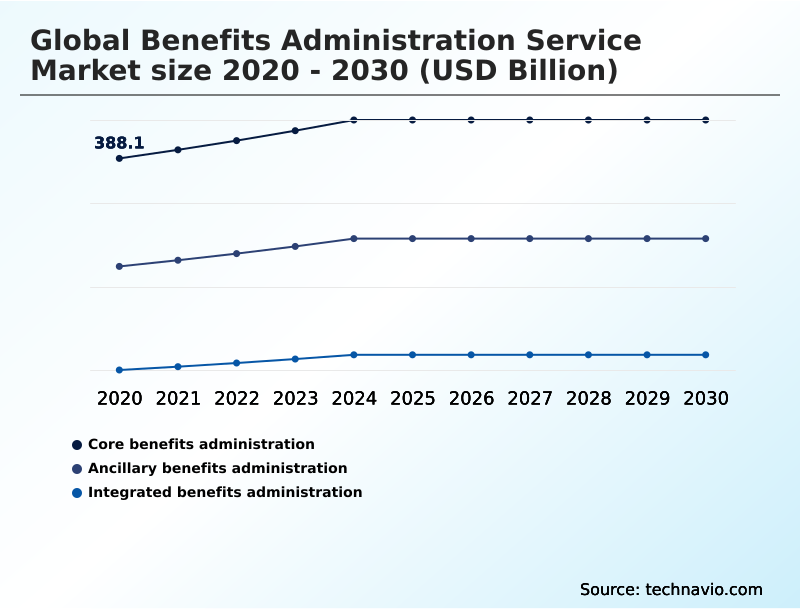
  • By Service Type - Core benefits administration segment was valued at USD 429.8 billion in 2024
  • By End-user - Employers segment accounted for the largest market revenue share in 2024

Market Size & Forecast

  • Market Opportunities: USD 266.5 billion
  • Market Future Opportunities: USD 151.4 billion
  • CAGR from 2025 to 2030 : 3.1%

Market Summary

  • The benefits administration service market is undergoing a significant transformation, moving away from manual processes toward integrated digital ecosystems. This evolution is driven by the need for robust regulatory compliance management and the strategic goal of enhancing the employee experience. Organizations are increasingly adopting a unified benefits platform to streamline operations, from open enrollment support to life event changes processing.
  • For instance, a multinational corporation can use a single platform for global benefits harmonization, ensuring adherence to different local statutory benefits compliance rules while offering a consistent experience. These systems leverage AI-powered decision support and an automated data feed to provide personalized benefits recommendations.
  • However, challenges such as benefits data security and the complexity of third-party administrator integration require continuous investment in technology like advanced data encryption standards and secure API-based system integration, making benefits administration outsourcing (BAO) a compelling strategy for mitigating risk and focusing on core business functions.

What will be the Size of the Benefits Administration Service Market during the forecast period?

Get Key Insights on Market Forecast (PDF) Get Free Sample

How is the Benefits Administration Service Market Segmented?

The benefits administration service industry research report provides comprehensive data (region-wise segment analysis), with forecasts and estimates in "USD billion" for the period 2026-2030, as well as historical data from 2020-2024 for the following segments.

  • Service type
    • Core benefits administration
    • Ancillary benefits administration
    • Integrated benefits administration
  • End-user
    • Employers
    • Insurance companies
    • Government agencies
    • Third-party administrators (TPAs)
    • Brokers and consultants
  • Deployment
    • Cloud-based
    • On-premises
  • Geography
    • North America
      • US
      • Canada
      • Mexico
    • Europe
      • Germany
      • UK
      • France
    • APAC
      • China
      • Japan
      • India
    • Middle East and Africa
      • Saudi Arabia
      • UAE
      • South Africa
    • South America
      • Brazil
      • Argentina
    • Rest of World (ROW)

By Service Type Insights

The core benefits administration segment is estimated to witness significant growth during the forecast period.

The core benefits administration segment remains the foundational component of the market, primarily managing employer-sponsored health insurance, retirement savings, and life and disability coverage.

Its significance is driven by the immense administrative burden associated with regulatory compliance management under frameworks like ERISA and the ACA. Enterprises leverage specialized providers for eligibility tracking, enrollment processing, claims coordination, and automated compliance reporting.

Modernization is propelled by the adoption of a unified benefits platform with an employee self-service portal, which has been shown to reduce enrollment data errors by over 15%.

This technology, featuring benefits communication tools and mobile benefits access, is crucial for improving the user experience and providing robust data analytics to control escalating costs.

Get Free Sample

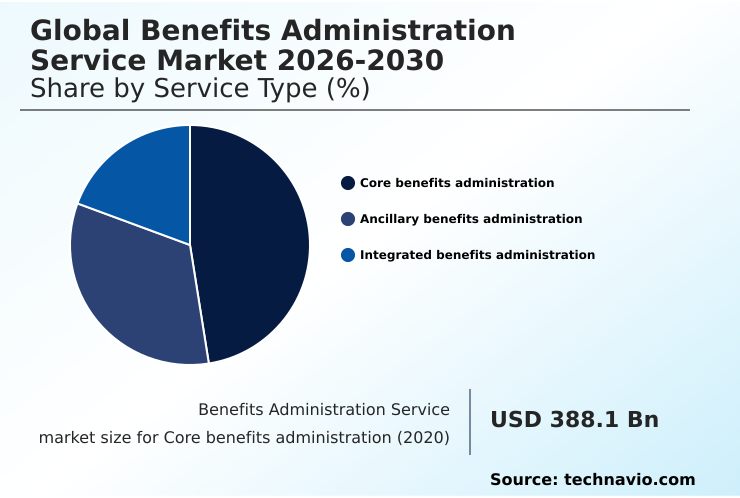
The Core benefits administration segment was valued at USD 429.8 billion in 2024 and showed a gradual increase during the forecast period.

Get Free Sample

Regional Analysis

North America is estimated to contribute 31.7% to the growth of the global market during the forecast period.Technavio’s analysts have elaborately explained the regional trends and drivers that shape the market during the forecast period.

See How Benefits Administration Service Market Demand is Rising in North America Get Free Sample

The global geographic landscape is marked by distinct regional dynamics. North America, the most mature market, accounts for over 31% of the global growth, driven by complex regulations and a focus on wellness program integration.

The region's high adoption of cloud solutions sets it apart. In contrast, the APAC region is characterized by rapid, mobile-first growth, with its market expansion rate outpacing Europe's by a nearly 2:1 ratio.

European operations are defined by fragmentation, requiring deep expertise in statutory benefits compliance across numerous countries. This complexity drives demand for multi-country plan configuration tools and a white-label benefits portal.

Successful global providers offer solutions that cater to these regional nuances, from a sophisticated leave management system in Europe to a flexible benefits plan for the diverse APAC workforce, all while ensuring robust data migration services.

Market Dynamics

Our researchers analyzed the data with 2025 as the base year, along with the key drivers, trends, and challenges. A holistic analysis of drivers will help companies refine their marketing strategies to gain a competitive advantage.

  • The future of the global benefits administration service market 2026-2030 is being shaped by a strategic pivot towards comprehensive, technology-driven solutions. Companies are moving beyond basic services to demand a unified benefits and payroll integration that provides a single source of truth for all employee data.
  • The adoption of a mobile-first benefits engagement platform is becoming standard, simplifying open enrollment for employees and increasing interaction with their total rewards and compensation statements. A key area of innovation is the use of AI-powered benefits decision support tools, which guide employees toward optimal choices.
  • For administrators, automating dependent eligibility verification and streamlining ACA reporting and compliance automation are critical for efficiency. As organizations expand globally, the technology for global benefits harmonization and the ability to manage multi-country benefit plans are paramount. This has led to the rise of multi-carrier benefits marketplace platform that also facilitates the administration of voluntary benefit programs.
  • Providers offering secure cloud-based benefits administration with real-time benefits data analytics are gaining a significant competitive edge. Companies using these advanced dashboards report decision-making speeds more than twice as fast as those relying on quarterly manual reports.
  • The complexity of HSA and FSA account administration, along with outsourced COBRA administration services, remains a core offering, especially for benefits administration for small business. Finally, expertise in legacy system to cloud platform migration and ensuring compliance with GDPR in benefits is crucial for long-term partnerships.

What are the key market drivers leading to the rise in the adoption of Benefits Administration Service Industry?

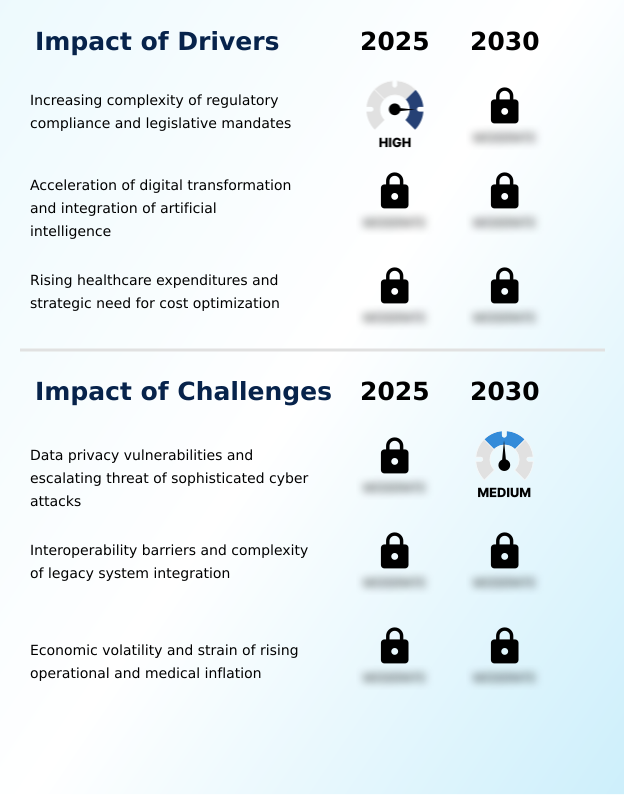
  • The escalating complexity of regulatory compliance and diverse legislative mandates is a primary driver compelling organizations to adopt specialized administration services.

  • The market's growth is heavily fueled by escalating regulatory complexity and technological acceleration.
  • The burden of maintaining statutory benefits compliance across multiple jurisdictions drives the adoption of platforms with automated compliance reporting, which can reduce associated administrative labor by over 40%.
  • The rapid integration of AI and cloud computing, particularly in a human capital management (HCM) suite, offers significant ROI, with cloud deployments yielding returns more than double that of on-premise systems within three years.
  • This technological shift enables advanced benefits cost analysis and plan modeling.
  • Furthermore, the use of an automated data feed and strong API capabilities for third-party administrator integration enhances data accuracy and operational efficiency, making benefits administration outsourcing (BAO) a strategically sound decision for many firms.

What are the market trends shaping the Benefits Administration Service Industry?

  • A defining market trend is the proliferation of hyper-personalization and lifestyle-centric benefit menus. This strategic shift addresses the diverse needs of a multigenerational workforce.

  • Key trends are reshaping service delivery, with a focus on personalization and holistic well-being. The move toward hyper-personalized benefit ecosystems, supported by a voluntary benefits marketplace, is driving employee engagement metrics up by over 20%.
  • Administration platforms are evolving to provide a unified interface for medical, mental, and financial wellness, where integration with an employee assistance program (EAP) can reduce absenteeism by up to 15%. This requires sophisticated plan configuration tools and seamless wellness program integration.
  • The use of AI-powered decision support for personalized benefits recommendation during enrollment is becoming a key differentiator, improving employee satisfaction significantly. This evolution necessitates a robust technical foundation, including a secure multi-tenant architecture and strong carrier connectivity to manage a diverse array of offerings.

What challenges does the Benefits Administration Service Industry face during its growth?

  • Significant data privacy vulnerabilities and the escalating threat of sophisticated cyber attacks present a primary challenge affecting the growth and stability of the industry.

  • Primary challenges revolve around data security and system interoperability. The increasing digitization of sensitive employee data makes benefits data security a top priority, with breaches in this sector costing an average of 35% more to remediate than in less regulated industries. Providers must invest heavily in data encryption standards and single sign-on (SSO) authentication.
  • A persistent hurdle is the complexity of legacy system integration; over 50% of data migration services projects face significant delays or budget overruns without a clear strategy.
  • The lack of seamless interoperability between modern platforms and older HRIS or payroll systems creates data silos and requires extensive use of APIs and custom development, which can hinder the deployment of a truly unified benefits platform.

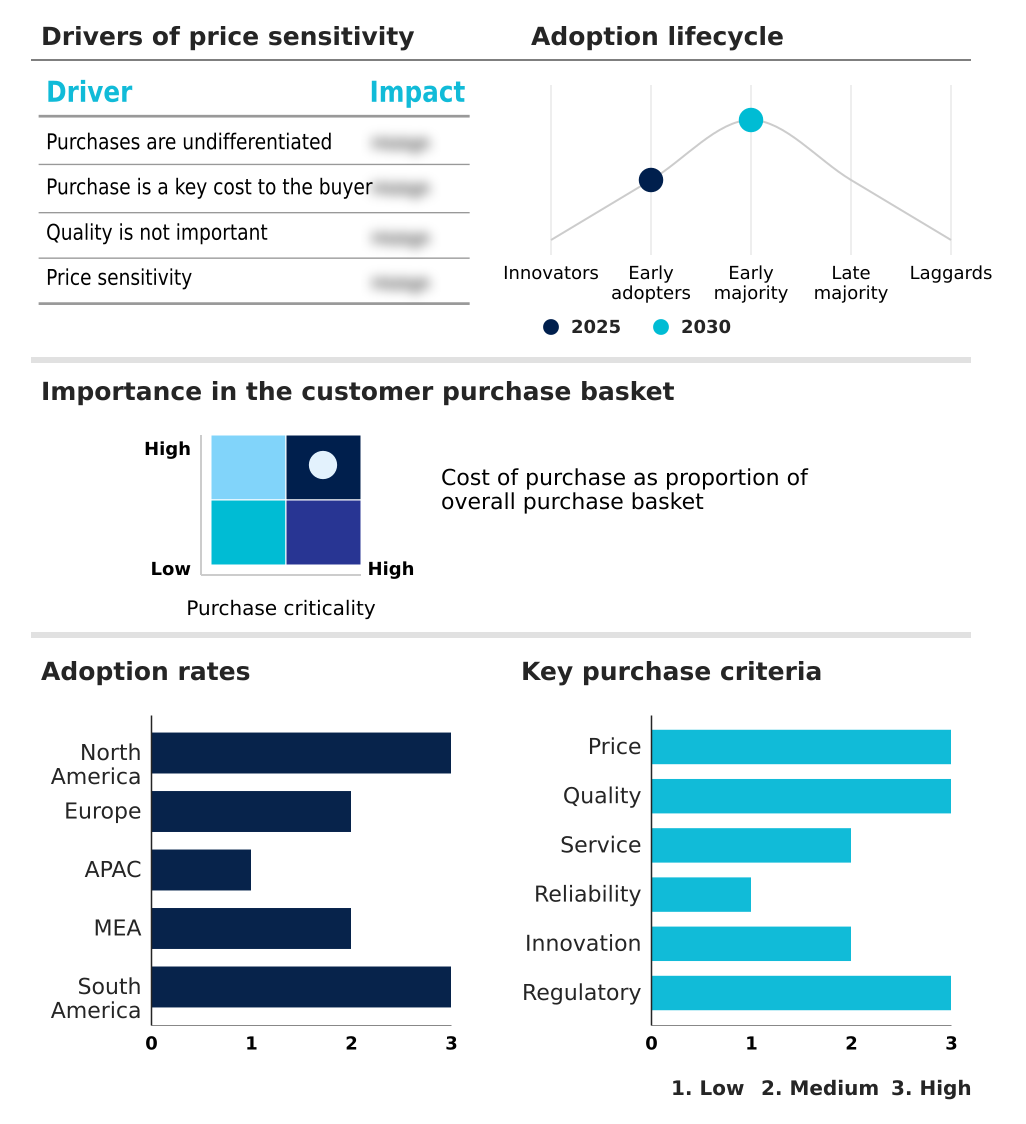
Exclusive Technavio Analysis on Customer Landscape

The benefits administration service market forecasting report includes the adoption lifecycle of the market, covering from the innovator’s stage to the laggard’s stage. It focuses on adoption rates in different regions based on penetration. Furthermore, the benefits administration service market report also includes key purchase criteria and drivers of price sensitivity to help companies evaluate and develop their market growth analysis strategies.

Customer Landscape of Benefits Administration Service Industry

Competitive Landscape

Companies are implementing various strategies, such as strategic alliances, benefits administration service market forecast, partnerships, mergers and acquisitions, geographical expansion, and product/service launches, to enhance their presence in the industry.

Alight Inc. - Key solutions include unified benefits platforms and outsourcing services focused on regulatory compliance management, cost containment, and enhanced employee engagement through advanced technology.

The industry research and growth report includes detailed analyses of the competitive landscape of the market and information about key companies, including:

  • Alight Inc.
  • Aon plc
  • Automatic Data Processing Inc.
  • Bamboo HR LLC
  • BAS Ltd
  • Cognizant Technology Solution
  • Conduent Inc.
  • Dayforce Inc.
  • Deel Inc.
  • Fidelity Investments
  • Insperity Inc.
  • Justworks Inc.
  • Mercer LLC
  • Oracle Corp.
  • Paychex Inc.
  • Paycom Software Inc.
  • SAP SE
  • TriNet Group Inc.
  • WEX Inc.
  • Workday Inc.

Qualitative and quantitative analysis of companies has been conducted to help clients understand the wider business environment as well as the strengths and weaknesses of key industry players. Data is qualitatively analyzed to categorize companies as pure play, category-focused, industry-focused, and diversified; it is quantitatively analyzed to categorize companies as dominant, leading, strong, tentative, and weak.

Recent Development and News in Benefits administration service market

  • In May 2025, the Indian government's Unified Employee Welfare Standard framework, mandating digital platforms for statutory benefits, prompted PeopleFirst India to launch its SaralSuraksha platform to ensure compliance.
  • In April 2025, EuroBen Solutions acquired AsiaHR Tech, a Singapore-based firm, to strengthen its presence in the Asia-Pacific market by integrating a localized, mobile-centric benefits platform.
  • In March 2025, BenefitCorp USA partnered with FinWell to integrate AI-driven financial planning tools into its benefits enrollment platform, offering employees a holistic view of their financial health.
  • In February 2025, a consortium of European firms launched the EuroBenefits Unified platform, a cross-border compliance system using an advanced rules engine to manage disparate national regulations within a single interface.

Dive into Technavio’s robust research methodology, blending expert interviews, extensive data synthesis, and validated models for unparalleled Benefits Administration Service Market insights. See full methodology.

Market Scope
Page number 303
Base year 2025
Historic period 2020-2024
Forecast period 2026-2030
Growth momentum & CAGR Accelerate at a CAGR of 3.1%
Market growth 2026-2030 USD 151.4 billion
Market structure Fragmented
YoY growth 2025-2026(%) 3.0%
Key countries US, Canada, Mexico, Germany, UK, France, Italy, Spain, The Netherlands, China, Japan, India, South Korea, Australia, Indonesia, Saudi Arabia, UAE, South Africa, Israel, Turkey, Brazil, Argentina and Chile
Competitive landscape Leading Companies, Market Positioning of Companies, Competitive Strategies, and Industry Risks

Request Free Sample

Research Analyst Overview

  • The market is rapidly evolving beyond transactional processing to become a strategic asset for talent management. The widespread adoption of a unified benefits platform is central to this shift, consolidating everything from the pension administration system and defined contribution plan admin to a voluntary benefits marketplace.
  • Leading solutions offer a robust payroll integration module and a sophisticated data analytics dashboard, enabling real-time claims data analysis. A key boardroom consideration is achieving global benefits harmonization, which requires a platform with deep plan configuration tools and a multi-tenant architecture.
  • For instance, implementation of a consolidated billing system and new hire enrollment automation has demonstrated a reduction in administrative processing time by up to 30%. The integration of an absence management solution and leave management system within the same ecosystem is becoming standard.
  • Furthermore, the focus on experience is driving demand for a responsive employee self-service portal with mobile benefits access, a white-label benefits portal for branding, and effective benefits communication tools to articulate the value of offerings.
  • Ensuring benefits data security through an API-based system integration, managing dependent eligibility verification, processing life event changes, and handling evidence of insurability (EOI) are critical operational capabilities. Providers are also differentiating with open enrollment support, AI-powered decision support for complex choices like a flexible benefits plan, and seamless third-party administrator integration for offerings like health savings account administration.
  • Ultimately, success hinges on delivering automated compliance reporting and robust regulatory compliance management, particularly for COBRA administration and ERISA compliance software, all while providing a clear total rewards statement.

What are the Key Data Covered in this Benefits Administration Service Market Research and Growth Report?

  • What is the expected growth of the Benefits Administration Service Market between 2026 and 2030?

    • USD 151.4 billion, at a CAGR of 3.1%

  • What segmentation does the market report cover?

    • The report is segmented by Service Type (Core benefits administration, Ancillary benefits administration, and Integrated benefits administration), End-user (Employers, Insurance companies, Government agencies, Third-party administrators (TPAs), and Brokers and consultants), Deployment (Cloud-based, and On-premises) and Geography (North America, Europe, APAC, Middle East and Africa, South America)

  • Which regions are analyzed in the report?

    • North America, Europe, APAC, Middle East and Africa and South America

  • What are the key growth drivers and market challenges?

    • Increasing complexity of regulatory compliance and legislative mandates, Data privacy vulnerabilities and escalating threat of sophisticated cyber attacks

  • Who are the major players in the Benefits Administration Service Market?

    • Alight Inc., Aon plc, Automatic Data Processing Inc., Bamboo HR LLC, BAS Ltd, Cognizant Technology Solution, Conduent Inc., Dayforce Inc., Deel Inc., Fidelity Investments, Insperity Inc., Justworks Inc., Mercer LLC, Oracle Corp., Paychex Inc., Paycom Software Inc., SAP SE, TriNet Group Inc., WEX Inc. and Workday Inc.

Market Research Insights

  • The market's dynamic nature is shaped by the interplay between technology providers and service-oriented firms. The adoption of a comprehensive human capital management (HCM) suite that includes benefits administration is rising, with businesses seeing a 30% improvement in data consistency compared to using disparate systems.
  • Top-tier providers differentiate themselves by adhering to stringent service level agreements (SLAs), with client satisfaction rates over 95% being a key benchmark. The business process outsourcing (BPO) model continues to evolve, incorporating advanced reporting and analytics tools that enable a 20% more effective benefits cost analysis.
  • This strategic shift allows HR leaders to transition from administrative oversight to data-driven workforce planning, leveraging insights from their vendor management system to optimize total rewards strategies.

We can help! Our analysts can customize this benefits administration service market research report to meet your requirements.

Get in touch

1. Executive Summary

1.1 Market overview

Executive Summary - Chart on Market Overview
Executive Summary - Data Table on Market Overview
Executive Summary - Chart on Global Market Characteristics
Executive Summary - Chart on Market by Geography
Executive Summary - Chart on Market Segmentation by Service Type
Executive Summary - Chart on Market Segmentation by End-user
Executive Summary - Chart on Market Segmentation by Deployment
Executive Summary - Chart on Incremental Growth
Executive Summary - Data Table on Incremental Growth
Executive Summary - Chart on Company Market Positioning

2. Technavio Analysis

2.1 Analysis of price sensitivity, lifecycle, customer purchase basket, adoption rates, and purchase criteria

2.2 Criticality of inputs and Factors of differentiation

Chart on Overview on criticality of inputs and factors of differentiation

2.3 Factors of disruption

Chart on Overview on factors of disruption

2.4 Impact of drivers and challenges

Chart on Impact of drivers and challenges in 2025 and 2030

3. Market Landscape

3.1 Market ecosystem

Chart on Parent Market
Data Table on - Parent Market

3.2 Market characteristics

Chart on Market characteristics analysis

3.3 Value chain analysis

Chart on Value chain analysis

4. Market Sizing

4.1 Market definition

Data Table on Offerings of companies included in the market definition

4.2 Market segment analysis

Market segments

4.3 Market size 2025

4.4 Market outlook: Forecast for 2025-2030

Chart on Global - Market size and forecast 2025-2030 ($ billion)
Data Table on Global - Market size and forecast 2025-2030 ($ billion)
Chart on Global Market: Year-over-year growth 2025-2030 (%)
Data Table on Global Market: Year-over-year growth 2025-2030 (%)

5. Historic Market Size

5.1 Global Benefits Administration Service Market 2020 - 2024

Historic Market Size - Data Table on Global Benefits Administration Service Market 2020 - 2024 ($ billion)

5.2 Service Type segment analysis 2020 - 2024

Historic Market Size - Service Type Segment 2020 - 2024 ($ billion)

5.3 End-user segment analysis 2020 - 2024

Historic Market Size - End-user Segment 2020 - 2024 ($ billion)

5.4 Deployment segment analysis 2020 - 2024

Historic Market Size - Deployment Segment 2020 - 2024 ($ billion)

5.5 Geography segment analysis 2020 - 2024

Historic Market Size - Geography Segment 2020 - 2024 ($ billion)

5.6 Country segment analysis 2020 - 2024

Historic Market Size - Country Segment 2020 - 2024 ($ billion)

6. Qualitative Analysis

6.1 Impact of AI on global benefits administration service market

6.2 Impact of geopolitical conflicts on global benefits administration service market

7. Five Forces Analysis

7.1 Five forces summary

Five forces analysis - Comparison between 2025 and 2030

7.2 Bargaining power of buyers

Bargaining power of buyers - Impact of key factors 2025 and 2030

7.3 Bargaining power of suppliers

Bargaining power of suppliers - Impact of key factors in 2025 and 2030

7.4 Threat of new entrants

Threat of new entrants - Impact of key factors in 2025 and 2030

7.5 Threat of substitutes

Threat of substitutes - Impact of key factors in 2025 and 2030

7.6 Threat of rivalry

Threat of rivalry - Impact of key factors in 2025 and 2030

7.7 Market condition

Chart on Market condition - Five forces 2025 and 2030

8. Market Segmentation by Service Type

8.1 Market segments

Chart on Service Type - Market share 2025-2030 (%)
Data Table on Service Type - Market share 2025-2030 (%)

8.2 Comparison by Service Type

Chart on Comparison by Service Type
Data Table on Comparison by Service Type

8.3 Core benefits administration - Market size and forecast 2025-2030

Chart on Core benefits administration - Market size and forecast 2025-2030 ($ billion)
Data Table on Core benefits administration - Market size and forecast 2025-2030 ($ billion)
Chart on Core benefits administration - Year-over-year growth 2025-2030 (%)
Data Table on Core benefits administration - Year-over-year growth 2025-2030 (%)

8.4 Ancillary benefits administration - Market size and forecast 2025-2030

Chart on Ancillary benefits administration - Market size and forecast 2025-2030 ($ billion)
Data Table on Ancillary benefits administration - Market size and forecast 2025-2030 ($ billion)
Chart on Ancillary benefits administration - Year-over-year growth 2025-2030 (%)
Data Table on Ancillary benefits administration - Year-over-year growth 2025-2030 (%)

8.5 Integrated benefits administration - Market size and forecast 2025-2030

Chart on Integrated benefits administration - Market size and forecast 2025-2030 ($ billion)
Data Table on Integrated benefits administration - Market size and forecast 2025-2030 ($ billion)
Chart on Integrated benefits administration - Year-over-year growth 2025-2030 (%)
Data Table on Integrated benefits administration - Year-over-year growth 2025-2030 (%)

8.6 Market opportunity by Service Type

Market opportunity by Service Type ($ billion)
Data Table on Market opportunity by Service Type ($ billion)

9. Market Segmentation by End-user

9.1 Market segments

Chart on End-user - Market share 2025-2030 (%)
Data Table on End-user - Market share 2025-2030 (%)

9.2 Comparison by End-user

Chart on Comparison by End-user
Data Table on Comparison by End-user

9.3 Employers - Market size and forecast 2025-2030

Chart on Employers - Market size and forecast 2025-2030 ($ billion)
Data Table on Employers - Market size and forecast 2025-2030 ($ billion)
Chart on Employers - Year-over-year growth 2025-2030 (%)
Data Table on Employers - Year-over-year growth 2025-2030 (%)

9.4 Insurance companies - Market size and forecast 2025-2030

Chart on Insurance companies - Market size and forecast 2025-2030 ($ billion)
Data Table on Insurance companies - Market size and forecast 2025-2030 ($ billion)
Chart on Insurance companies - Year-over-year growth 2025-2030 (%)
Data Table on Insurance companies - Year-over-year growth 2025-2030 (%)

9.5 Government agencies - Market size and forecast 2025-2030

Chart on Government agencies - Market size and forecast 2025-2030 ($ billion)
Data Table on Government agencies - Market size and forecast 2025-2030 ($ billion)
Chart on Government agencies - Year-over-year growth 2025-2030 (%)
Data Table on Government agencies - Year-over-year growth 2025-2030 (%)

9.6 Third-party administrators (TPAs) - Market size and forecast 2025-2030

Chart on Third-party administrators (TPAs) - Market size and forecast 2025-2030 ($ billion)
Data Table on Third-party administrators (TPAs) - Market size and forecast 2025-2030 ($ billion)
Chart on Third-party administrators (TPAs) - Year-over-year growth 2025-2030 (%)
Data Table on Third-party administrators (TPAs) - Year-over-year growth 2025-2030 (%)

9.7 Brokers and consultants - Market size and forecast 2025-2030

Chart on Brokers and consultants - Market size and forecast 2025-2030 ($ billion)
Data Table on Brokers and consultants - Market size and forecast 2025-2030 ($ billion)
Chart on Brokers and consultants - Year-over-year growth 2025-2030 (%)
Data Table on Brokers and consultants - Year-over-year growth 2025-2030 (%)

9.8 Market opportunity by End-user

Market opportunity by End-user ($ billion)
Data Table on Market opportunity by End-user ($ billion)

10. Market Segmentation by Deployment

10.1 Market segments

Chart on Deployment - Market share 2025-2030 (%)
Data Table on Deployment - Market share 2025-2030 (%)

10.2 Comparison by Deployment

Chart on Comparison by Deployment
Data Table on Comparison by Deployment

10.3 Cloud-based - Market size and forecast 2025-2030

Chart on Cloud-based - Market size and forecast 2025-2030 ($ billion)
Data Table on Cloud-based - Market size and forecast 2025-2030 ($ billion)
Chart on Cloud-based - Year-over-year growth 2025-2030 (%)
Data Table on Cloud-based - Year-over-year growth 2025-2030 (%)

10.4 On-premises - Market size and forecast 2025-2030

Chart on On-premises - Market size and forecast 2025-2030 ($ billion)
Data Table on On-premises - Market size and forecast 2025-2030 ($ billion)
Chart on On-premises - Year-over-year growth 2025-2030 (%)
Data Table on On-premises - Year-over-year growth 2025-2030 (%)

10.5 Market opportunity by Deployment

Market opportunity by Deployment ($ billion)
Data Table on Market opportunity by Deployment ($ billion)

11. Customer Landscape

11.1 Customer landscape overview

Analysis of price sensitivity, lifecycle, customer purchase basket, adoption rates, and purchase criteria

12. Geographic Landscape

12.1 Geographic segmentation

Chart on Market share by geography 2025-2030 (%)
Data Table on Market share by geography 2025-2030 (%)

12.2 Geographic comparison

Chart on Geographic comparison
Data Table on Geographic comparison

12.3 North America - Market size and forecast 2025-2030

Chart on North America - Market size and forecast 2025-2030 ($ billion)
Data Table on North America - Market size and forecast 2025-2030 ($ billion)
Chart on North America - Year-over-year growth 2025-2030 (%)
Data Table on North America - Year-over-year growth 2025-2030 (%)
Chart on Regional Comparison - North America
Data Table on Regional Comparison - North America

12.3.1 US - Market size and forecast 2025-2030

Chart on US - Market size and forecast 2025-2030 ($ billion)
Data Table on US - Market size and forecast 2025-2030 ($ billion)
Chart on US - Year-over-year growth 2025-2030 (%)
Data Table on US - Year-over-year growth 2025-2030 (%)

12.3.2 Canada - Market size and forecast 2025-2030

Chart on Canada - Market size and forecast 2025-2030 ($ billion)
Data Table on Canada - Market size and forecast 2025-2030 ($ billion)
Chart on Canada - Year-over-year growth 2025-2030 (%)
Data Table on Canada - Year-over-year growth 2025-2030 (%)

12.3.3 Mexico - Market size and forecast 2025-2030

Chart on Mexico - Market size and forecast 2025-2030 ($ billion)
Data Table on Mexico - Market size and forecast 2025-2030 ($ billion)
Chart on Mexico - Year-over-year growth 2025-2030 (%)
Data Table on Mexico - Year-over-year growth 2025-2030 (%)

12.4 Europe - Market size and forecast 2025-2030

Chart on Europe - Market size and forecast 2025-2030 ($ billion)
Data Table on Europe - Market size and forecast 2025-2030 ($ billion)
Chart on Europe - Year-over-year growth 2025-2030 (%)
Data Table on Europe - Year-over-year growth 2025-2030 (%)
Chart on Regional Comparison - Europe
Data Table on Regional Comparison - Europe

12.4.1 Germany - Market size and forecast 2025-2030

Chart on Germany - Market size and forecast 2025-2030 ($ billion)
Data Table on Germany - Market size and forecast 2025-2030 ($ billion)
Chart on Germany - Year-over-year growth 2025-2030 (%)
Data Table on Germany - Year-over-year growth 2025-2030 (%)

12.4.2 UK - Market size and forecast 2025-2030

Chart on UK - Market size and forecast 2025-2030 ($ billion)
Data Table on UK - Market size and forecast 2025-2030 ($ billion)
Chart on UK - Year-over-year growth 2025-2030 (%)
Data Table on UK - Year-over-year growth 2025-2030 (%)

12.4.3 France - Market size and forecast 2025-2030

Chart on France - Market size and forecast 2025-2030 ($ billion)
Data Table on France - Market size and forecast 2025-2030 ($ billion)
Chart on France - Year-over-year growth 2025-2030 (%)
Data Table on France - Year-over-year growth 2025-2030 (%)

12.4.4 Italy - Market size and forecast 2025-2030

Chart on Italy - Market size and forecast 2025-2030 ($ billion)
Data Table on Italy - Market size and forecast 2025-2030 ($ billion)
Chart on Italy - Year-over-year growth 2025-2030 (%)
Data Table on Italy - Year-over-year growth 2025-2030 (%)

12.4.5 Spain - Market size and forecast 2025-2030

Chart on Spain - Market size and forecast 2025-2030 ($ billion)
Data Table on Spain - Market size and forecast 2025-2030 ($ billion)
Chart on Spain - Year-over-year growth 2025-2030 (%)
Data Table on Spain - Year-over-year growth 2025-2030 (%)

12.4.6 The Netherlands - Market size and forecast 2025-2030

Chart on The Netherlands - Market size and forecast 2025-2030 ($ billion)
Data Table on The Netherlands - Market size and forecast 2025-2030 ($ billion)
Chart on The Netherlands - Year-over-year growth 2025-2030 (%)
Data Table on The Netherlands - Year-over-year growth 2025-2030 (%)

12.5 APAC - Market size and forecast 2025-2030

Chart on APAC - Market size and forecast 2025-2030 ($ billion)
Data Table on APAC - Market size and forecast 2025-2030 ($ billion)
Chart on APAC - Year-over-year growth 2025-2030 (%)
Data Table on APAC - Year-over-year growth 2025-2030 (%)
Chart on Regional Comparison - APAC
Data Table on Regional Comparison - APAC

12.5.1 China - Market size and forecast 2025-2030

Chart on China - Market size and forecast 2025-2030 ($ billion)
Data Table on China - Market size and forecast 2025-2030 ($ billion)
Chart on China - Year-over-year growth 2025-2030 (%)
Data Table on China - Year-over-year growth 2025-2030 (%)

12.5.2 Japan - Market size and forecast 2025-2030

Chart on Japan - Market size and forecast 2025-2030 ($ billion)
Data Table on Japan - Market size and forecast 2025-2030 ($ billion)
Chart on Japan - Year-over-year growth 2025-2030 (%)
Data Table on Japan - Year-over-year growth 2025-2030 (%)

12.5.3 India - Market size and forecast 2025-2030

Chart on India - Market size and forecast 2025-2030 ($ billion)
Data Table on India - Market size and forecast 2025-2030 ($ billion)
Chart on India - Year-over-year growth 2025-2030 (%)
Data Table on India - Year-over-year growth 2025-2030 (%)

12.5.4 South Korea - Market size and forecast 2025-2030

Chart on South Korea - Market size and forecast 2025-2030 ($ billion)
Data Table on South Korea - Market size and forecast 2025-2030 ($ billion)
Chart on South Korea - Year-over-year growth 2025-2030 (%)
Data Table on South Korea - Year-over-year growth 2025-2030 (%)

12.5.5 Australia - Market size and forecast 2025-2030

Chart on Australia - Market size and forecast 2025-2030 ($ billion)
Data Table on Australia - Market size and forecast 2025-2030 ($ billion)
Chart on Australia - Year-over-year growth 2025-2030 (%)
Data Table on Australia - Year-over-year growth 2025-2030 (%)

12.5.6 Indonesia - Market size and forecast 2025-2030

Chart on Indonesia - Market size and forecast 2025-2030 ($ billion)
Data Table on Indonesia - Market size and forecast 2025-2030 ($ billion)
Chart on Indonesia - Year-over-year growth 2025-2030 (%)
Data Table on Indonesia - Year-over-year growth 2025-2030 (%)

12.6 Middle East and Africa - Market size and forecast 2025-2030

Chart on Middle East and Africa - Market size and forecast 2025-2030 ($ billion)
Data Table on Middle East and Africa - Market size and forecast 2025-2030 ($ billion)
Chart on Middle East and Africa - Year-over-year growth 2025-2030 (%)
Data Table on Middle East and Africa - Year-over-year growth 2025-2030 (%)
Chart on Regional Comparison - Middle East and Africa
Data Table on Regional Comparison - Middle East and Africa

12.6.1 Saudi Arabia - Market size and forecast 2025-2030

Chart on Saudi Arabia - Market size and forecast 2025-2030 ($ billion)
Data Table on Saudi Arabia - Market size and forecast 2025-2030 ($ billion)
Chart on Saudi Arabia - Year-over-year growth 2025-2030 (%)
Data Table on Saudi Arabia - Year-over-year growth 2025-2030 (%)

12.6.2 UAE - Market size and forecast 2025-2030

Chart on UAE - Market size and forecast 2025-2030 ($ billion)
Data Table on UAE - Market size and forecast 2025-2030 ($ billion)
Chart on UAE - Year-over-year growth 2025-2030 (%)
Data Table on UAE - Year-over-year growth 2025-2030 (%)

12.6.3 South Africa - Market size and forecast 2025-2030

Chart on South Africa - Market size and forecast 2025-2030 ($ billion)
Data Table on South Africa - Market size and forecast 2025-2030 ($ billion)
Chart on South Africa - Year-over-year growth 2025-2030 (%)
Data Table on South Africa - Year-over-year growth 2025-2030 (%)

12.6.4 Israel - Market size and forecast 2025-2030

Chart on Israel - Market size and forecast 2025-2030 ($ billion)
Data Table on Israel - Market size and forecast 2025-2030 ($ billion)
Chart on Israel - Year-over-year growth 2025-2030 (%)
Data Table on Israel - Year-over-year growth 2025-2030 (%)

12.6.5 Turkey - Market size and forecast 2025-2030

Chart on Turkey - Market size and forecast 2025-2030 ($ billion)
Data Table on Turkey - Market size and forecast 2025-2030 ($ billion)
Chart on Turkey - Year-over-year growth 2025-2030 (%)
Data Table on Turkey - Year-over-year growth 2025-2030 (%)

12.7 South America - Market size and forecast 2025-2030

Chart on South America - Market size and forecast 2025-2030 ($ billion)
Data Table on South America - Market size and forecast 2025-2030 ($ billion)
Chart on South America - Year-over-year growth 2025-2030 (%)
Data Table on South America - Year-over-year growth 2025-2030 (%)
Chart on Regional Comparison - South America
Data Table on Regional Comparison - South America

12.7.1 Brazil - Market size and forecast 2025-2030

Chart on Brazil - Market size and forecast 2025-2030 ($ billion)
Data Table on Brazil - Market size and forecast 2025-2030 ($ billion)
Chart on Brazil - Year-over-year growth 2025-2030 (%)
Data Table on Brazil - Year-over-year growth 2025-2030 (%)

12.7.2 Argentina - Market size and forecast 2025-2030

Chart on Argentina - Market size and forecast 2025-2030 ($ billion)
Data Table on Argentina - Market size and forecast 2025-2030 ($ billion)
Chart on Argentina - Year-over-year growth 2025-2030 (%)
Data Table on Argentina - Year-over-year growth 2025-2030 (%)

12.7.3 Chile - Market size and forecast 2025-2030

Chart on Chile - Market size and forecast 2025-2030 ($ billion)
Data Table on Chile - Market size and forecast 2025-2030 ($ billion)
Chart on Chile - Year-over-year growth 2025-2030 (%)
Data Table on Chile - Year-over-year growth 2025-2030 (%)

12.8 Market opportunity by geography

Market opportunity by geography ($ billion)
Data Tables on Market opportunity by geography ($ billion)

13. Drivers, Challenges, and Opportunity

13.1 Market drivers

Increasing complexity of regulatory compliance and legislative mandates
Acceleration of digital transformation and integration of artificial intelligence
Rising healthcare expenditures and strategic need for cost optimization

13.2 Market challenges

Data privacy vulnerabilities and escalating threat of sophisticated cyber attacks
Interoperability barriers and complexity of legacy system integration
Economic volatility and strain of rising operational and medical inflation

13.3 Impact of drivers and challenges

Impact of drivers and challenges in 2025 and 2030

13.4 Market opportunities

Proliferation of hyper-personalization and lifestyle-centric benefit menus
Emergence of holistic well-being and mental health parity as standard
Strategic pivot toward global benefit modernization and harmonization

14. Competitive Landscape

14.1 Overview

14.2

Overview on criticality of inputs and factors of differentiation

14.3 Landscape disruption

Overview on factors of disruption

14.4 Industry risks

Impact of key risks on business

15. Competitive Analysis

15.1 Companies profiled

Companies covered

15.2 Company ranking index

15.3 Market positioning of companies

Matrix on companies position and classification

15.4 Aon plc

Aon plc - Overview
Aon plc - Business segments
Aon plc - Key offerings
Aon plc - Segment focus
SWOT

15.5 Automatic Data Processing Inc.

Automatic Data Processing Inc. - Overview
Automatic Data Processing Inc. - Business segments
Automatic Data Processing Inc. - Key offerings
Automatic Data Processing Inc. - Segment focus
SWOT

15.6 Bamboo HR LLC

Bamboo HR LLC - Overview
Bamboo HR LLC - Product / Service
Bamboo HR LLC - Key offerings
SWOT

15.7 BAS Ltd

BAS Ltd - Overview
BAS Ltd - Product / Service
BAS Ltd - Key offerings
SWOT

15.8 Cognizant Technology Solution

Cognizant Technology Solution - Overview
Cognizant Technology Solution - Business segments
Cognizant Technology Solution - Key news
Cognizant Technology Solution - Key offerings
Cognizant Technology Solution - Segment focus
SWOT

15.9 Conduent Inc.

Conduent Inc. - Overview
Conduent Inc. - Business segments
Conduent Inc. - Key offerings
Conduent Inc. - Segment focus
SWOT

15.10 Insperity Inc.

Insperity Inc. - Overview
Insperity Inc. - Product / Service
Insperity Inc. - Key offerings
SWOT

15.11 Mercer LLC

Mercer LLC - Overview
Mercer LLC - Product / Service
Mercer LLC - Key offerings
SWOT

15.12 Oracle Corp.

Oracle Corp. - Overview
Oracle Corp. - Business segments
Oracle Corp. - Key news
Oracle Corp. - Key offerings
Oracle Corp. - Segment focus
SWOT

15.13 Paychex Inc.

Paychex Inc. - Overview
Paychex Inc. - Business segments
Paychex Inc. - Key offerings
Paychex Inc. - Segment focus
SWOT

15.14 Paycom Software Inc.

Paycom Software Inc. - Overview
Paycom Software Inc. - Product / Service
Paycom Software Inc. - Key offerings
SWOT

15.15 SAP SE

SAP SE - Overview
SAP SE - Business segments
SAP SE - Key news
SAP SE - Key offerings
SAP SE - Segment focus
SWOT

15.16 TriNet Group Inc.

TriNet Group Inc. - Overview
TriNet Group Inc. - Product / Service
TriNet Group Inc. - Key offerings
SWOT

15.17 WEX Inc.

WEX Inc. - Overview
WEX Inc. - Business segments
WEX Inc. - Key offerings
WEX Inc. - Segment focus
SWOT

15.18 Workday Inc.

Workday Inc. - Overview
Workday Inc. - Product / Service
Workday Inc. - Key news
Workday Inc. - Key offerings
SWOT

16. Appendix

16.1 Scope of the report

Market definition
Objectives
Notes and caveats

16.2 Inclusions and exclusions checklist

Inclusions checklist
Exclusions checklist

16.3 Currency conversion rates for US$

16.4 Research methodology

16.5 Data procurement

Information sources

16.6 Data validation

16.7 Validation techniques employed for market sizing

16.8 Data synthesis

16.9 360 degree market analysis

16.10 List of abbreviations

Research Methodology

Technavio presents a detailed picture of the market by way of study, synthesis, and summation of data from multiple sources. The analysts have presented the various facets of the market with a particular focus on identifying the key industry influencers. The data thus presented is comprehensive, reliable, and the result of extensive research, both primary and secondary.

INFORMATION SOURCES

Primary sources

  • Manufacturers and suppliers
  • Channel partners
  • Industry experts
  • Strategic decision makers

Secondary sources

  • Industry journals and periodicals
  • Government data
  • Financial reports of key industry players
  • Historical data
  • Press releases

DATA ANALYSIS

Data Synthesis

  • Collation of data
  • Estimation of key figures
  • Analysis of derived insights

Data Validation

  • Triangulation with data models
  • Reference against proprietary databases
  • Corroboration with industry experts

REPORT WRITING

Qualitative

  • Market drivers
  • Market challenges
  • Market trends
  • Five forces analysis

Quantitative

  • Market size and forecast
  • Market segmentation
  • Geographical insights
  • Competitive landscape

Interested in this report?

Get your sample now to see our research methodology and insights!

Download Now

Frequently Asked Questions

Benefits Administration Service market growth will increase by USD 151.4 billion during 2026-2030.

The Benefits Administration Service market is expected to grow at a CAGR of 3.1% during 2026-2030.

Benefits Administration Service market is segmented by Service type (Core benefits administration, Ancillary benefits administration, Integrated benefits administration) End-user (Employers, Insurance companies, Government agencies, Third-party administrators (TPAs), Brokers and consultants) Deployment (Cloud-based, On-premises)

Alight Inc., Aon plc, Automatic Data Processing Inc., Bamboo HR LLC, BAS Ltd, Cognizant Technology Solution, Conduent Inc., Dayforce Inc., Deel Inc., Fidelity Investments, Insperity Inc., Justworks Inc., Mercer LLC, Oracle Corp., Paychex Inc., Paycom Software Inc., SAP SE, TriNet Group Inc., WEX Inc., Workday Inc. are a few of the key vendors in the Benefits Administration Service market.

North America will register the highest growth rate of 31.7% among the other regions. Therefore, the Benefits Administration Service market in North America is expected to garner significant business opportunities for the vendors during the forecast period.

US, Canada, Mexico, Germany, UK, France, Italy, Spain, The Netherlands, China, Japan, India, South Korea, Australia, Indonesia, Saudi Arabia, UAE, South Africa, Israel, Turkey, Brazil, Argentina, Chile

  • Increasing complexity of regulatory compliance and legislative mandates is the driving factor this market.

The Benefits Administration Service market vendors should focus on grabbing business opportunities from the Service type segment as it accounted for the largest market share in the base year.
RIA - Research AI Assistant
Ask RIA