Battery For Energy Storage Systems (ESS) Market Analysis, Size, and Forecast 2026-2030: APAC (China, India, and Japan), North America (US, Canada, and Mexico), Europe (Germany, UK, and Italy), Middle East and Africa (Saudi Arabia, UAE, and South Africa), South America (Brazil and Argentina), and Rest of World (ROW)

Battery For Energy Storage Systems (ESS) Market Analysis, Size, and Forecast 2026-2030:
APAC (China, India, and Japan), North America (US, Canada, and Mexico), Europe (Germany, UK, and Italy), Middle East and Africa (Saudi Arabia, UAE, and South Africa), South America (Brazil and Argentina), and Rest of World (ROW)

Published: May 2026 296 Pages SKU: IRTNTR72995

Market Overview at a Glance

$28.15 B
Market Opportunity
24.8%
CAGR 2025 - 2030
52.7%
APAC Growth
$10.57 B
Lithium-ion batteries segment 2024

Battery For Energy Storage Systems (ESS) Market Size 2026-2030

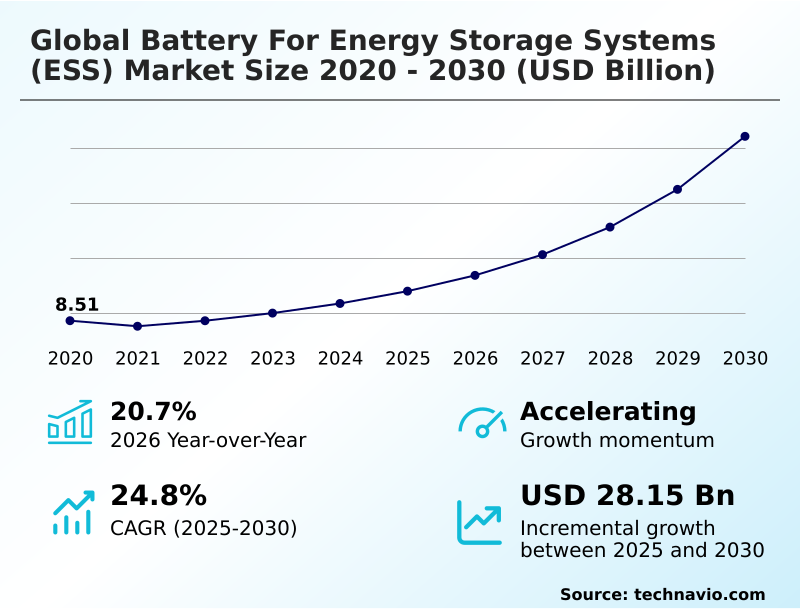
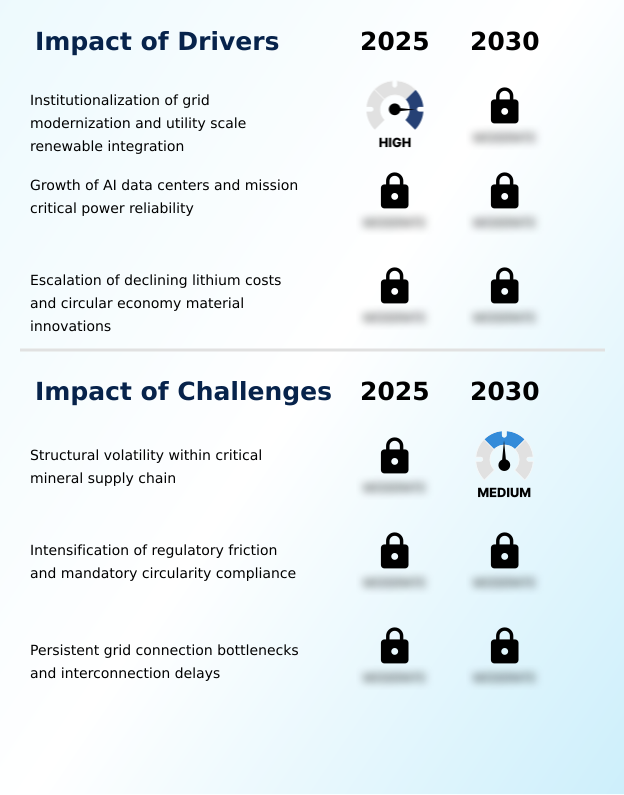
The battery for energy storage systems (ess) market size is valued to increase by USD 28.15 billion, at a CAGR of 24.8% from 2025 to 2030. Institutionalization of grid modernization and utility scale renewable integration will drive the battery for energy storage systems (ess) market.

Major Market Trends & Insights

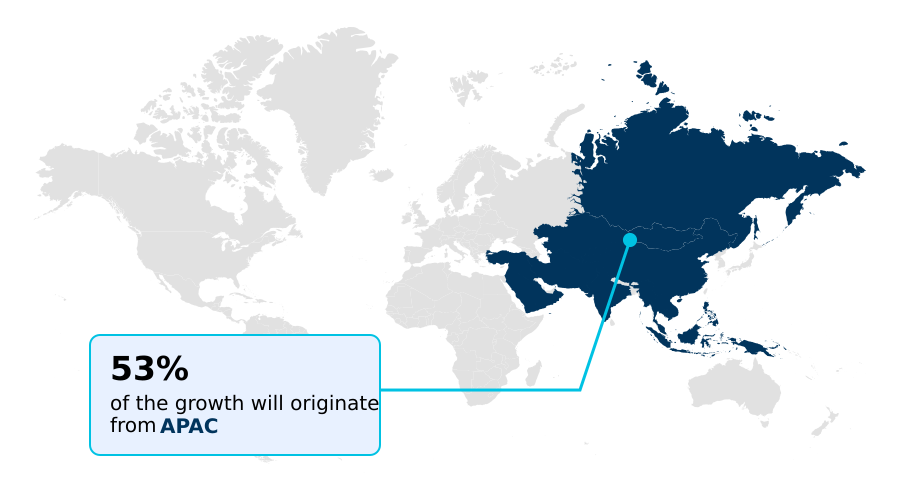
  • APAC dominated the market and accounted for a 52.7% growth during the forecast period.
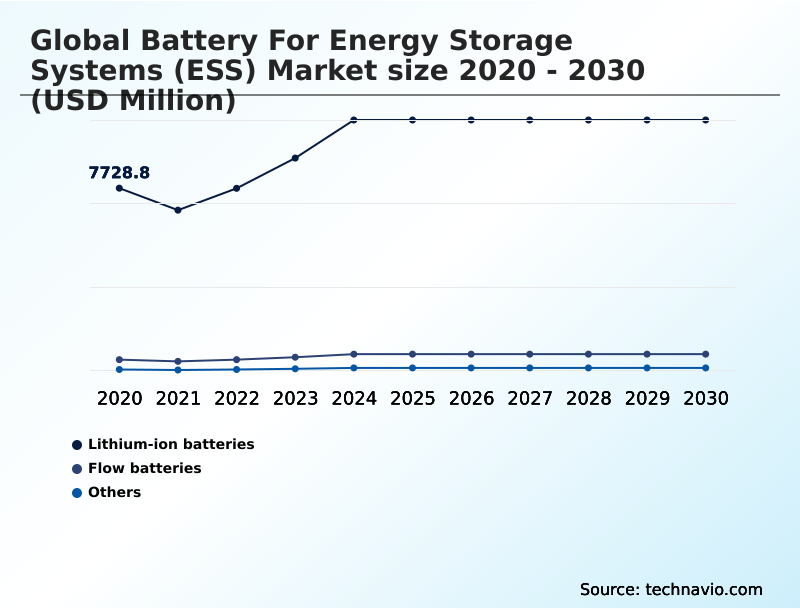
  • By Technology - Lithium-ion batteries segment was valued at USD 10.57 billion in 2024
  • By Connectivity - On-grid segment accounted for the largest market revenue share in 2024

Market Size & Forecast

  • Market Opportunities: USD 33.52 billion
  • Market Future Opportunities: USD 28.15 billion
  • CAGR from 2025 to 2030 : 24.8%

Market Summary

  • The Battery For Energy Storage Systems (ESS) Market is defined by a rapid technological evolution driven by global decarbonization mandates and the need for enhanced grid resilience. Key trends include the shift toward safer, more durable chemistries like lithium iron phosphate and the development of long-duration energy storage solutions, such as vanadium redox flow battery systems, to support intermittent renewables.
  • A primary driver is the institutionalization of grid modernization, compelling utilities to adopt battery systems for frequency regulation and peak shaving. However, the industry faces significant hurdles from a volatile critical mineral supply chain and persistent grid interconnection bottlenecks, which can delay projects and inflate costs.
  • For instance, a utility provider deploying a large-scale solar project must integrate a BESS with advanced battery management systems to ensure grid frequency is maintained, thereby avoiding both costly transmission upgrades and penalties for grid destabilization.
  • The advancement of AI-driven battery optimization and zero-capex energy storage models are creating new opportunities for commercial and industrial users, further expanding market applications beyond traditional utility-scale installations and enhancing mission-critical power reliability.

What will be the Size of the Battery For Energy Storage Systems (ESS) Market during the forecast period?

Get Key Insights on Market Forecast (PDF) Get Free Sample

How is the Battery For Energy Storage Systems (ESS) Market Segmented?

The battery for energy storage systems (ess) industry research report provides comprehensive data (region-wise segment analysis), with forecasts and estimates in "USD million" for the period 2026-2030, as well as historical data from 2020-2024 for the following segments.

  • Technology
    • Lithium-ion batteries
    • Flow batteries
    • Others
  • Connectivity
    • On-grid
    • Off-grid
  • Ownership
    • Utility owned
    • Third-party owned
    • Customer owned
  • Geography
    • APAC
      • China
      • India
      • Japan
    • North America
      • US
      • Canada
      • Mexico
    • Europe
      • Germany
      • UK
      • Italy
    • Middle East and Africa
      • Saudi Arabia
      • UAE
      • South Africa
    • South America
      • Brazil
      • Argentina
    • Rest of World (ROW)

By Technology Insights

The lithium-ion batteries segment is estimated to witness significant growth during the forecast period.

Lithium-ion batteries, predominantly using lithium iron phosphate chemistry, continue to command the market due to their high energy density and mature manufacturing ecosystems. These electrochemical storage solutions are central to both utility-scale installations and behind-the-meter storage applications.

The technology’s value is enhanced by advanced battery management systems that optimize performance for services like frequency regulation and peak shaving, improving cycle life by up to 40% under ideal conditions.

The emphasis on grid modernization and demand-side flexibility is driving further innovation in modular storage designs.

While facing competition from emerging technologies, the established supply chain for lithium-ion and its integration with grid-forming inverters solidifies its current market position, especially as commercial and industrial users adopt these systems.

Get Free Sample

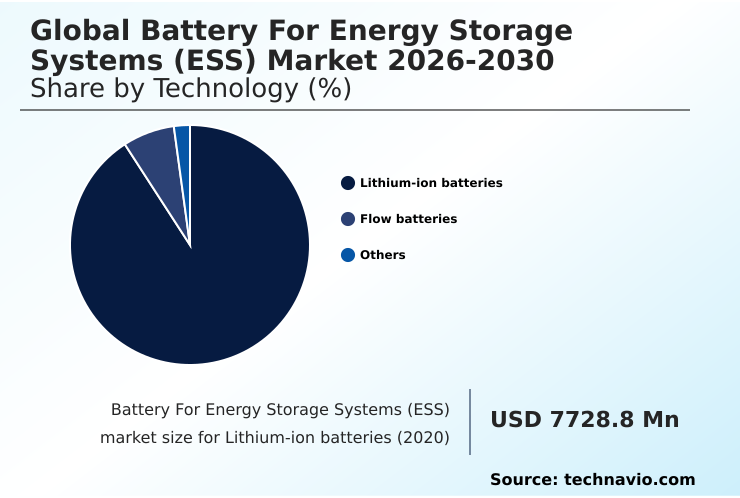
The Lithium-ion batteries segment was valued at USD 10.57 billion in 2024 and showed a gradual increase during the forecast period.

Get Free Sample

Regional Analysis

APAC is estimated to contribute 52.7% to the growth of the global market during the forecast period.Technavio’s analysts have elaborately explained the regional trends and drivers that shape the market during the forecast period.

See How Battery For Energy Storage Systems (ESS) Market Demand is Rising in APAC Get Free Sample

The market's geographic landscape is characterized by distinct regional drivers and growth trajectories. APAC is poised to contribute over 52% of the market's incremental growth, fueled by massive domestic manufacturing incentives and national decarbonization targets.

In this region, stand-alone configurations for microgrids are as critical as grid-tied storage for industrial hubs.

North America demonstrates a robust expansion, with its market projected to grow at a rate exceeding 25% annually, driven by investments in high-density data centers and grid modernization.

Europe prioritizes regulatory frameworks like carbon footprint labeling, promoting circular economy innovations and the use of non-flammable electrolytes.

The focus on energy sovereignty and vehicle-to-grid protocols is accelerating the deployment of advanced battery technologies across all major economic zones, addressing everything from energy-intensive desalination in the Middle East to transmission network constraints in mature grids.

Market Dynamics

Our researchers analyzed the data with 2025 as the base year, along with the key drivers, trends, and challenges. A holistic analysis of drivers will help companies refine their marketing strategies to gain a competitive advantage.

  • Strategic decision-making in the battery for energy storage systems market requires a granular understanding of diverse operational scenarios. For instance, evaluating the cost comparison of lithium-ion vs flow batteries is crucial; while the former is prevalent, the latter offers advantages for long-duration storage in grid stability applications.
  • As enterprises deploy battery energy storage for AI data centers, they must consider not just cost but also the protocols for managing thermal runaway in containerized battery systems. The role of long-duration storage in grid stability is a frequent topic, especially when planning to integrate BESS with intermittent renewable sources.
  • Meanwhile, regulatory compliance for battery recycling programs and navigating grid interconnection queue delays are significant operational hurdles. Businesses are exploring behind-the-meter storage for commercial peak shaving and leveraging second-life EV batteries for stationary storage to improve ROI. Understanding the impact of the mineral supply chain on BESS costs and exploring financing models for zero-capex energy storage are vital.
  • Furthermore, optimizing ROI with AI-driven energy arbitrage and addressing vehicle-to-grid integration challenges and opportunities define the competitive frontier. Advanced diagnostics for predicting battery degradation are becoming standard, with systems in remote mining operations showing 20% better predictive accuracy than previous-generation models.

What are the key market drivers leading to the rise in the adoption of Battery For Energy Storage Systems (ESS) Industry?

  • The institutionalization of grid modernization and the mandated integration of utility-scale renewables are key drivers propelling market expansion.

  • Grid modernization and the institutionalization of renewable energy mandates are the primary drivers propelling the market. Governments are investing heavily in decentralized smart grid infrastructure, making battery storage essential for managing grid frequency and providing voltage support.
  • Utility-scale renewable integration has driven demand for large-scale BESS by over 200% in leading regions. The explosive growth of high-density data centers has created a new, high-value segment demanding uninterrupted power, which only on-site BESS can guarantee.
  • Furthermore, the persistent decline in battery costs, particularly for lithium iron phosphate, has made BESS 25% more economically competitive than traditional gas peaker plants for peak shaving and load shifting.
  • This economic viability, coupled with strong policy support, ensures a robust growth trajectory for both front-of-the-meter assets and distributed energy resources.

What are the market trends shaping the Battery For Energy Storage Systems (ESS) Industry?

  • The industrialization of AI-driven battery optimization is an emerging market trend. This involves leveraging advanced algorithms to enhance performance, predict degradation, and extend operational lifecycles.

  • A primary trend is the rapid industrialization of AI-driven battery optimization, which leverages sophisticated algorithms for predictive maintenance and enhanced performance. This move toward intelligent systems is enabling more effective wholesale market participation and firm power capacity. For example, AI-driven platforms can increase energy arbitrage revenue by over 20% by predicting price fluctuations with greater accuracy.
  • Concurrently, the evolution toward a diversified chemistry portfolio is accelerating, with solid-state electrolytes and sodium-ion battery chemistries gaining traction. This shift addresses the critical mineral supply chain vulnerabilities associated with nickel manganese cobalt, with new materials offering improved thermal regulation and longer cycle life.
  • These advancements are crucial for the expansion of long-duration energy storage and mission-critical power reliability, pushing the boundaries of what electrochemical storage solutions can achieve.

What challenges does the Battery For Energy Storage Systems (ESS) Industry face during its growth?

  • Structural volatility within the critical mineral supply chain represents a significant challenge impacting industry growth and project economics.

  • The market's growth is tempered by significant structural challenges, primarily the persistent grid connection bottlenecks and regulatory friction. In many developed markets, interconnection queues can delay project commissioning by an average of 36 months, rendering initial financial models obsolete.
  • This is compounded by the structural volatility within critical mineral supply chains, where price spikes for materials like lithium and cobalt have inflated project capital expenditures by over 50% in a single year. Furthermore, the intensification of mandatory circularity and battery recycling compliance, such as the digital product passport in Europe, introduces significant administrative and logistical overhead.
  • These challenges create a high-risk environment, particularly for developers of utility-scale installations who must navigate a complex web of technical standards, offtake agreements, and financial uncertainties.

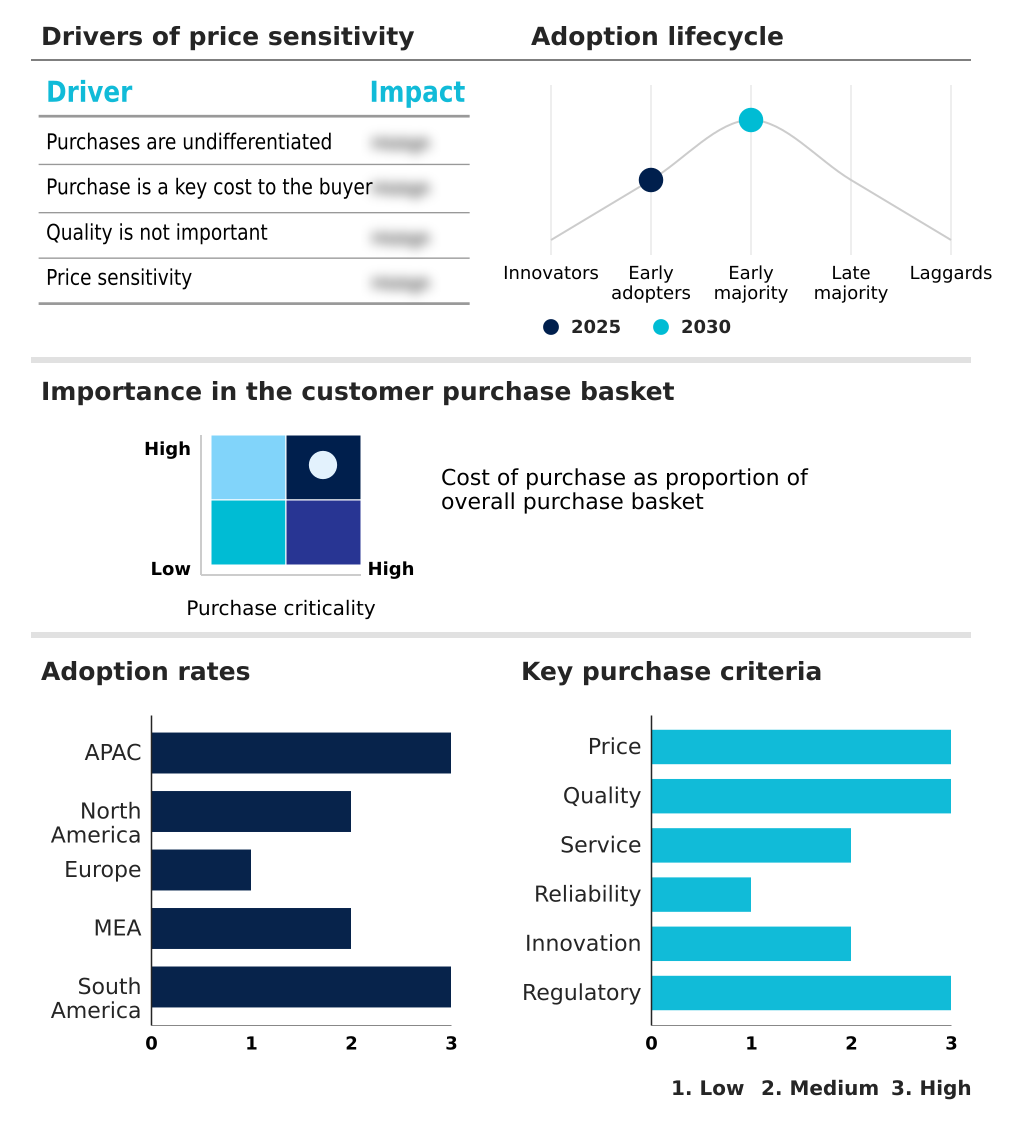
Exclusive Technavio Analysis on Customer Landscape

The battery for energy storage systems (ess) market forecasting report includes the adoption lifecycle of the market, covering from the innovator’s stage to the laggard’s stage. It focuses on adoption rates in different regions based on penetration. Furthermore, the battery for energy storage systems (ess) market report also includes key purchase criteria and drivers of price sensitivity to help companies evaluate and develop their market growth analysis strategies.

Customer Landscape of Battery For Energy Storage Systems (ESS) Industry

Competitive Landscape

Companies are implementing various strategies, such as strategic alliances, battery for energy storage systems (ess) market forecast, partnerships, mergers and acquisitions, geographical expansion, and product/service launches, to enhance their presence in the industry.

BYD Co. Ltd. - Offers grid-scale and distributed lithium iron phosphate-based storage solutions engineered for seamless renewable energy integration and enhanced grid stability.

The industry research and growth report includes detailed analyses of the competitive landscape of the market and information about key companies, including:

  • BYD Co. Ltd.
  • Contemporary Amperex Ltd.
  • EnerSys
  • EOS Energy Enterprises Inc.
  • ESS Tech Inc.
  • EVE Energy Co. Ltd.
  • Fluence Energy LLC
  • Invinity Energy Systems plc
  • LG Energy Solution Ltd.
  • Northvolt AB
  • Panasonic Holdings Corp.
  • Powin Inc.
  • Saft Groupe SAS
  • Samsung SDI Co. Ltd.
  • Sonnen GmbH
  • Sungrow Power Supply Co. Ltd.
  • Tesla Inc.
  • VARTA AG
  • Xiamen Hithium Energy Co. Ltd.
  • Zhejiang Narada Power Source Co

Qualitative and quantitative analysis of companies has been conducted to help clients understand the wider business environment as well as the strengths and weaknesses of key industry players. Data is qualitatively analyzed to categorize companies as pure play, category-focused, industry-focused, and diversified; it is quantitatively analyzed to categorize companies as dominant, leading, strong, tentative, and weak.

Recent Development and News in Battery for energy storage systems (ess) market

  • In May, 2025, ABB officially launched its Battery Energy Storage Systems-as-a-Service, a zero-CapEx solution to accelerate clean energy adoption for industrial users.
  • In April, 2025, Invinity Energy Systems received formal approval to install a 20.7-megawatt-hour vanadium redox flow battery system in the United Kingdom, the nation's largest of its kind.
  • In January, 2025, Northvolt AB announced a strategic partnership with a major European automotive manufacturer to develop and scale vehicle-to-grid (V2G) technology, creating a 50 GWh virtual power plant pilot.
  • In October, 2024, Fluence Energy LLC secured $500 million in a new funding round to expand its domestic manufacturing capacity for its latest generation of modular, grid-forming energy storage systems in the US.

Dive into Technavio’s robust research methodology, blending expert interviews, extensive data synthesis, and validated models for unparalleled Battery For Energy Storage Systems (ESS) Market insights. See full methodology.

Market Scope
Page number 296
Base year 2025
Historic period 2020-2024
Forecast period 2026-2030
Growth momentum & CAGR Accelerate at a CAGR of 24.8%
Market growth 2026-2030 USD 28152.4 million
Market structure Fragmented
YoY growth 2025-2026(%) 20.7%
Key countries China, India, Japan, Australia, South Korea, Indonesia, US, Canada, Mexico, Germany, UK, Italy, France, Spain, The Netherlands, Saudi Arabia, UAE, South Africa, Israel, Turkey, Brazil, Chile and Argentina
Competitive landscape Leading Companies, Market Positioning of Companies, Competitive Strategies, and Industry Risks

Request Free Sample

Research Analyst Overview

  • The market is advancing beyond simple hardware deployment toward integrated, software-defined energy assets. The adoption of advanced battery management systems and grid-forming inverters is now standard for utility-scale installations, ensuring ancillary services like frequency regulation and voltage support are reliably delivered.
  • Chemistries are diversifying, with lithium iron phosphate for grid-tied storage, vanadium redox flow battery systems for long-duration needs, and emerging sodium-ion battery chemistries and zinc-based energy storage solutions targeting specific applications. In the boardroom, the focus has shifted to lifecycle value, where second-life utilization, the digital product passport, and circular economy principles directly impact ESG compliance and long-term asset valuation.
  • For instance, firms deploying advanced state of charge monitoring report a 15% reduction in unscheduled maintenance. As distributed energy resources become more common, mastering grid interconnection protocols and power purchase agreements for behind-the-meter storage and stand-alone configurations is critical for maintaining a competitive edge and ensuring high round-trip efficiency.

What are the Key Data Covered in this Battery For Energy Storage Systems (ESS) Market Research and Growth Report?

  • What is the expected growth of the Battery For Energy Storage Systems (ESS) Market between 2026 and 2030?

    • USD 28.15 billion, at a CAGR of 24.8%

  • What segmentation does the market report cover?

    • The report is segmented by Technology (Lithium-ion batteries, Flow batteries, and Others), Connectivity (On-grid, and Off-grid), Ownership (Utility owned, Third-party owned, and Customer owned) and Geography (APAC, North America, Europe, Middle East and Africa, South America)

  • Which regions are analyzed in the report?

    • APAC, North America, Europe, Middle East and Africa and South America

  • What are the key growth drivers and market challenges?

    • Institutionalization of grid modernization and utility scale renewable integration, Structural volatility within critical mineral supply chain

  • Who are the major players in the Battery For Energy Storage Systems (ESS) Market?

    • BYD Co. Ltd., Contemporary Amperex Ltd., EnerSys, EOS Energy Enterprises Inc., ESS Tech Inc., EVE Energy Co. Ltd., Fluence Energy LLC, Invinity Energy Systems plc, LG Energy Solution Ltd., Northvolt AB, Panasonic Holdings Corp., Powin Inc., Saft Groupe SAS, Samsung SDI Co. Ltd., Sonnen GmbH, Sungrow Power Supply Co. Ltd., Tesla Inc., VARTA AG, Xiamen Hithium Energy Co. Ltd. and Zhejiang Narada Power Source Co

Market Research Insights

  • The market's momentum is shaped by a confluence of financial innovation and technical necessity. The adoption of zero-capex energy storage models allows commercial and industrial users to gain mission-critical power reliability without significant initial investment, improving access to demand-side flexibility.
  • This is critical as grid modernization initiatives advance, requiring automated grid management and wholesale market participation to manage transmission network constraints. AI-driven battery optimization is proven to enhance renewable energy load balancing and supports the formation of virtual power plants, achieving up to a 95% reduction in systemic grid failures in some deployments.
  • Efforts to mitigate the volatile critical mineral supply chain through sustainable material sourcing, end-of-life battery recycling, and domestic manufacturing incentives are central to achieving national decarbonization targets and energy sovereignty. These strategies improve firm power capacity and enable a more resilient decentralized smart grid.

We can help! Our analysts can customize this battery for energy storage systems (ess) market research report to meet your requirements.

Get in touch

1. Executive Summary

1.1 Market overview

Executive Summary - Chart on Market Overview
Executive Summary - Data Table on Market Overview
Executive Summary - Chart on Global Market Characteristics
Executive Summary - Chart on Market by Geography
Executive Summary - Chart on Market Segmentation by Technology
Executive Summary - Chart on Market Segmentation by Connectivity
Executive Summary - Chart on Market Segmentation by Ownership
Executive Summary - Chart on Incremental Growth
Executive Summary - Data Table on Incremental Growth
Executive Summary - Chart on Company Market Positioning

2. Technavio Analysis

2.1 Analysis of price sensitivity, lifecycle, customer purchase basket, adoption rates, and purchase criteria

2.2 Criticality of inputs and Factors of differentiation

Chart on Overview on criticality of inputs and factors of differentiation

2.3 Factors of disruption

Chart on Overview on factors of disruption

2.4 Impact of drivers and challenges

Chart on Impact of drivers and challenges in 2025 and 2030

3. Market Landscape

3.1 Market ecosystem

Chart on Parent Market
Data Table on - Parent Market

3.2 Market characteristics

Chart on Market characteristics analysis

3.3 Value chain analysis

Chart on Value chain analysis

4. Market Sizing

4.1 Market definition

Data Table on Offerings of companies included in the market definition

4.2 Market segment analysis

Market segments

4.3 Market size 2025

4.4 Market outlook: Forecast for 2025-2030

Chart on Global - Market size and forecast 2025-2030 ($ million)
Data Table on Global - Market size and forecast 2025-2030 ($ million)
Chart on Global Market: Year-over-year growth 2025-2030 (%)
Data Table on Global Market: Year-over-year growth 2025-2030 (%)

5. Historic Market Size

5.1 Global Battery For Energy Storage Systems (ESS) Market 2020 - 2024

Historic Market Size - Data Table on Global Battery For Energy Storage Systems (ESS) Market 2020 - 2024 ($ million)

5.2 Technology segment analysis 2020 - 2024

Historic Market Size - Technology Segment 2020 - 2024 ($ million)

5.3 Connectivity segment analysis 2020 - 2024

Historic Market Size - Connectivity Segment 2020 - 2024 ($ million)

5.4 Ownership segment analysis 2020 - 2024

Historic Market Size - Ownership Segment 2020 - 2024 ($ million)

5.5 Geography segment analysis 2020 - 2024

Historic Market Size - Geography Segment 2020 - 2024 ($ million)

5.6 Country segment analysis 2020 - 2024

Historic Market Size - Country Segment 2020 - 2024 ($ million)

6. Qualitative Analysis

6.1 Impact of AI in global battery for energy storage systems (ESS) market

6.2 Impact of geopolitical conflict on global battery for energy storage systems (ESS) market

7. Five Forces Analysis

7.1 Five forces summary

Five forces analysis - Comparison between 2025 and 2030

7.2 Bargaining power of buyers

Bargaining power of buyers - Impact of key factors 2025 and 2030

7.3 Bargaining power of suppliers

Bargaining power of suppliers - Impact of key factors in 2025 and 2030

7.4 Threat of new entrants

Threat of new entrants - Impact of key factors in 2025 and 2030

7.5 Threat of substitutes

Threat of substitutes - Impact of key factors in 2025 and 2030

7.6 Threat of rivalry

Threat of rivalry - Impact of key factors in 2025 and 2030

7.7 Market condition

Chart on Market condition - Five forces 2025 and 2030

8. Market Segmentation by Technology

8.1 Market segments

Chart on Technology - Market share 2025-2030 (%)
Data Table on Technology - Market share 2025-2030 (%)

8.2 Comparison by Technology

Chart on Comparison by Technology
Data Table on Comparison by Technology

8.3 Lithium-ion batteries - Market size and forecast 2025-2030

Chart on Lithium-ion batteries - Market size and forecast 2025-2030 ($ million)
Data Table on Lithium-ion batteries - Market size and forecast 2025-2030 ($ million)
Chart on Lithium-ion batteries - Year-over-year growth 2025-2030 (%)
Data Table on Lithium-ion batteries - Year-over-year growth 2025-2030 (%)

8.4 Flow batteries - Market size and forecast 2025-2030

Chart on Flow batteries - Market size and forecast 2025-2030 ($ million)
Data Table on Flow batteries - Market size and forecast 2025-2030 ($ million)
Chart on Flow batteries - Year-over-year growth 2025-2030 (%)
Data Table on Flow batteries - Year-over-year growth 2025-2030 (%)

8.5 Others - Market size and forecast 2025-2030

Chart on Others - Market size and forecast 2025-2030 ($ million)
Data Table on Others - Market size and forecast 2025-2030 ($ million)
Chart on Others - Year-over-year growth 2025-2030 (%)
Data Table on Others - Year-over-year growth 2025-2030 (%)

8.6 Market opportunity by Technology

Market opportunity by Technology ($ million)
Data Table on Market opportunity by Technology ($ million)

9. Market Segmentation by Connectivity

9.1 Market segments

Chart on Connectivity - Market share 2025-2030 (%)
Data Table on Connectivity - Market share 2025-2030 (%)

9.2 Comparison by Connectivity

Chart on Comparison by Connectivity
Data Table on Comparison by Connectivity

9.3 On-grid - Market size and forecast 2025-2030

Chart on On-grid - Market size and forecast 2025-2030 ($ million)
Data Table on On-grid - Market size and forecast 2025-2030 ($ million)
Chart on On-grid - Year-over-year growth 2025-2030 (%)
Data Table on On-grid - Year-over-year growth 2025-2030 (%)

9.4 Off-grid - Market size and forecast 2025-2030

Chart on Off-grid - Market size and forecast 2025-2030 ($ million)
Data Table on Off-grid - Market size and forecast 2025-2030 ($ million)
Chart on Off-grid - Year-over-year growth 2025-2030 (%)
Data Table on Off-grid - Year-over-year growth 2025-2030 (%)

9.5 Market opportunity by Connectivity

Market opportunity by Connectivity ($ million)
Data Table on Market opportunity by Connectivity ($ million)

10. Market Segmentation by Ownership

10.1 Market segments

Chart on Ownership - Market share 2025-2030 (%)
Data Table on Ownership - Market share 2025-2030 (%)

10.2 Comparison by Ownership

Chart on Comparison by Ownership
Data Table on Comparison by Ownership

10.3 Utility owned - Market size and forecast 2025-2030

Chart on Utility owned - Market size and forecast 2025-2030 ($ million)
Data Table on Utility owned - Market size and forecast 2025-2030 ($ million)
Chart on Utility owned - Year-over-year growth 2025-2030 (%)
Data Table on Utility owned - Year-over-year growth 2025-2030 (%)

10.4 Third-party owned - Market size and forecast 2025-2030

Chart on Third-party owned - Market size and forecast 2025-2030 ($ million)
Data Table on Third-party owned - Market size and forecast 2025-2030 ($ million)
Chart on Third-party owned - Year-over-year growth 2025-2030 (%)
Data Table on Third-party owned - Year-over-year growth 2025-2030 (%)

10.5 Customer owned - Market size and forecast 2025-2030

Chart on Customer owned - Market size and forecast 2025-2030 ($ million)
Data Table on Customer owned - Market size and forecast 2025-2030 ($ million)
Chart on Customer owned - Year-over-year growth 2025-2030 (%)
Data Table on Customer owned - Year-over-year growth 2025-2030 (%)

10.6 Market opportunity by Ownership

Market opportunity by Ownership ($ million)
Data Table on Market opportunity by Ownership ($ million)

11. Customer Landscape

11.1 Customer landscape overview

Analysis of price sensitivity, lifecycle, customer purchase basket, adoption rates, and purchase criteria

12. Geographic Landscape

12.1 Geographic segmentation

Chart on Market share by geography 2025-2030 (%)
Data Table on Market share by geography 2025-2030 (%)

12.2 Geographic comparison

Chart on Geographic comparison
Data Table on Geographic comparison

12.3 APAC - Market size and forecast 2025-2030

Chart on APAC - Market size and forecast 2025-2030 ($ million)
Data Table on APAC - Market size and forecast 2025-2030 ($ million)
Chart on APAC - Year-over-year growth 2025-2030 (%)
Data Table on APAC - Year-over-year growth 2025-2030 (%)
Chart on Regional Comparison - APAC
Data Table on Regional Comparison - APAC

12.3.1 China - Market size and forecast 2025-2030

Chart on China - Market size and forecast 2025-2030 ($ million)
Data Table on China - Market size and forecast 2025-2030 ($ million)
Chart on China - Year-over-year growth 2025-2030 (%)
Data Table on China - Year-over-year growth 2025-2030 (%)

12.3.2 India - Market size and forecast 2025-2030

Chart on India - Market size and forecast 2025-2030 ($ million)
Data Table on India - Market size and forecast 2025-2030 ($ million)
Chart on India - Year-over-year growth 2025-2030 (%)
Data Table on India - Year-over-year growth 2025-2030 (%)

12.3.3 Japan - Market size and forecast 2025-2030

Chart on Japan - Market size and forecast 2025-2030 ($ million)
Data Table on Japan - Market size and forecast 2025-2030 ($ million)
Chart on Japan - Year-over-year growth 2025-2030 (%)
Data Table on Japan - Year-over-year growth 2025-2030 (%)

12.3.4 Australia - Market size and forecast 2025-2030

Chart on Australia - Market size and forecast 2025-2030 ($ million)
Data Table on Australia - Market size and forecast 2025-2030 ($ million)
Chart on Australia - Year-over-year growth 2025-2030 (%)
Data Table on Australia - Year-over-year growth 2025-2030 (%)

12.3.5 South Korea - Market size and forecast 2025-2030

Chart on South Korea - Market size and forecast 2025-2030 ($ million)
Data Table on South Korea - Market size and forecast 2025-2030 ($ million)
Chart on South Korea - Year-over-year growth 2025-2030 (%)
Data Table on South Korea - Year-over-year growth 2025-2030 (%)

12.3.6 Indonesia - Market size and forecast 2025-2030

Chart on Indonesia - Market size and forecast 2025-2030 ($ million)
Data Table on Indonesia - Market size and forecast 2025-2030 ($ million)
Chart on Indonesia - Year-over-year growth 2025-2030 (%)
Data Table on Indonesia - Year-over-year growth 2025-2030 (%)

12.4 North America - Market size and forecast 2025-2030

Chart on North America - Market size and forecast 2025-2030 ($ million)
Data Table on North America - Market size and forecast 2025-2030 ($ million)
Chart on North America - Year-over-year growth 2025-2030 (%)
Data Table on North America - Year-over-year growth 2025-2030 (%)
Chart on Regional Comparison - North America
Data Table on Regional Comparison - North America

12.4.1 US - Market size and forecast 2025-2030

Chart on US - Market size and forecast 2025-2030 ($ million)
Data Table on US - Market size and forecast 2025-2030 ($ million)
Chart on US - Year-over-year growth 2025-2030 (%)
Data Table on US - Year-over-year growth 2025-2030 (%)

12.4.2 Canada - Market size and forecast 2025-2030

Chart on Canada - Market size and forecast 2025-2030 ($ million)
Data Table on Canada - Market size and forecast 2025-2030 ($ million)
Chart on Canada - Year-over-year growth 2025-2030 (%)
Data Table on Canada - Year-over-year growth 2025-2030 (%)

12.4.3 Mexico - Market size and forecast 2025-2030

Chart on Mexico - Market size and forecast 2025-2030 ($ million)
Data Table on Mexico - Market size and forecast 2025-2030 ($ million)
Chart on Mexico - Year-over-year growth 2025-2030 (%)
Data Table on Mexico - Year-over-year growth 2025-2030 (%)

12.5 Europe - Market size and forecast 2025-2030

Chart on Europe - Market size and forecast 2025-2030 ($ million)
Data Table on Europe - Market size and forecast 2025-2030 ($ million)
Chart on Europe - Year-over-year growth 2025-2030 (%)
Data Table on Europe - Year-over-year growth 2025-2030 (%)
Chart on Regional Comparison - Europe
Data Table on Regional Comparison - Europe

12.5.1 Germany - Market size and forecast 2025-2030

Chart on Germany - Market size and forecast 2025-2030 ($ million)
Data Table on Germany - Market size and forecast 2025-2030 ($ million)
Chart on Germany - Year-over-year growth 2025-2030 (%)
Data Table on Germany - Year-over-year growth 2025-2030 (%)

12.5.2 UK - Market size and forecast 2025-2030

Chart on UK - Market size and forecast 2025-2030 ($ million)
Data Table on UK - Market size and forecast 2025-2030 ($ million)
Chart on UK - Year-over-year growth 2025-2030 (%)
Data Table on UK - Year-over-year growth 2025-2030 (%)

12.5.3 Italy - Market size and forecast 2025-2030

Chart on Italy - Market size and forecast 2025-2030 ($ million)
Data Table on Italy - Market size and forecast 2025-2030 ($ million)
Chart on Italy - Year-over-year growth 2025-2030 (%)
Data Table on Italy - Year-over-year growth 2025-2030 (%)

12.5.4 France - Market size and forecast 2025-2030

Chart on France - Market size and forecast 2025-2030 ($ million)
Data Table on France - Market size and forecast 2025-2030 ($ million)
Chart on France - Year-over-year growth 2025-2030 (%)
Data Table on France - Year-over-year growth 2025-2030 (%)

12.5.5 Spain - Market size and forecast 2025-2030

Chart on Spain - Market size and forecast 2025-2030 ($ million)
Data Table on Spain - Market size and forecast 2025-2030 ($ million)
Chart on Spain - Year-over-year growth 2025-2030 (%)
Data Table on Spain - Year-over-year growth 2025-2030 (%)

12.5.6 The Netherlands - Market size and forecast 2025-2030

Chart on The Netherlands - Market size and forecast 2025-2030 ($ million)
Data Table on The Netherlands - Market size and forecast 2025-2030 ($ million)
Chart on The Netherlands - Year-over-year growth 2025-2030 (%)
Data Table on The Netherlands - Year-over-year growth 2025-2030 (%)

12.6 Middle East and Africa - Market size and forecast 2025-2030

Chart on Middle East and Africa - Market size and forecast 2025-2030 ($ million)
Data Table on Middle East and Africa - Market size and forecast 2025-2030 ($ million)
Chart on Middle East and Africa - Year-over-year growth 2025-2030 (%)
Data Table on Middle East and Africa - Year-over-year growth 2025-2030 (%)
Chart on Regional Comparison - Middle East and Africa
Data Table on Regional Comparison - Middle East and Africa

12.6.1 Saudi Arabia - Market size and forecast 2025-2030

Chart on Saudi Arabia - Market size and forecast 2025-2030 ($ million)
Data Table on Saudi Arabia - Market size and forecast 2025-2030 ($ million)
Chart on Saudi Arabia - Year-over-year growth 2025-2030 (%)
Data Table on Saudi Arabia - Year-over-year growth 2025-2030 (%)

12.6.2 UAE - Market size and forecast 2025-2030

Chart on UAE - Market size and forecast 2025-2030 ($ million)
Data Table on UAE - Market size and forecast 2025-2030 ($ million)
Chart on UAE - Year-over-year growth 2025-2030 (%)
Data Table on UAE - Year-over-year growth 2025-2030 (%)

12.6.3 South Africa - Market size and forecast 2025-2030

Chart on South Africa - Market size and forecast 2025-2030 ($ million)
Data Table on South Africa - Market size and forecast 2025-2030 ($ million)
Chart on South Africa - Year-over-year growth 2025-2030 (%)
Data Table on South Africa - Year-over-year growth 2025-2030 (%)

12.6.4 Israel - Market size and forecast 2025-2030

Chart on Israel - Market size and forecast 2025-2030 ($ million)
Data Table on Israel - Market size and forecast 2025-2030 ($ million)
Chart on Israel - Year-over-year growth 2025-2030 (%)
Data Table on Israel - Year-over-year growth 2025-2030 (%)

12.6.5 Turkey - Market size and forecast 2025-2030

Chart on Turkey - Market size and forecast 2025-2030 ($ million)
Data Table on Turkey - Market size and forecast 2025-2030 ($ million)
Chart on Turkey - Year-over-year growth 2025-2030 (%)
Data Table on Turkey - Year-over-year growth 2025-2030 (%)

12.7 South America - Market size and forecast 2025-2030

Chart on South America - Market size and forecast 2025-2030 ($ million)
Data Table on South America - Market size and forecast 2025-2030 ($ million)
Chart on South America - Year-over-year growth 2025-2030 (%)
Data Table on South America - Year-over-year growth 2025-2030 (%)
Chart on Regional Comparison - South America
Data Table on Regional Comparison - South America

12.7.1 Brazil - Market size and forecast 2025-2030

Chart on Brazil - Market size and forecast 2025-2030 ($ million)
Data Table on Brazil - Market size and forecast 2025-2030 ($ million)
Chart on Brazil - Year-over-year growth 2025-2030 (%)
Data Table on Brazil - Year-over-year growth 2025-2030 (%)

12.7.2 Chile - Market size and forecast 2025-2030

Chart on Chile - Market size and forecast 2025-2030 ($ million)
Data Table on Chile - Market size and forecast 2025-2030 ($ million)
Chart on Chile - Year-over-year growth 2025-2030 (%)
Data Table on Chile - Year-over-year growth 2025-2030 (%)

12.7.3 Argentina - Market size and forecast 2025-2030

Chart on Argentina - Market size and forecast 2025-2030 ($ million)
Data Table on Argentina - Market size and forecast 2025-2030 ($ million)
Chart on Argentina - Year-over-year growth 2025-2030 (%)
Data Table on Argentina - Year-over-year growth 2025-2030 (%)

12.8 Market opportunity by geography

Market opportunity by geography ($ million)
Data Tables on Market opportunity by geography ($ million)

13. Drivers, Challenges, and Opportunity

13.1 Market drivers

Institutionalization of grid modernization and utility scale renewable integration
Growth of AI data centers and mission critical power reliability
Escalation of declining lithium costs and circular economy material innovations

13.2 Market challenges

Structural volatility within critical mineral supply chain
Intensification of regulatory friction and mandatory circularity compliance
Persistent grid connection bottlenecks and interconnection delays

13.3 Impact of drivers and challenges

Impact of drivers and challenges in 2025 and 2030

13.4 Market opportunities

Industrialization of AI-driven battery optimization
Advancements in zero-CapEx energy storage models
Evolution of high-density sodium chemistries

14. Competitive Landscape

14.1 Overview

14.2

Overview on criticality of inputs and factors of differentiation

14.3 Landscape disruption

Overview on factors of disruption

14.4 Industry risks

Impact of key risks on business

15. Competitive Analysis

15.1 Companies profiled

Companies covered

15.2 Company ranking index

15.3 Market positioning of companies

Matrix on companies position and classification

15.4 BYD Co. Ltd.

BYD Co. Ltd. - Overview
BYD Co. Ltd. - Business segments
BYD Co. Ltd. - Key news
BYD Co. Ltd. - Key offerings
BYD Co. Ltd. - Segment focus
SWOT

15.5 Contemporary Amperex Ltd.

Contemporary Amperex Ltd. - Overview
Contemporary Amperex Ltd. - Business segments
Contemporary Amperex Ltd. - Key offerings
Contemporary Amperex Ltd. - Segment focus
SWOT

15.6 EnerSys

EnerSys - Overview
EnerSys - Business segments
EnerSys - Key offerings
EnerSys - Segment focus
SWOT

15.7 EOS Energy Enterprises Inc.

EOS Energy Enterprises Inc. - Overview
EOS Energy Enterprises Inc. - Product / Service
EOS Energy Enterprises Inc. - Key offerings
SWOT

15.8 EVE Energy Co. Ltd.

EVE Energy Co. Ltd. - Overview
EVE Energy Co. Ltd. - Business segments
EVE Energy Co. Ltd. - Key offerings
EVE Energy Co. Ltd. - Segment focus
SWOT

15.9 Fluence Energy LLC

Fluence Energy LLC - Overview
Fluence Energy LLC - Product / Service
Fluence Energy LLC - Key offerings
SWOT

15.10 LG Energy Solution Ltd.

LG Energy Solution Ltd. - Overview
LG Energy Solution Ltd. - Product / Service
LG Energy Solution Ltd. - Key news
LG Energy Solution Ltd. - Key offerings
SWOT

15.11 Northvolt AB

Northvolt AB - Overview
Northvolt AB - Product / Service
Northvolt AB - Key offerings
SWOT

15.12 Panasonic Holdings Corp.

Panasonic Holdings Corp. - Overview
Panasonic Holdings Corp. - Business segments
Panasonic Holdings Corp. - Key news
Panasonic Holdings Corp. - Key offerings
Panasonic Holdings Corp. - Segment focus
SWOT

15.13 Samsung SDI Co. Ltd.

Samsung SDI Co. Ltd. - Overview
Samsung SDI Co. Ltd. - Business segments
Samsung SDI Co. Ltd. - Key offerings
Samsung SDI Co. Ltd. - Segment focus
SWOT

15.14 Sonnen GmbH

Sonnen GmbH - Overview
Sonnen GmbH - Product / Service
Sonnen GmbH - Key offerings
SWOT

15.15 Sungrow Power Supply Co. Ltd.

Sungrow Power Supply Co. Ltd. - Overview
Sungrow Power Supply Co. Ltd. - Product / Service
Sungrow Power Supply Co. Ltd. - Key offerings
SWOT

15.16 Tesla Inc.

Tesla Inc. - Overview
Tesla Inc. - Business segments
Tesla Inc. - Key offerings
Tesla Inc. - Segment focus
SWOT

15.17 VARTA AG

VARTA AG - Overview
VARTA AG - Business segments
VARTA AG - Key news
VARTA AG - Key offerings
VARTA AG - Segment focus
SWOT

15.18 Zhejiang Narada Power Source Co

Zhejiang Narada Power Source Co - Overview
Zhejiang Narada Power Source Co - Business segments
Zhejiang Narada Power Source Co - Key offerings
Zhejiang Narada Power Source Co - Segment focus
SWOT

16. Appendix

16.1 Scope of the report

Market definition
Objectives
Notes and caveats

16.2 Inclusions and exclusions checklist

Inclusions checklist
Exclusions checklist

16.3 Currency conversion rates for US$

16.4 Research methodology

16.5 Data procurement

Information sources

16.6 Data validation

16.7 Validation techniques employed for market sizing

16.8 Data synthesis

16.9 360 degree market analysis

16.10 List of abbreviations

Research Methodology

Technavio presents a detailed picture of the market by way of study, synthesis, and summation of data from multiple sources. The analysts have presented the various facets of the market with a particular focus on identifying the key industry influencers. The data thus presented is comprehensive, reliable, and the result of extensive research, both primary and secondary.

INFORMATION SOURCES

Primary sources

  • Manufacturers and suppliers
  • Channel partners
  • Industry experts
  • Strategic decision makers

Secondary sources

  • Industry journals and periodicals
  • Government data
  • Financial reports of key industry players
  • Historical data
  • Press releases

DATA ANALYSIS

Data Synthesis

  • Collation of data
  • Estimation of key figures
  • Analysis of derived insights

Data Validation

  • Triangulation with data models
  • Reference against proprietary databases
  • Corroboration with industry experts

REPORT WRITING

Qualitative

  • Market drivers
  • Market challenges
  • Market trends
  • Five forces analysis

Quantitative

  • Market size and forecast
  • Market segmentation
  • Geographical insights
  • Competitive landscape

Interested in this report?

Get your sample now to see our research methodology and insights!

Download Now

Frequently Asked Questions

Battery For Energy Storage Systems (ESS) market growth will increase by USD 28152.4 million during 2026-2030.

The Battery For Energy Storage Systems (ESS) market is expected to grow at a CAGR of 24.8% during 2026-2030.

Battery For Energy Storage Systems (ESS) market is segmented by Technology (Lithium-ion batteries, Flow batteries, Others) Connectivity (On-grid, Off-grid) Ownership (Utility owned, Third-party owned, Customer owned)

BYD Co. Ltd., Contemporary Amperex Ltd., EnerSys, EOS Energy Enterprises Inc., ESS Tech Inc., EVE Energy Co. Ltd., Fluence Energy LLC, Invinity Energy Systems plc, LG Energy Solution Ltd., Northvolt AB, Panasonic Holdings Corp., Powin Inc., Saft Groupe SAS, Samsung SDI Co. Ltd., Sonnen GmbH, Sungrow Power Supply Co. Ltd., Tesla Inc., VARTA AG, Xiamen Hithium Energy Co. Ltd., Zhejiang Narada Power Source Co are a few of the key vendors in the Battery For Energy Storage Systems (ESS) market.

APAC will register the highest growth rate of 52.7% among the other regions. Therefore, the Battery For Energy Storage Systems (ESS) market in APAC is expected to garner significant business opportunities for the vendors during the forecast period.

China, India, Japan, Australia, South Korea, Indonesia, US, Canada, Mexico, Germany, UK, Italy, France, Spain, The Netherlands, Saudi Arabia, UAE, South Africa, Israel, Turkey, Brazil, Chile, Argentina

  • Institutionalization of grid modernization and utility scale renewable integration is the driving factor this market.

The Battery For Energy Storage Systems (ESS) market vendors should focus on grabbing business opportunities from the Technology segment as it accounted for the largest market share in the base year.
RIA - Research AI Assistant
Ask RIA