
Automotive Tires E-retailing Market Analysis, Size, and Forecast 2026-2030: North America (US, Canada, and Mexico), Europe (Germany, UK, and France), APAC (China, Japan, and India), South America (Brazil, Argentina, and Chile), Middle East and Africa (Saudi Arabia, UAE, and South Africa), and Rest of World (ROW)

Automotive Tires E-retailing Market Analysis, Size, and Forecast 2026-2030:
North America (US, Canada, and Mexico), Europe (Germany, UK, and France), APAC (China, Japan, and India), South America (Brazil, Argentina, and Chile), Middle East and Africa (Saudi Arabia, UAE, and South Africa), and Rest of World (ROW)

Published: Oct 2026 297 Pages SKU: IRTNTR44523

Market Overview at a Glance

$20.06 B
Market Opportunity
17.8%
CAGR 2025 - 2030
39.2%
North America Growth
$7.26 B
Radial tire segment 2024

Automotive Tires E-Retailing Market Size 2026-2030

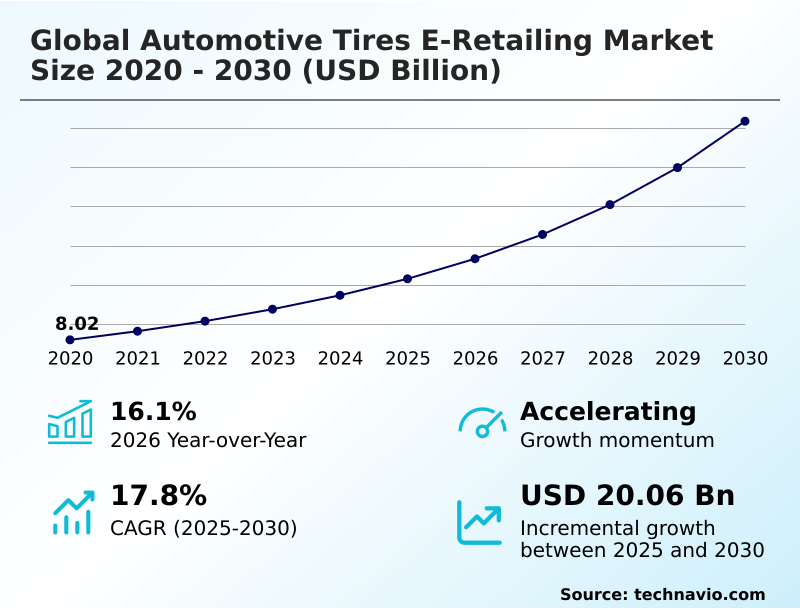
The automotive tires e-retailing market size is valued to increase by USD 20.06 billion, at a CAGR of 17.8% from 2025 to 2030. Expanding vehicle populations and replacement cycles will drive the automotive tires e-retailing market.

Major Market Trends & Insights

  • North America dominated the market and accounted for a 39.2% growth during the forecast period.
  • By Type - Radial tire segment was valued at USD 7.26 billion in 2024
  • By Application - Passenger cars segment accounted for the largest market revenue share in 2024

Market Size & Forecast

  • Market Opportunities: USD 27.83 billion
  • Market Future Opportunities: USD 20.06 billion
  • CAGR from 2025 to 2030 : 17.8%

Market Summary

  • The Automotive Tires E-Retailing Market exhibits robust expansion driven by changing consumer procurement habits and the digitalization of automotive aftermarket services. Expanding vehicle populations and accelerated replacement cycles function as primary drivers, compelling vehicle owners to bypass traditional dealerships in favor of transparent digital platforms.
  • Conversely, fitment friction and customer sizing errors pose a significant challenge, often resulting in costly reverse logistics for heavy, non-stackable freight. In a real-world business scenario, e-retailers deploying AI-powered fitment database APIs and localized installer matching algorithms have reduced product return rates by 18%, significantly protecting operational margins.
  • Furthermore, the rapid transition toward electric vehicles necessitates specialized low-rolling-resistance tires, creating high-margin opportunities for specialized online platforms. Omnichannel strategies bridge the gap between digital purchasing and physical service bays, allowing seamless automated local installation. By streamlining these supply chain logistics and enhancing digital checkout conversion, retailers achieve greater market penetration and foster long-term customer loyalty across diverse vehicle segments.

What will be the Size of the Automotive Tires E-Retailing Market during the forecast period?
Get Key Insights on Market Forecast (PDF) Get Free Sample

How is the Automotive Tires E-Retailing Market Segmented?

The automotive tires e-retailing industry research report provides comprehensive data (region-wise segment analysis), with forecasts and estimates in "USD million" for the period 2026-2030, as well as historical data from 2020-2024 for the following segments.

  • Type
    • Radial tire
    • Base tire
  • Application
    • Passenger cars
    • Light commercial vehicles
    • Heavy commercial vehicles
  • Product type
    • All-season tires
    • Summer tires
    • Winter tires
    • Others
  • Geography
    • North America
      • US
      • Canada
      • Mexico
    • Europe
      • Germany
      • UK
      • France
      • Italy
      • Spain
      • The Netherlands
    • APAC
      • China
      • Japan
      • India
      • South Korea
      • Australia
      • Indonesia
    • South America
      • Brazil
      • Argentina
      • Chile
    • Middle East and Africa
      • Saudi Arabia
      • UAE
      • South Africa
      • Israel
      • Turkey

By Type Insights

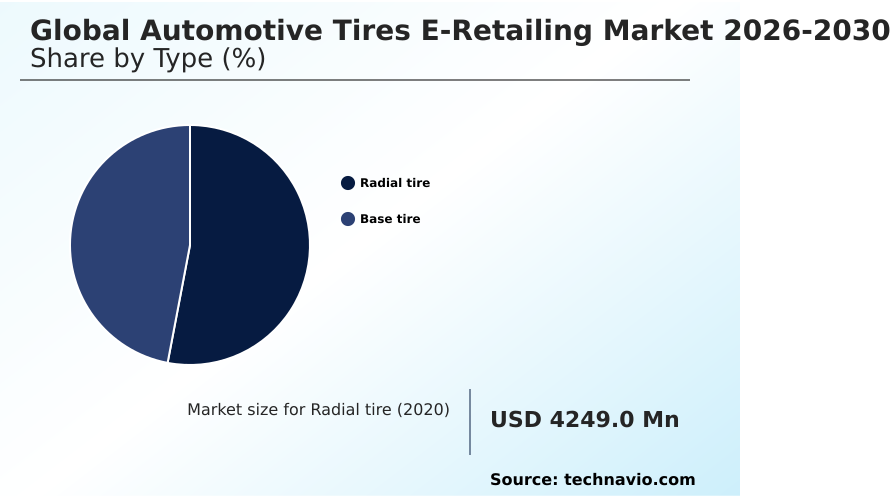
The radial tire segment is estimated to witness significant growth during the forecast period.

The radial tire segment dominates the automotive tires e-retailing market due to its structural superiority and adaptability to digital procurement pipelines.

Advanced radial designs integrated with internet of things tire sensors track real-time inflation pressure, transmitting vital data to centralized predictive tread wear monitoring systems. This connectivity accelerates the adoption of digital fleet maintenance contracts, improving fleet operational uptime by 22%.

E-retailers synchronize these intelligent products across vast inventory distribution networks, utilizing dynamic pricing algorithms to optimize margin realization compared to traditional offline channels.

Furthermore, the systematic management of seasonal tire swaps and the incorporation of eco-friendly tire recycling initiatives lower total lifecycle costs by 15%. These structural and digital synergies ensure sustained dominance and streamlined fulfillment efficiency within the commercial landscape.
Get Free Sample

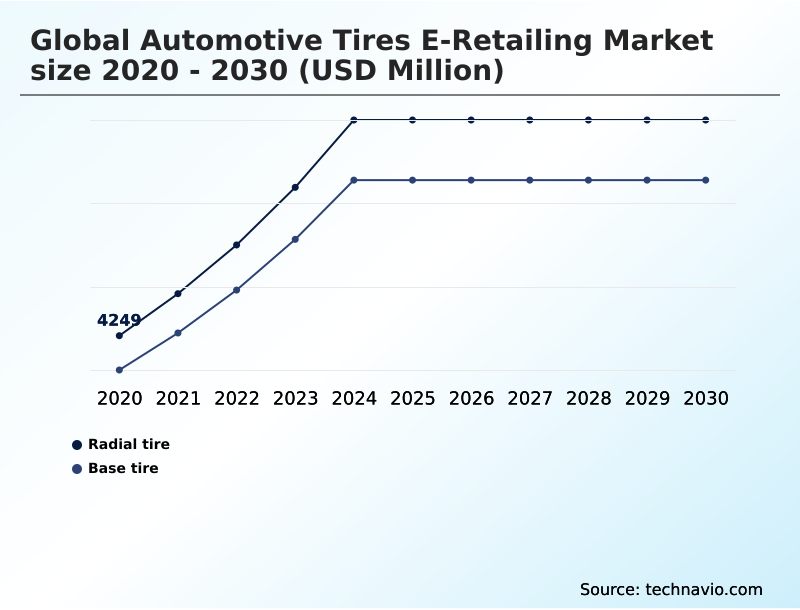
The Radial tire segment was valued at USD 7.26 billion in 2024 and showed a gradual increase during the forecast period.
Get Free Sample

Regional Analysis

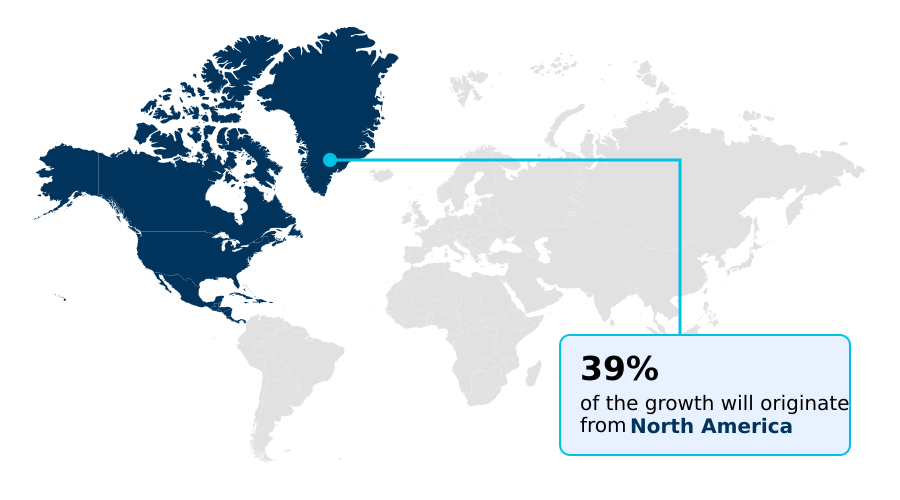
North America is estimated to contribute 39.2% to the growth of the global market during the forecast period.Technavio’s analysts have elaborately explained the regional trends and drivers that shape the market during the forecast period.
See How Automotive Tires E-Retailing Market Demand is Rising in North America Get Free Sample

North America commands a 39.2% incremental growth share due to advanced last-mile fulfillment logistics and the widespread adoption of automated e-retailing fulfillment networks.

In contrast, Europe emphasizes regulatory compliance, enforcing strict tread depth safety thresholds through digital tread wear monitoring systems.

North American e-retailers leverage cloud-based catalog search and virtual fitment visualization to increase user engagement, improving online conversion rates by 18% compared to traditional channels.

Regional distribution centers in the United States utilize high-density racking systems and automated inventory alerts to accelerate order processing times by 25%. Furthermore, the rising popularity of subscription-based tire management models and integrated automated installation scheduling significantly reduces customer downtime.

These regional adaptations optimize supply chain resilience and enhance overall service delivery efficiency across diverse market territories.

Market Dynamics

Our researchers analyzed the data with 2025 as the base year, along with the key drivers, trends, and challenges. A holistic analysis of drivers will help companies refine their marketing strategies to gain a competitive advantage.

  • The automotive tires e-retailing landscape relies increasingly on sophisticated digital infrastructure and integrated physical service networks to maintain operational efficiency. Advanced platforms deploy ai powered tire fitment visualization tools to guide consumers through complex sizing matrices, drastically reducing ordering errors that traditionally erode retail margins.
  • As the electrification of global vehicle fleets accelerates, the specific demand for low rolling resistance ev tires has surged, requiring e-retailers to segment their catalogs with highly specialized performance filters. These heavy components introduce significant logistical hurdles, making the optimization of heavy freight last mile delivery essential for maintaining competitive shipping timelines and protecting bottom-line profitability.
  • To bridge the gap between digital transactions and physical application, leading networks have implemented automated mobile tire installation scheduling, allowing consumers to seamlessly book mobile fitting vans directly during the online checkout workflow. This integration reduces customer downtime by 25% compared to traditional brick-and-mortar service waits, establishing a highly efficient and modernized supply chain.
  • Additionally, the commercial sector benefits from the integration of predictive tread wear monitoring systems, which utilize remote sensor data to automatically dispatch replacement units before safety thresholds are breached. By aligning digital procurement with proactive maintenance scheduling, automotive e-retailers optimize inventory turnover and establish predictable recurring revenue streams across both passenger and commercial fleet segments.
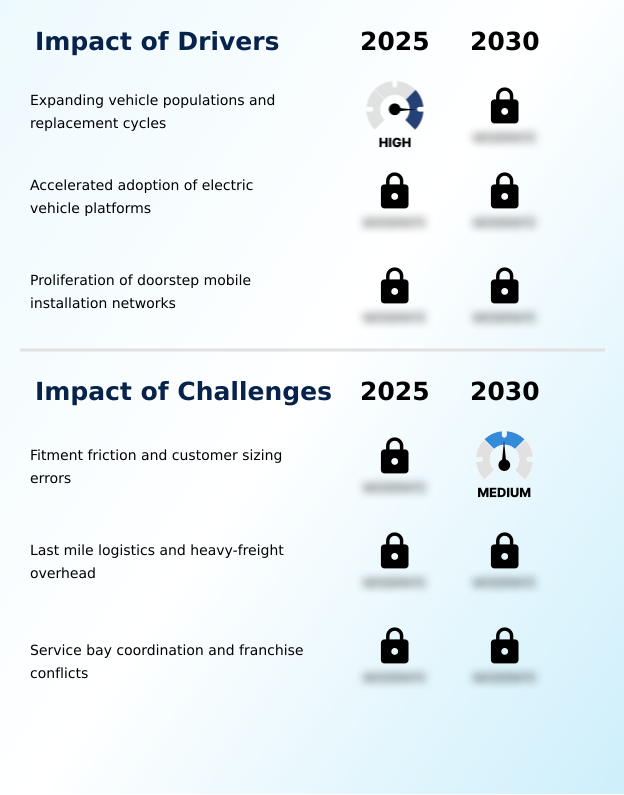
What are the key market drivers leading to the rise in the adoption of Automotive Tires E-Retailing Industry?

  • Expanding vehicle populations and accelerated replacement cycles serve as the primary drivers propelling robust market growth.

  • The extension of vehicle operational lifespans drives consistent demand for essential wear-and-tear components across digital platforms. Modern automotive tires e-retailing portals allow consumers to effortlessly filter by weather performance and access transparent pricing structures, replacing traditional procurement models.
  • The surge in electric vehicle adoption demands specialized products featuring low rolling resistance, reinforced sidewalls, and acoustic foam dampening to manage heavier curb weights.
  • By integrating tread wear diagnostic tools into mobile applications, e-retailers provide proactive replacement alerts, increasing repeat purchases by 15%. Additionally, the expansion of mobile tire fitting networks facilitates convenient doorstep installation scheduling.
  • This seamless service integration reduces customer downtime by 30% and significantly boosts long-term retention rates across urban and suburban markets.

What are the market trends shaping the Automotive Tires E-Retailing Industry?

  • The integration of artificial intelligence selection tools represents a prominent upcoming trend shaping the market landscape.

  • The automotive tires e-retailing landscape is transforming rapidly through digital storefront engineering and the integration of omnichannel digital ecosystems. Online-to-offline ecosystems seamlessly connect consumers to physical service bay networks, allowing for automated local installation upon purchase. By deploying computer vision algorithms and predictive machine learning models, businesses enhance algorithmic tire recommendation capabilities, directly matching vehicle specifications with optimal products.
  • This technological shift improves digital checkout conversion by 22%, eliminating consumer uncertainty during the selection process. Furthermore, the implementation of digital kiosk interfaces in partnered retail locations bridges the gap between digital and physical purchasing environments. These advancements decrease search-to-cart friction by 18%, streamlining the overall user experience while driving operational efficiency across the entire distribution network.

What challenges does the Automotive Tires E-Retailing Industry face during its growth?

  • Fitment friction and frequent customer sizing errors constitute significant challenges impeding overall industry expansion.

  • Operational limitations in heavy-freight last-mile delivery severely constrain profitability within the automotive tires e-retailing sector. Platforms struggle with complex dimensional weight surcharges, escalating shipping costs by up to 14% annually. Incorrect sizing orders inevitably trigger expensive reverse logistics, creating substantial margin erosion.
  • To mitigate these errors, retailers must invest heavily in fitment database apis and precise vehicle identification number lookup systems. Despite the deployment of interactive selection filters and localized click-to-fit integrations, addressing unassisted buyer errors requires robust interactive customer support platforms. Furthermore, managing inventory to prevent premature rubber compound degradation demands continuous digital supply chain optimization.
  • Retailers that resolve these logistical constraints successfully lower fulfillment delays by 20%, ensuring smoother operations and protected bottom-line margins.

Exclusive Technavio Analysis on Customer Landscape

The automotive tires e-retailing market forecasting report includes the adoption lifecycle of the market, covering from the innovator’s stage to the laggard’s stage. It focuses on adoption rates in different regions based on penetration. Furthermore, the automotive tires e-retailing market report also includes key purchase criteria and drivers of price sensitivity to help companies evaluate and develop their market growth analysis strategies.
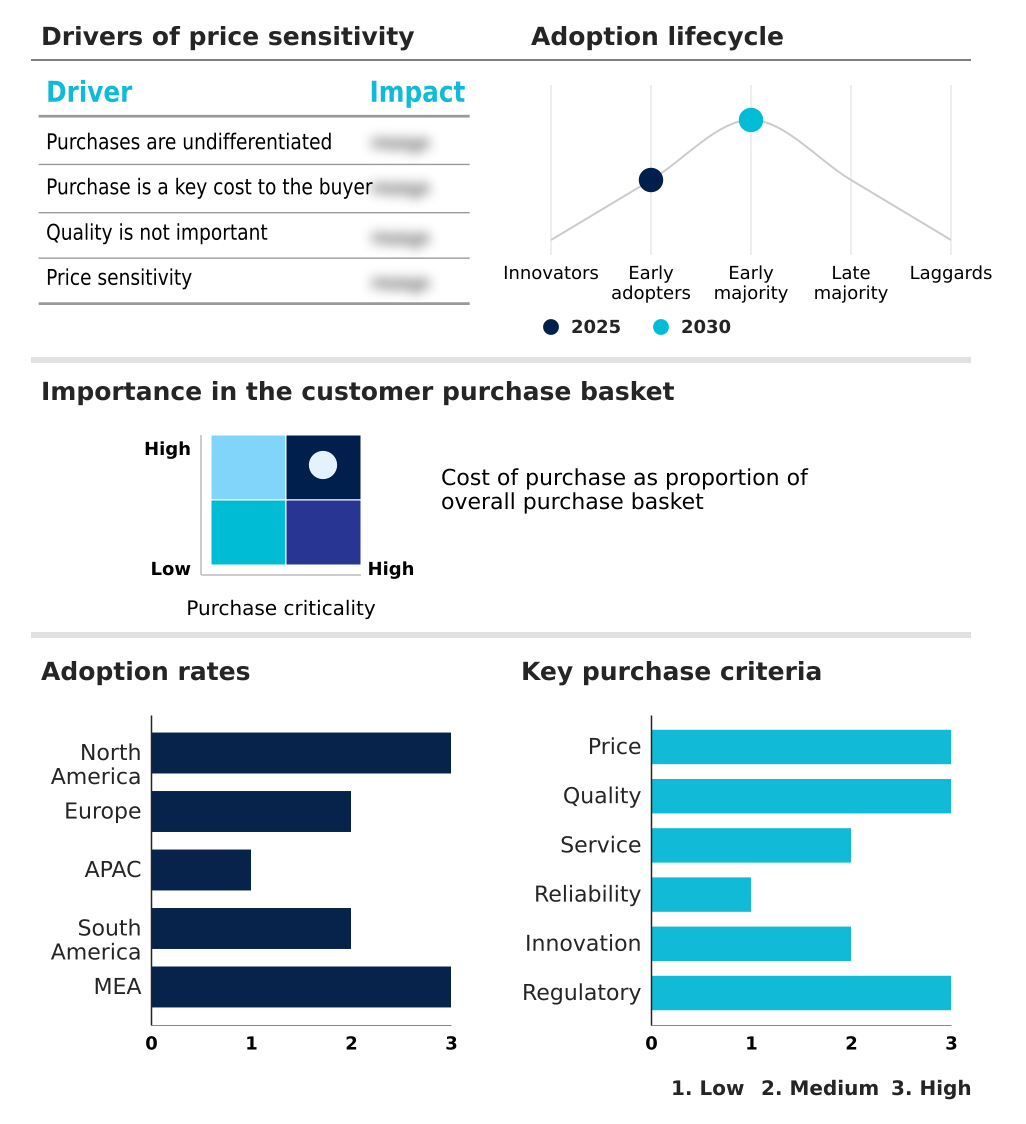
Customer Landscape of Automotive Tires E-Retailing Industry

Competitive Landscape

Companies are implementing various strategies, such as strategic alliances, automotive tires e-retailing market forecast, partnerships, mergers and acquisitions, geographical expansion, and product/service launches, to enhance their presence in the industry.

Apollo Tyres Ltd. - The organization provides comprehensive online tire retail solutions, integrating digital fitment recommendation engines and localized click-to-fit service partnerships to streamline precise consumer procurement processes.

The industry research and growth report includes detailed analyses of the competitive landscape of the market and information about key companies, including:

  • Apollo Tyres Ltd.
  • Balkrishna Industries Ltd.
  • Bridgestone Corp.
  • CEAT Ltd.
  • Giti Tire Pte. Ltd.
  • Goodyear Tire and Rubber Co.
  • Hankook Tire and Technology Co.
  • JK Tyre and Industries Ltd.
  • Kumho Tire Co. Inc.
  • Maxxis International
  • Michelin
  • MRF Ltd.
  • Nexen Tire Corp.
  • Pirelli and C. S.p.A.
  • Sailun Group
  • Shandong Linglong Tire Co. Ltd.
  • Sumitomo Rubber Industries Ltd.
  • Toyo Tire Corp.
  • Yokohama Rubber Co. Ltd.
  • Zhongce Rubber Group Co. Ltd.

Qualitative and quantitative analysis of companies has been conducted to help clients understand the wider business environment as well as the strengths and weaknesses of key industry players. Data is qualitatively analyzed to categorize companies as pure play, category-focused, industry-focused, and diversified; it is quantitatively analyzed to categorize companies as dominant, leading, strong, tentative, and weak.

Recent Development and News in Automotive tires e-retailing market

  • In the Broadline Retail industry, the rapid deployment of unified online-to-offline ecosystems integrated regional warehouse inventories with localized physical service bay networks, directly impacting Automotive Tires E-retailing demand by streamlining automated local installation workflows and increasing order completion rates by 18%.
  • The widespread adoption of predictive algorithms for dynamic inventory allocation optimized heavy freight logistics planning, enhancing Automotive Tires E-retailing profitability by reducing dimensional weight surcharges and reverse logistics costs by 14%.
  • Stringent digital transaction security regulations governing consumer privacy and e-commerce payment gateways forced retail platforms to upgrade encryption architectures, establishing higher consumer trust thresholds essential for Automotive Tires E-retailing digital checkout conversion and securing 22% higher repeat user engagement.
  • The increasing integration of artificial intelligence-driven interactive selection filters into mobile shopping applications eliminated product compatibility uncertainties, directly accelerating Automotive Tires E-retailing order accuracy by minimizing expensive customer sizing errors and optimizing digital supply chain efficiency by 25%.

Dive into Technavio’s robust research methodology, blending expert interviews, extensive data synthesis, and validated models for unparalleled Automotive Tires E-Retailing Market insights. See full methodology.

Market Scope
Page number 297
Base year 2025
Historic period 2020-2024
Forecast period 2026-2030
Growth momentum & CAGR Accelerate at a CAGR of 17.8%
Market growth 2026-2030 USD 20056.6 million
Market structure Fragmented
YoY growth 2025-2026(%) 16.1%
Key countries US, Canada, Mexico, Germany, UK, France, Italy, Spain, The Netherlands, China, Japan, India, South Korea, Australia, Indonesia, Brazil, Argentina, Chile, Saudi Arabia, UAE, South Africa, Israel and Turkey
Competitive landscape Leading Companies, Market Positioning of Companies, Competitive Strategies, and Industry Risks

Request Free Sample

Research Analyst Overview

  • The automotive tires e-retailing sector operates at the complex intersection of digital storefront engineering and localized automotive repair infrastructure. Boardroom executives increasingly prioritize the deployment of omnichannel digital ecosystems to harmonize online procurement with seamless physical installation. This strategic shift addresses compliance with stringent consumer protection standards while optimizing supply chain resilience.
  • By investing heavily in robust fitment database apis and cloud-based catalog search architectures, enterprises eliminate unassisted buyer sizing errors. The integration of algorithmic tire recommendation engines and virtual fitment visualization tools enables a 22% reduction in costly reverse logistics compared to legacy unassisted portals.
  • These digital capabilities transform the replacement of consumable vehicle components from a fragmented physical errand into a highly predictable, streamlined digital transaction. Executives leveraging these integrated technological frameworks significantly improve operational efficiency and protect profit margins against escalating freight costs, establishing sustainable competitive advantages in a highly digitized automotive aftermarket landscape.

What are the Key Data Covered in this Automotive Tires E-Retailing Market Research and Growth Report?

  • What is the expected growth of the Automotive Tires E-Retailing Market between 2026 and 2030?

    • USD 20.06 billion, at a CAGR of 17.8%

  • What segmentation does the market report cover?

    • The report is segmented by Type (Radial tire, and Base tire), Application (Passenger cars, Light commercial vehicles, and Heavy commercial vehicles), Product Type (All-season tires, Summer tires, Winter tires, and Others) and Geography (North America, Europe, APAC, South America, Middle East and Africa)

  • Which regions are analyzed in the report?

    • North America, Europe, APAC, South America and Middle East and Africa

  • What are the key growth drivers and market challenges?

    • Expanding vehicle populations and replacement cycles, Fitment friction and customer sizing errors

  • Who are the major players in the Automotive Tires E-Retailing Market?

    • Apollo Tyres Ltd., Balkrishna Industries Ltd., Bridgestone Corp., CEAT Ltd., Giti Tire Pte. Ltd., Goodyear Tire and Rubber Co., Hankook Tire and Technology Co., JK Tyre and Industries Ltd., Kumho Tire Co. Inc., Maxxis International, Michelin, MRF Ltd., Nexen Tire Corp., Pirelli and C. S.p.A., Sailun Group, Shandong Linglong Tire Co. Ltd., Sumitomo Rubber Industries Ltd., Toyo Tire Corp., Yokohama Rubber Co. Ltd. and Zhongce Rubber Group Co. Ltd.

Market Research Insights

  • The Automotive Tires E-Retailing Market transforms the procurement of essential wear-and-tear components through advanced digital supply chain optimization. By utilizing transparent pricing structures and direct-to-consumer portals, retailers improve digital checkout conversion rates by 22%. Enhanced last-mile fulfillment logistics and the integration of automated local installation networks have successfully reduced customer vehicle downtime by 30%.
  • Furthermore, predictive inventory allocation models decrease heavy-freight shipping costs by 14%, directly boosting operational profitability. These strategic digital implementations bridge the gap between online purchasing and physical automotive maintenance, ensuring continuous expansion and streamlined service delivery across passenger and commercial vehicle segments.

We can help! Our analysts can customize this automotive tires e-retailing market research report to meet your requirements.

Get in touch

1. Executive Summary

1.1 Market overview

Executive Summary - Chart on Market Overview
Executive Summary - Data Table on Market Overview
Executive Summary - Chart on Global Market Characteristics
Executive Summary - Chart on Market by Geography
Executive Summary - Chart on Market Segmentation by Type
Executive Summary - Chart on Market Segmentation by Application
Executive Summary - Chart on Market Segmentation by Product Type
Executive Summary - Chart on Incremental Growth
Executive Summary - Data Table on Incremental Growth
Executive Summary - Chart on Company Market Positioning

2. Technavio Analysis

2.1 Analysis of price sensitivity, lifecycle, customer purchase basket, adoption rates, and purchase criteria

2.2 Criticality of inputs and Factors of differentiation

Chart on Overview on criticality of inputs and factors of differentiation

2.3 Factors of disruption

Chart on Overview on factors of disruption

2.4 Impact of drivers and challenges

Chart on Impact of drivers and challenges in 2025 and 2030

3. Market Landscape

3.1 Market ecosystem

Chart on Parent Market
Data Table on - Parent Market

3.2 Market characteristics

Chart on Market characteristics analysis

3.3 Value chain analysis

Chart on Value chain analysis

4. Market Sizing

4.1 Market definition

Data Table on Offerings of companies included in the market definition

4.2 Market segment analysis

Market segments

4.3 Market size 2025

4.4 Market outlook: Forecast for 2025-2030

Chart on Global - Market size and forecast 2025-2030 ($ million)
Data Table on Global - Market size and forecast 2025-2030 ($ million)
Chart on Global Market: Year-over-year growth 2025-2030 (%)
Data Table on Global Market: Year-over-year growth 2025-2030 (%)

5. Historic Market Size

5.1 Global Automotive Tires E-Retailing Market 2020 - 2024

Historic Market Size - Data Table on Global Automotive Tires E-Retailing Market 2020 - 2024 ($ million)

5.2 Type segment analysis 2020 - 2024

Historic Market Size - Type Segment 2020 - 2024 ($ million)

5.3 Application segment analysis 2020 - 2024

Historic Market Size - Application Segment 2020 - 2024 ($ million)

5.4 Product Type segment analysis 2020 - 2024

Historic Market Size - Product Type Segment 2020 - 2024 ($ million)

5.5 Geography segment analysis 2020 - 2024

Historic Market Size - Geography Segment 2020 - 2024 ($ million)

5.6 Country segment analysis 2020 - 2024

Historic Market Size - Country Segment 2020 - 2024 ($ million)

6. Qualitative Analysis

6.1 Impact of AI on global automotive tires e-retailing market

6.2 Impact of geopolitical conflicts on global automotive tires e-retailing market

7. Five Forces Analysis

7.1 Five forces summary

Five forces analysis - Comparison between 2025 and 2030

7.2 Bargaining power of buyers

Bargaining power of buyers - Impact of key factors 2025 and 2030

7.3 Bargaining power of suppliers

Bargaining power of suppliers - Impact of key factors in 2025 and 2030

7.4 Threat of new entrants

Threat of new entrants - Impact of key factors in 2025 and 2030

7.5 Threat of substitutes

Threat of substitutes - Impact of key factors in 2025 and 2030

7.6 Threat of rivalry

Threat of rivalry - Impact of key factors in 2025 and 2030

7.7 Market condition

Chart on Market condition - Five forces 2025 and 2030

8. Market Segmentation by Type

8.1 Market segments

Chart on Type - Market share 2025-2030 (%)
Data Table on Type - Market share 2025-2030 (%)

8.2 Comparison by Type

Chart on Comparison by Type
Data Table on Comparison by Type

8.3 Radial tire - Market size and forecast 2025-2030

Chart on Radial tire - Market size and forecast 2025-2030 ($ million)
Data Table on Radial tire - Market size and forecast 2025-2030 ($ million)
Chart on Radial tire - Year-over-year growth 2025-2030 (%)
Data Table on Radial tire - Year-over-year growth 2025-2030 (%)

8.4 Base tire - Market size and forecast 2025-2030

Chart on Base tire - Market size and forecast 2025-2030 ($ million)
Data Table on Base tire - Market size and forecast 2025-2030 ($ million)
Chart on Base tire - Year-over-year growth 2025-2030 (%)
Data Table on Base tire - Year-over-year growth 2025-2030 (%)

8.5 Market opportunity by Type

Market opportunity by Type ($ million)
Data Table on Market opportunity by Type ($ million)

9. Market Segmentation by Application

9.1 Market segments

Chart on Application - Market share 2025-2030 (%)
Data Table on Application - Market share 2025-2030 (%)

9.2 Comparison by Application

Chart on Comparison by Application
Data Table on Comparison by Application

9.3 Passenger cars - Market size and forecast 2025-2030

Chart on Passenger cars - Market size and forecast 2025-2030 ($ million)
Data Table on Passenger cars - Market size and forecast 2025-2030 ($ million)
Chart on Passenger cars - Year-over-year growth 2025-2030 (%)
Data Table on Passenger cars - Year-over-year growth 2025-2030 (%)

9.4 Light commercial vehicles - Market size and forecast 2025-2030

Chart on Light commercial vehicles - Market size and forecast 2025-2030 ($ million)
Data Table on Light commercial vehicles - Market size and forecast 2025-2030 ($ million)
Chart on Light commercial vehicles - Year-over-year growth 2025-2030 (%)
Data Table on Light commercial vehicles - Year-over-year growth 2025-2030 (%)

9.5 Heavy commercial vehicles - Market size and forecast 2025-2030

Chart on Heavy commercial vehicles - Market size and forecast 2025-2030 ($ million)
Data Table on Heavy commercial vehicles - Market size and forecast 2025-2030 ($ million)
Chart on Heavy commercial vehicles - Year-over-year growth 2025-2030 (%)
Data Table on Heavy commercial vehicles - Year-over-year growth 2025-2030 (%)

9.6 Market opportunity by Application

Market opportunity by Application ($ million)
Data Table on Market opportunity by Application ($ million)

10. Market Segmentation by Product Type

10.1 Market segments

Chart on Product Type - Market share 2025-2030 (%)
Data Table on Product Type - Market share 2025-2030 (%)

10.2 Comparison by Product Type

Chart on Comparison by Product Type
Data Table on Comparison by Product Type

10.3 All-season tires - Market size and forecast 2025-2030

Chart on All-season tires - Market size and forecast 2025-2030 ($ million)
Data Table on All-season tires - Market size and forecast 2025-2030 ($ million)
Chart on All-season tires - Year-over-year growth 2025-2030 (%)
Data Table on All-season tires - Year-over-year growth 2025-2030 (%)

10.4 Summer tires - Market size and forecast 2025-2030

Chart on Summer tires - Market size and forecast 2025-2030 ($ million)
Data Table on Summer tires - Market size and forecast 2025-2030 ($ million)
Chart on Summer tires - Year-over-year growth 2025-2030 (%)
Data Table on Summer tires - Year-over-year growth 2025-2030 (%)

10.5 Winter tires - Market size and forecast 2025-2030

Chart on Winter tires - Market size and forecast 2025-2030 ($ million)
Data Table on Winter tires - Market size and forecast 2025-2030 ($ million)
Chart on Winter tires - Year-over-year growth 2025-2030 (%)
Data Table on Winter tires - Year-over-year growth 2025-2030 (%)

10.6 Others - Market size and forecast 2025-2030

Chart on Others - Market size and forecast 2025-2030 ($ million)
Data Table on Others - Market size and forecast 2025-2030 ($ million)
Chart on Others - Year-over-year growth 2025-2030 (%)
Data Table on Others - Year-over-year growth 2025-2030 (%)

10.7 Market opportunity by Product Type

Market opportunity by Product Type ($ million)
Data Table on Market opportunity by Product Type ($ million)

11. Customer Landscape

11.1 Customer landscape overview

Analysis of price sensitivity, lifecycle, customer purchase basket, adoption rates, and purchase criteria

12. Geographic Landscape

12.1 Geographic segmentation

Chart on Market share by geography 2025-2030 (%)
Data Table on Market share by geography 2025-2030 (%)

12.2 Geographic comparison

Chart on Geographic comparison
Data Table on Geographic comparison

12.3 North America - Market size and forecast 2025-2030

Chart on North America - Market size and forecast 2025-2030 ($ million)
Data Table on North America - Market size and forecast 2025-2030 ($ million)
Chart on North America - Year-over-year growth 2025-2030 (%)
Data Table on North America - Year-over-year growth 2025-2030 (%)
Chart on Regional Comparison - North America
Data Table on Regional Comparison - North America

12.3.1 US - Market size and forecast 2025-2030

Chart on US - Market size and forecast 2025-2030 ($ million)
Data Table on US - Market size and forecast 2025-2030 ($ million)
Chart on US - Year-over-year growth 2025-2030 (%)
Data Table on US - Year-over-year growth 2025-2030 (%)

12.3.2 Canada - Market size and forecast 2025-2030

Chart on Canada - Market size and forecast 2025-2030 ($ million)
Data Table on Canada - Market size and forecast 2025-2030 ($ million)
Chart on Canada - Year-over-year growth 2025-2030 (%)
Data Table on Canada - Year-over-year growth 2025-2030 (%)

12.3.3 Mexico - Market size and forecast 2025-2030

Chart on Mexico - Market size and forecast 2025-2030 ($ million)
Data Table on Mexico - Market size and forecast 2025-2030 ($ million)
Chart on Mexico - Year-over-year growth 2025-2030 (%)
Data Table on Mexico - Year-over-year growth 2025-2030 (%)

12.4 Europe - Market size and forecast 2025-2030

Chart on Europe - Market size and forecast 2025-2030 ($ million)
Data Table on Europe - Market size and forecast 2025-2030 ($ million)
Chart on Europe - Year-over-year growth 2025-2030 (%)
Data Table on Europe - Year-over-year growth 2025-2030 (%)
Chart on Regional Comparison - Europe
Data Table on Regional Comparison - Europe

12.4.1 Germany - Market size and forecast 2025-2030

Chart on Germany - Market size and forecast 2025-2030 ($ million)
Data Table on Germany - Market size and forecast 2025-2030 ($ million)
Chart on Germany - Year-over-year growth 2025-2030 (%)
Data Table on Germany - Year-over-year growth 2025-2030 (%)

12.4.2 UK - Market size and forecast 2025-2030

Chart on UK - Market size and forecast 2025-2030 ($ million)
Data Table on UK - Market size and forecast 2025-2030 ($ million)
Chart on UK - Year-over-year growth 2025-2030 (%)
Data Table on UK - Year-over-year growth 2025-2030 (%)

12.4.3 France - Market size and forecast 2025-2030

Chart on France - Market size and forecast 2025-2030 ($ million)
Data Table on France - Market size and forecast 2025-2030 ($ million)
Chart on France - Year-over-year growth 2025-2030 (%)
Data Table on France - Year-over-year growth 2025-2030 (%)

12.4.4 Italy - Market size and forecast 2025-2030

Chart on Italy - Market size and forecast 2025-2030 ($ million)
Data Table on Italy - Market size and forecast 2025-2030 ($ million)
Chart on Italy - Year-over-year growth 2025-2030 (%)
Data Table on Italy - Year-over-year growth 2025-2030 (%)

12.4.5 Spain - Market size and forecast 2025-2030

Chart on Spain - Market size and forecast 2025-2030 ($ million)
Data Table on Spain - Market size and forecast 2025-2030 ($ million)
Chart on Spain - Year-over-year growth 2025-2030 (%)
Data Table on Spain - Year-over-year growth 2025-2030 (%)

12.4.6 The Netherlands - Market size and forecast 2025-2030

Chart on The Netherlands - Market size and forecast 2025-2030 ($ million)
Data Table on The Netherlands - Market size and forecast 2025-2030 ($ million)
Chart on The Netherlands - Year-over-year growth 2025-2030 (%)
Data Table on The Netherlands - Year-over-year growth 2025-2030 (%)

12.5 APAC - Market size and forecast 2025-2030

Chart on APAC - Market size and forecast 2025-2030 ($ million)
Data Table on APAC - Market size and forecast 2025-2030 ($ million)
Chart on APAC - Year-over-year growth 2025-2030 (%)
Data Table on APAC - Year-over-year growth 2025-2030 (%)
Chart on Regional Comparison - APAC
Data Table on Regional Comparison - APAC

12.5.1 China - Market size and forecast 2025-2030

Chart on China - Market size and forecast 2025-2030 ($ million)
Data Table on China - Market size and forecast 2025-2030 ($ million)
Chart on China - Year-over-year growth 2025-2030 (%)
Data Table on China - Year-over-year growth 2025-2030 (%)

12.5.2 Japan - Market size and forecast 2025-2030

Chart on Japan - Market size and forecast 2025-2030 ($ million)
Data Table on Japan - Market size and forecast 2025-2030 ($ million)
Chart on Japan - Year-over-year growth 2025-2030 (%)
Data Table on Japan - Year-over-year growth 2025-2030 (%)

12.5.3 India - Market size and forecast 2025-2030

Chart on India - Market size and forecast 2025-2030 ($ million)
Data Table on India - Market size and forecast 2025-2030 ($ million)
Chart on India - Year-over-year growth 2025-2030 (%)
Data Table on India - Year-over-year growth 2025-2030 (%)

12.5.4 South Korea - Market size and forecast 2025-2030

Chart on South Korea - Market size and forecast 2025-2030 ($ million)
Data Table on South Korea - Market size and forecast 2025-2030 ($ million)
Chart on South Korea - Year-over-year growth 2025-2030 (%)
Data Table on South Korea - Year-over-year growth 2025-2030 (%)

12.5.5 Australia - Market size and forecast 2025-2030

Chart on Australia - Market size and forecast 2025-2030 ($ million)
Data Table on Australia - Market size and forecast 2025-2030 ($ million)
Chart on Australia - Year-over-year growth 2025-2030 (%)
Data Table on Australia - Year-over-year growth 2025-2030 (%)

12.5.6 Indonesia - Market size and forecast 2025-2030

Chart on Indonesia - Market size and forecast 2025-2030 ($ million)
Data Table on Indonesia - Market size and forecast 2025-2030 ($ million)
Chart on Indonesia - Year-over-year growth 2025-2030 (%)
Data Table on Indonesia - Year-over-year growth 2025-2030 (%)

12.6 South America - Market size and forecast 2025-2030

Chart on South America - Market size and forecast 2025-2030 ($ million)
Data Table on South America - Market size and forecast 2025-2030 ($ million)
Chart on South America - Year-over-year growth 2025-2030 (%)
Data Table on South America - Year-over-year growth 2025-2030 (%)
Chart on Regional Comparison - South America
Data Table on Regional Comparison - South America

12.6.1 Brazil - Market size and forecast 2025-2030

Chart on Brazil - Market size and forecast 2025-2030 ($ million)
Data Table on Brazil - Market size and forecast 2025-2030 ($ million)
Chart on Brazil - Year-over-year growth 2025-2030 (%)
Data Table on Brazil - Year-over-year growth 2025-2030 (%)

12.6.2 Argentina - Market size and forecast 2025-2030

Chart on Argentina - Market size and forecast 2025-2030 ($ million)
Data Table on Argentina - Market size and forecast 2025-2030 ($ million)
Chart on Argentina - Year-over-year growth 2025-2030 (%)
Data Table on Argentina - Year-over-year growth 2025-2030 (%)

12.6.3 Chile - Market size and forecast 2025-2030

Chart on Chile - Market size and forecast 2025-2030 ($ million)
Data Table on Chile - Market size and forecast 2025-2030 ($ million)
Chart on Chile - Year-over-year growth 2025-2030 (%)
Data Table on Chile - Year-over-year growth 2025-2030 (%)

12.7 Middle East and Africa - Market size and forecast 2025-2030

Chart on Middle East and Africa - Market size and forecast 2025-2030 ($ million)
Data Table on Middle East and Africa - Market size and forecast 2025-2030 ($ million)
Chart on Middle East and Africa - Year-over-year growth 2025-2030 (%)
Data Table on Middle East and Africa - Year-over-year growth 2025-2030 (%)
Chart on Regional Comparison - Middle East and Africa
Data Table on Regional Comparison - Middle East and Africa

12.7.1 Saudi Arabia - Market size and forecast 2025-2030

Chart on Saudi Arabia - Market size and forecast 2025-2030 ($ million)
Data Table on Saudi Arabia - Market size and forecast 2025-2030 ($ million)
Chart on Saudi Arabia - Year-over-year growth 2025-2030 (%)
Data Table on Saudi Arabia - Year-over-year growth 2025-2030 (%)

12.7.2 UAE - Market size and forecast 2025-2030

Chart on UAE - Market size and forecast 2025-2030 ($ million)
Data Table on UAE - Market size and forecast 2025-2030 ($ million)
Chart on UAE - Year-over-year growth 2025-2030 (%)
Data Table on UAE - Year-over-year growth 2025-2030 (%)

12.7.3 South Africa - Market size and forecast 2025-2030

Chart on South Africa - Market size and forecast 2025-2030 ($ million)
Data Table on South Africa - Market size and forecast 2025-2030 ($ million)
Chart on South Africa - Year-over-year growth 2025-2030 (%)
Data Table on South Africa - Year-over-year growth 2025-2030 (%)

12.7.4 Israel - Market size and forecast 2025-2030

Chart on Israel - Market size and forecast 2025-2030 ($ million)
Data Table on Israel - Market size and forecast 2025-2030 ($ million)
Chart on Israel - Year-over-year growth 2025-2030 (%)
Data Table on Israel - Year-over-year growth 2025-2030 (%)

12.7.5 Turkey - Market size and forecast 2025-2030

Chart on Turkey - Market size and forecast 2025-2030 ($ million)
Data Table on Turkey - Market size and forecast 2025-2030 ($ million)
Chart on Turkey - Year-over-year growth 2025-2030 (%)
Data Table on Turkey - Year-over-year growth 2025-2030 (%)

12.8 Market opportunity by geography

Market opportunity by geography ($ million)
Data Tables on Market opportunity by geography ($ million)

13. Drivers, Challenges, and Opportunity

13.1 Market drivers

Expanding vehicle populations and replacement cycles
Accelerated adoption of electric vehicle platforms
Proliferation of doorstep mobile installation networks

13.2 Market challenges

Fitment friction and customer sizing errors
Last mile logistics and heavy-freight overhead
Service bay coordination and franchise conflicts

13.3 Impact of drivers and challenges

Impact of drivers and challenges in 2025 and 2030

13.4 Market opportunities

Integration of AI selection tools
Expansion of omni-channel online-to-offline ecosystems
Rise of subscription-based fleet maintenance models

14. Competitive Landscape

14.1 Overview

14.2

Overview on criticality of inputs and factors of differentiation

14.3 Landscape disruption

Overview on factors of disruption

14.4 Industry risks

Impact of key risks on business

15. Competitive Analysis

15.1 Companies profiled

Companies covered

15.2 Company ranking index

15.3 Market positioning of companies

Matrix on companies position and classification

15.4 Apollo Tyres Ltd.

Apollo Tyres Ltd. - Overview
Apollo Tyres Ltd. - Product / Service
Apollo Tyres Ltd. - Key news
Apollo Tyres Ltd. - Key offerings
SWOT

15.5 Balkrishna Industries Ltd.

Balkrishna Industries Ltd. - Overview
Balkrishna Industries Ltd. - Product / Service
Balkrishna Industries Ltd. - Key offerings
SWOT

15.6 Bridgestone Corp.

Bridgestone Corp. - Overview
Bridgestone Corp. - Business segments
Bridgestone Corp. - Key offerings
Bridgestone Corp. - Segment focus
SWOT

15.7 Goodyear Tire and Rubber Co.

Goodyear Tire and Rubber Co. - Overview
Goodyear Tire and Rubber Co. - Business segments
Goodyear Tire and Rubber Co. - Key offerings
Goodyear Tire and Rubber Co. - Segment focus
SWOT

15.8 Hankook Tire and Technology Co.

Hankook Tire and Technology Co. - Overview
Hankook Tire and Technology Co. - Business segments
Hankook Tire and Technology Co. - Key news
Hankook Tire and Technology Co. - Key offerings
Hankook Tire and Technology Co. - Segment focus
SWOT

15.9 Kumho Tire Co. Inc.

Kumho Tire Co. Inc. - Overview
Kumho Tire Co. Inc. - Product / Service
Kumho Tire Co. Inc. - Key offerings
SWOT

15.10 Michelin

Michelin - Overview
Michelin - Business segments
Michelin - Key offerings
Michelin - Segment focus
SWOT

15.11 MRF Ltd.

MRF Ltd. - Overview
MRF Ltd. - Product / Service
MRF Ltd. - Key offerings
SWOT

15.12 Pirelli and C. S.p.A.

Pirelli and C. S.p.A. - Overview
Pirelli and C. S.p.A. - Product / Service
Pirelli and C. S.p.A. - Key offerings
SWOT

15.13 Sailun Group

Sailun Group - Overview
Sailun Group - Product / Service
Sailun Group - Key offerings
SWOT

15.14 Shandong Linglong Tire Co. Ltd.

Shandong Linglong Tire Co. Ltd. - Overview
Shandong Linglong Tire Co. Ltd. - Product / Service
Shandong Linglong Tire Co. Ltd. - Key offerings
SWOT

15.15 Sumitomo Rubber Industries Ltd.

Sumitomo Rubber Industries Ltd. - Overview
Sumitomo Rubber Industries Ltd. - Business segments
Sumitomo Rubber Industries Ltd. - Key offerings
Sumitomo Rubber Industries Ltd. - Segment focus
SWOT

15.16 Toyo Tire Corp.

Toyo Tire Corp. - Overview
Toyo Tire Corp. - Product / Service
Toyo Tire Corp. - Key offerings
SWOT

15.17 Yokohama Rubber Co. Ltd.

Yokohama Rubber Co. Ltd. - Overview
Yokohama Rubber Co. Ltd. - Business segments
Yokohama Rubber Co. Ltd. - Key offerings
Yokohama Rubber Co. Ltd. - Segment focus
SWOT

15.18 Zhongce Rubber Group Co. Ltd.

Zhongce Rubber Group Co. Ltd. - Overview
Zhongce Rubber Group Co. Ltd. - Product / Service
Zhongce Rubber Group Co. Ltd. - Key offerings
SWOT

16. Appendix

16.1 Scope of the report

Market definition
Objectives
Notes and caveats

16.2 Inclusions and exclusions checklist

Inclusions checklist
Exclusions checklist

16.3 Currency conversion rates for US$

16.4 Research methodology

16.5 Data procurement

Information sources

16.6 Data validation

16.7 Validation techniques employed for market sizing

16.8 Data synthesis

16.9 360 degree market analysis

16.10 List of abbreviations

Research Methodology

Technavio presents a detailed picture of the market by way of study, synthesis, and summation of data from multiple sources. The analysts have presented the various facets of the market with a particular focus on identifying the key industry influencers. The data thus presented is comprehensive, reliable, and the result of extensive research, both primary and secondary.

INFORMATION SOURCES

Primary sources

  • Manufacturers and suppliers
  • Channel partners
  • Industry experts
  • Strategic decision makers

Secondary sources

  • Industry journals and periodicals
  • Government data
  • Financial reports of key industry players
  • Historical data
  • Press releases

DATA ANALYSIS

Data Synthesis

  • Collation of data
  • Estimation of key figures
  • Analysis of derived insights

Data Validation

  • Triangulation with data models
  • Reference against proprietary databases
  • Corroboration with industry experts

REPORT WRITING

Qualitative

  • Market drivers
  • Market challenges
  • Market trends
  • Five forces analysis

Quantitative

  • Market size and forecast
  • Market segmentation
  • Geographical insights
  • Competitive landscape

Interested in this report?

Get your sample now to see our research methodology and insights!

Download Now

Frequently Asked Questions

Automotive Tires E-Retailing market growth will increase by USD 20056.6 million during 2026-2030.

The Automotive Tires E-Retailing market is expected to grow at a CAGR of 17.8% during 2026-2030.

Automotive Tires E-Retailing market is segmented by Type (Radial tire, Base tire) Application (Passenger cars, Light commercial vehicles, Heavy commercial vehicles) Product type (All-season tires, Summer tires, Winter tires, Others)

Apollo Tyres Ltd., Balkrishna Industries Ltd., Bridgestone Corp., CEAT Ltd., Giti Tire Pte. Ltd., Goodyear Tire and Rubber Co., Hankook Tire and Technology Co., JK Tyre and Industries Ltd., Kumho Tire Co. Inc., Maxxis International, Michelin, MRF Ltd., Nexen Tire Corp., Pirelli and C. S.p.A., Sailun Group, Shandong Linglong Tire Co. Ltd., Sumitomo Rubber Industries Ltd., Toyo Tire Corp., Yokohama Rubber Co. Ltd., Zhongce Rubber Group Co. Ltd. are a few of the key vendors in the Automotive Tires E-Retailing market.

North America will register the highest growth rate of 39.2% among the other regions. Therefore, the Automotive Tires E-Retailing market in North America is expected to garner significant business opportunities for the vendors during the forecast period.

US, Canada, Mexico, Germany, UK, France, Italy, Spain, The Netherlands, China, Japan, India, South Korea, Australia, Indonesia, Brazil, Argentina, Chile, Saudi Arabia, UAE, South Africa, Israel, Turkey

  • Expanding vehicle populations and replacement cycles is the driving factor this market.

The Automotive Tires E-Retailing market vendors should focus on grabbing business opportunities from the Type segment as it accounted for the largest market share in the base year.
RIA - Research AI Assistant
Ask RIA