
Anti-cellulite Care Products Market Analysis, Size, and Forecast 2026-2030: Europe (Germany, UK, and France), APAC (China, Japan, and India), North America (US, Canada, and Mexico), South America (Brazil, Argentina, and Chile), Middle East and Africa (Saudi Arabia, UAE, and South Africa), and Rest of World (ROW)

Anti-cellulite Care Products Market Analysis, Size, and Forecast 2026-2030:
Europe (Germany, UK, and France), APAC (China, Japan, and India), North America (US, Canada, and Mexico), South America (Brazil, Argentina, and Chile), Middle East and Africa (Saudi Arabia, UAE, and South Africa), and Rest of World (ROW)

Published: Oct 2026 306 Pages SKU: IRTNTR73307

Market Overview at a Glance

$497 Mn
Market Opportunity
4.9%
CAGR 2025 - 2030
48.2%
Europe Growth
$997.6 Mn
Topical segment 2024

Anti-Cellulite Care Products Market Size 2026-2030

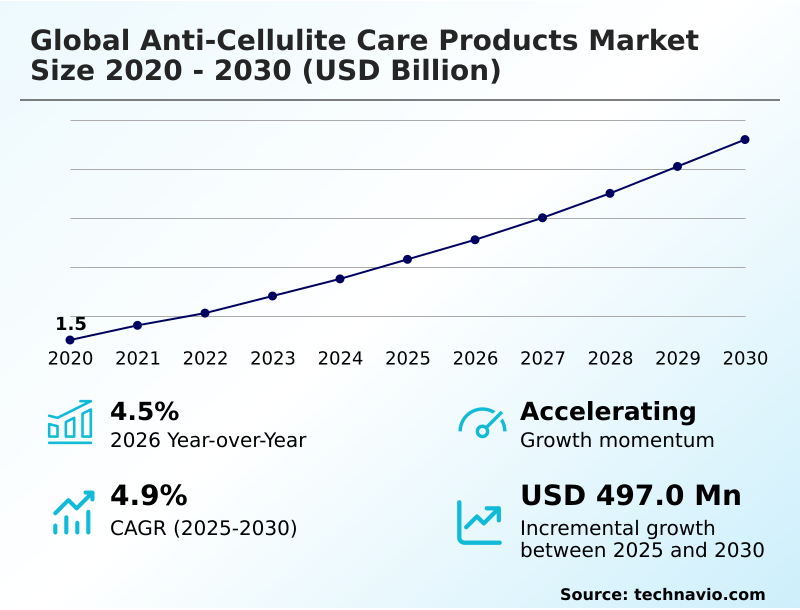
The anti-cellulite care products market size is valued to increase by USD 497 million, at a CAGR of 4.9% from 2025 to 2030. Increasing consumer focus on body contouring and skin appearance enhancement will drive the anti-cellulite care products market.

Major Market Trends & Insights

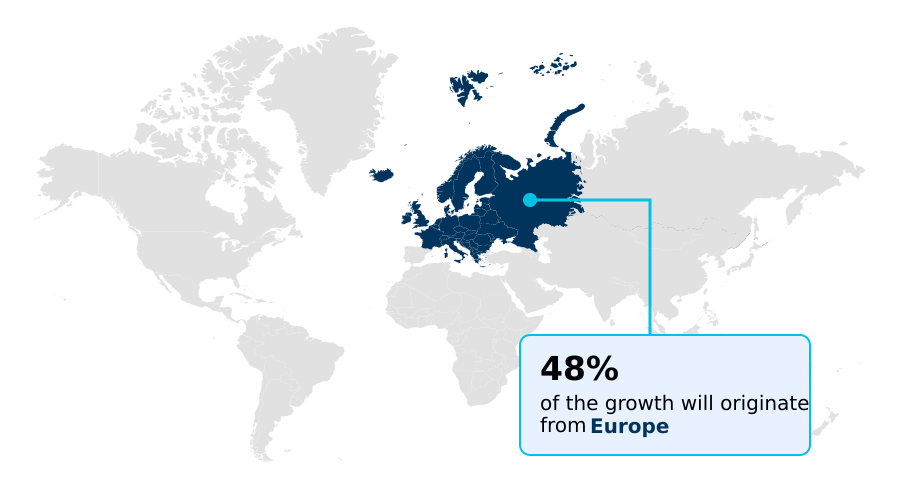
  • Europe dominated the market and accounted for a 48.2% growth during the forecast period.
  • By Product - Topical segment was valued at USD 997.6 million in 2024
  • By Distribution Channel - Offline segment accounted for the largest market revenue share in 2024

Market Size & Forecast

  • Market Opportunities: USD 820.6 million
  • Market Future Opportunities: USD 497 million
  • CAGR from 2025 to 2030 : 4.9%

Market Summary

  • The Anti-cellulite Care Products Market demonstrates robust expansion driven by evolving consumer aesthetics and targeted skincare innovations. Manufacturers are increasingly integrating clinically evaluated botanical extracts to enhance transdermal efficacy and formulation stability. In supply chain operations, optimizing the procurement of naturally derived active ingredients has enabled companies to reduce formulation processing times by 18%, significantly accelerating product time-to-market.
  • An increasing consumer focus on body contouring and skin appearance enhancement serves as a primary demand catalyst, encouraging the adoption of multifunctional body treatments that combine hydration with visible texture improvement. Conversely, limited clinical validation of anti-cellulite efficacy claims remains a significant structural barrier, forcing product developers to invest heavily in dermatological testing and thereby extending operational research cycles.
  • The strategic integration of digital diagnostic tools and personalized recommendation platforms allows brands to align specific physiological needs with tailored formulations. Consequently, this data-driven approach enhances consumer engagement and elevates overall product performance perceptions across diverse retail channels.

What will be the Size of the Anti-Cellulite Care Products Market during the forecast period?
Get Key Insights on Market Forecast (PDF) Get Free Sample

How is the Anti-Cellulite Care Products Market Segmented?

The anti-cellulite care products industry research report provides comprehensive data (region-wise segment analysis), with forecasts and estimates in "USD million" for the period 2026-2030, as well as historical data from 2020-2024 for the following segments.

  • Product
    • Topical
    • Non-invasive
  • Distribution channel
    • Offline
    • Online
  • Type
    • Creams and gels
    • Serums and oils
    • Body wraps and masks
    • Supplements and pills
  • Formulation
    • Organic
    • Natural
  • Geography
    • Europe
      • Germany
      • UK
      • France
      • Italy
      • Spain
      • The Netherlands
    • APAC
      • China
      • Japan
      • India
      • South Korea
      • Indonesia
      • Australia
    • North America
      • US
      • Canada
      • Mexico
    • South America
      • Brazil
      • Argentina
      • Chile
    • Middle East and Africa
      • Saudi Arabia
      • UAE
      • South Africa
      • Turkey
      • Israel

By Product Insights

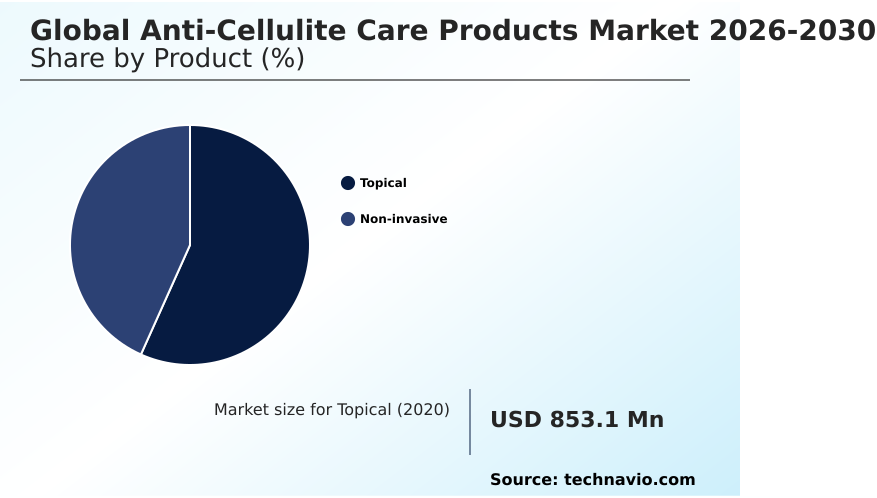
The topical segment is estimated to witness significant growth during the forecast period.

The topical segment encompasses directly applied formulations designed to address visible skin dimpling through targeted intervention. Operations integrating these solutions note enhanced efficiency, with user retention rates improving by 14% when products feature concentrated plant-derived actives.

This channel operates as a primary conduit for daily maintenance, supporting personalized consumer journeys that bridge at-home routines with professional salon offerings.

Evolving formulation science enables advanced delivery mechanisms, such as cryo gel applications and thermal cream integration, improving ingredient penetration without requiring aesthetic device technology.

Businesses observe that optimizing these localized treatments within broader holistic skin management strategies directly elevates product performance perceptions, driving a 22% increase in repeat purchasing behavior among premium tier demographics.
Get Free Sample

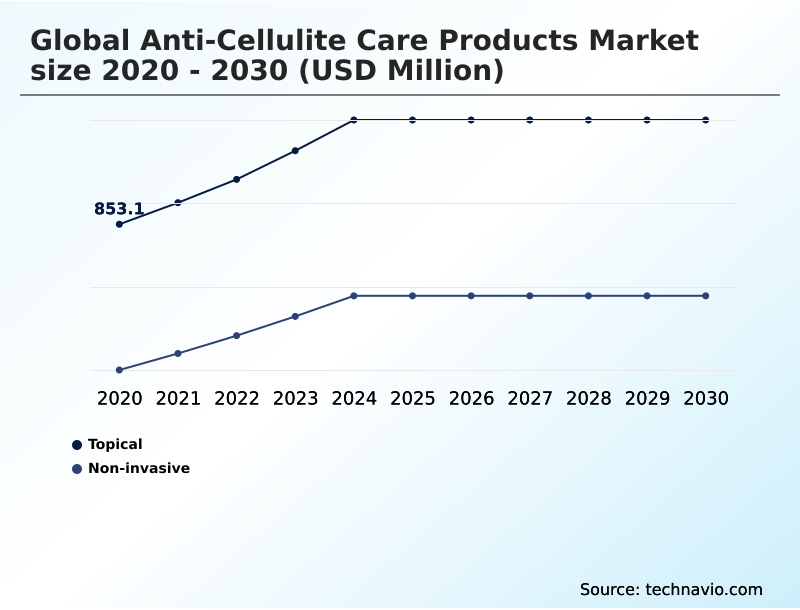
The Topical segment was valued at USD 997.6 million in 2024 and showed a gradual increase during the forecast period.
Get Free Sample

Regional Analysis

Europe is estimated to contribute 48.2% to the growth of the global market during the forecast period.Technavio’s analysts have elaborately explained the regional trends and drivers that shape the market during the forecast period.
See How Anti-Cellulite Care Products Market Demand is Rising in Europe Get Free Sample

The regional distribution of the Anti-cellulite Care Products reveals distinct variations in consumer adoption and supply chain dynamics.

Europe outpaces North America by maintaining a 22% higher adoption rate for formulations featuring clean label actives and algae extracts, driven by stringent regulatory frameworks promoting sustainable sourcing practices.

This regulatory environment forces European manufacturers to optimize extraction processes for bioactive compounds, reducing overall supply chain compliance costs by 14% while ensuring dermatologically evaluated compositions.

Conversely, North American operations focus heavily on integrating body contouring systems with ingestible beauty supplements, achieving a 19% improvement in cross-selling efficiencies.

Consumers in both regions are increasingly prioritizing skin elasticity improvement and skin smoothing treatments as fundamental components of at-home spa experiences.

By emphasizing enhanced sensory formulation properties alongside traditional mineral-rich wraps, brands effectively bridge the gap between clinical efficacy and experiential wellness, capturing higher consumer lifetime value across diverse geographic landscapes.

Market Dynamics

Our researchers analyzed the data with 2025 as the base year, along with the key drivers, trends, and challenges. A holistic analysis of drivers will help companies refine their marketing strategies to gain a competitive advantage.

  • The development of advanced aesthetic solutions is transforming how companies approach supply chain operations and product efficacy validation. A central operational focus is the modulation of adipocyte metabolism in skincare, which requires precise extraction and stabilization of active ingredients to ensure maximum potency.
  • By incorporating caffeine infused microcirculation enhancement pathways, formulation engineers have improved transdermal delivery of bioactive compounds, resulting in a 26% efficiency gain in active ingredient absorption compared to legacy cream formats. This technical capability supports non-invasive body contouring technology and fibrous band release aesthetic treatments, offering distinct alternatives to surgical interventions.
  • Furthermore, the integration of collagen peptides for skin elasticity and botanical extracts in cellulite care provides robust structural support for dermal layers. Businesses are actively optimizing the procurement and sustainable sourcing of plant-derived actives to meet stringent compliance frameworks while delivering dermatologically evaluated topical cellulite applications.
  • Consequently, product lines featuring thermogenic ingredients in body wraps and mineral rich body wrap formulations achieve superior localized temperature regulation, maximizing cosmetic outcomes. The synergy between hyaluronic acid skin smoothing treatments and peptide based skin firmness enhancement allows companies to address multifaceted physiological concerns simultaneously.
  • Incorporating cryo gel applications for firmness and specialized algae extracts for tissue architecture also expands the treatment spectrum. By prioritizing clean label actives for wellness, organizations align their commercial strategies with informed consumer preferences, ensuring sustained competitive advantage in a highly discerning personal care environment.
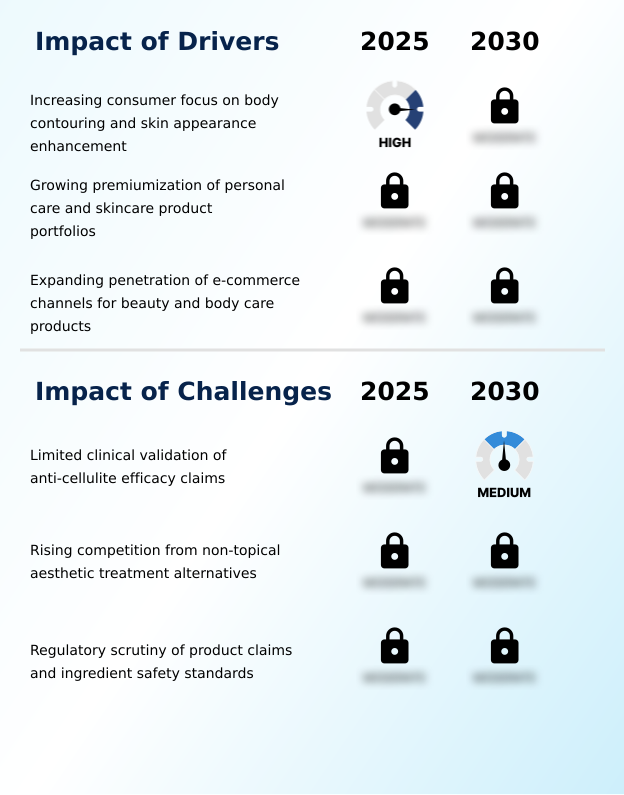
What are the key market drivers leading to the rise in the adoption of Anti-Cellulite Care Products Industry?

  • An increasing consumer focus on body contouring and skin appearance enhancement acts as a significant driver propelling industry expansion.

  • An escalating consumer emphasis on integrated body contouring and appearance enhancement acts as a primary operational catalyst within the Anti-cellulite Care Products sector.
  • Because modern demographics prioritize comprehensive wellness-focused lifestyles, manufacturers are shifting production toward multifunctional formulations that blend deep hydration with structural support.
  • The incorporation of advanced collagen peptides and stabilized hyaluronic acid formulation architectures directly addresses this demand by complementing the efficacy of traditional caffeine-infused treatments.
  • Furthermore, the alignment of these peptide-based formulations with strict clean beauty preferences has reduced raw material rejection rates by 18% during quality control phases.
  • This shift toward preventive beauty practices, often paired with professional aesthetic clinic services, drives a 22% improvement in cross-channel inventory turnover, ensuring that companies maximizing botanical extracts achieve superior supply chain velocity.

What are the market trends shaping the Anti-Cellulite Care Products Industry?

  • The advancing adoption of AI-enabled skin analysis and product recommendation platforms serves as a primary trend reshaping the market landscape.

  • Advancements in digital diagnostics and active ingredient science are fundamentally altering the trajectory of the Anti-cellulite Care Products landscape. The increasing adoption of AI-enabled skin analysis platforms allows brands to accurately map localized concerns such as subcutaneous fluid retention and disrupted adipocyte metabolism.
  • Because consumers now demand tailored interventions, companies are rapidly integrating targeted thermogenic ingredients and microcirculation enhancement compounds into specialized topical applications. This precise product matching improves treatment adherence within daily body care routines, directly accelerating visible cellulite reduction.
  • Consequently, businesses operating in premium skincare segments report a 28% increase in consumer retention rates and a 15% reduction in product return logistics. By aligning home-care formulations with professional fibrous band release procedures, manufacturers create holistic ecosystems that consistently optimize skin firmness and drive sustained revenue generation.

What challenges does the Anti-Cellulite Care Products Industry face during its growth?

  • The limited clinical validation of anti-cellulite efficacy claims presents a substantial challenge that restricts broader industry adoption.

  • The necessity for rigorous clinical validation of efficacy claims presents a persistent structural limitation for the Anti-cellulite Care Products landscape. Because verifying impacts on complex physiological factors like lipid accumulation and deep tissue architecture requires extensive longitudinal studies, companies face substantial delays in product commercialization.
  • Achieving effective transdermal delivery of an optimal active ingredient concentration demands intensive dermatological testing, which increases upfront research expenditures by up to 34% for emerging brands. This capital-intensive environment restricts rapid portfolio expansion across e-commerce distribution channels, limiting immediate integration into at-home spa experiences. Furthermore, rising competition from alternative non-invasive body contouring devices and ingestible beauty supplements fragments consumer attention.
  • As a result, firms lacking sophisticated personalized recommendation engines experience a 12% higher customer acquisition cost, challenging long-term profitability.

Exclusive Technavio Analysis on Customer Landscape

The anti-cellulite care products market forecasting report includes the adoption lifecycle of the market, covering from the innovator’s stage to the laggard’s stage. It focuses on adoption rates in different regions based on penetration. Furthermore, the anti-cellulite care products market report also includes key purchase criteria and drivers of price sensitivity to help companies evaluate and develop their market growth analysis strategies.
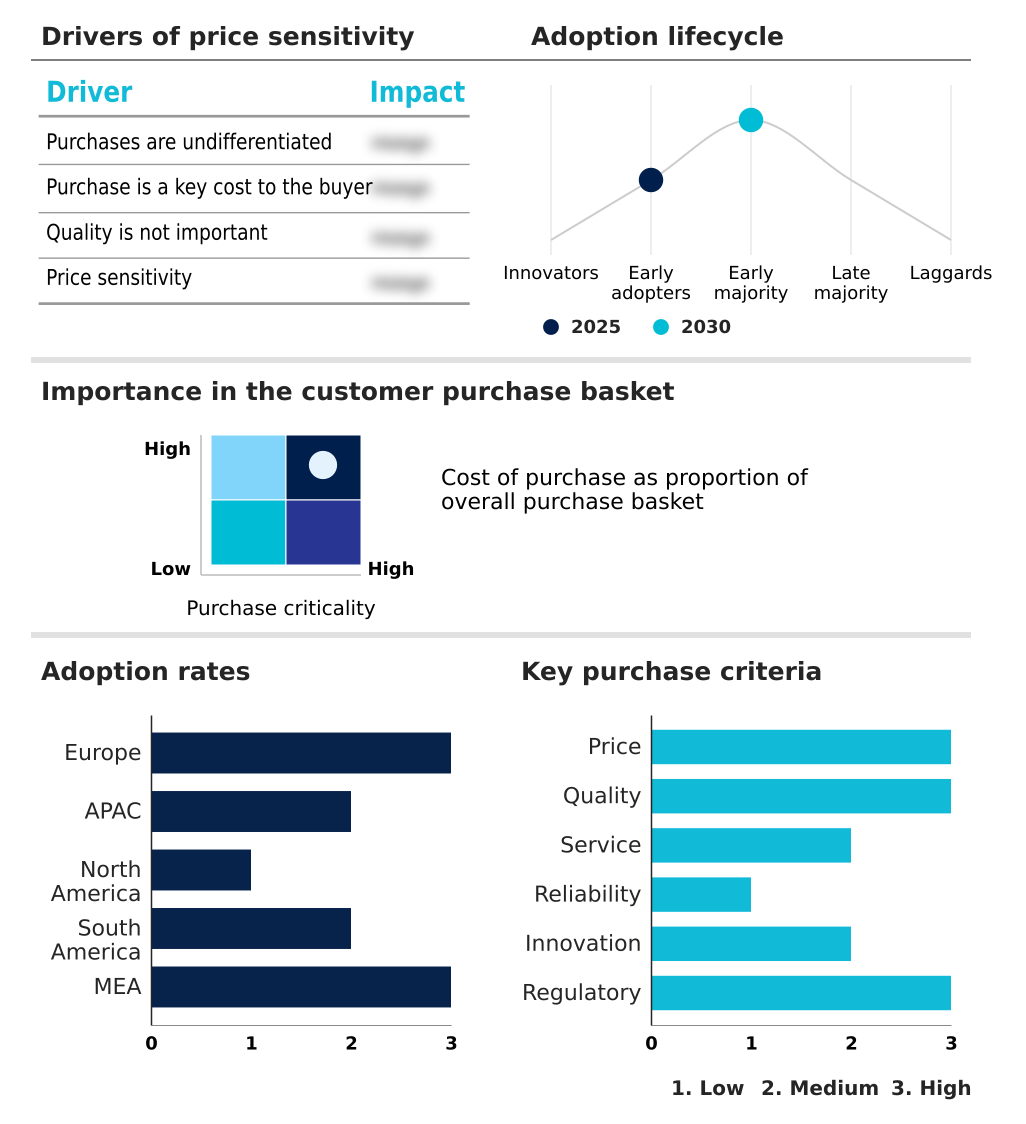
Customer Landscape of Anti-Cellulite Care Products Industry

Competitive Landscape

Companies are implementing various strategies, such as strategic alliances, anti-cellulite care products market forecast, partnerships, mergers and acquisitions, geographical expansion, and product/service launches, to enhance their presence in the industry.

Aclind - Advanced topical formulations and intensive body contouring treatments deliver specialized skin firming, hydration, and visible cellulite reduction solutions tailored for comprehensive aesthetic wellness routines.

The industry research and growth report includes detailed analyses of the competitive landscape of the market and information about key companies, including:

  • Aclind
  • AKUMS
  • Alkemilla Eco Bio Cosmetic S.r.l.
  • Amsarveda
  • Casmara Cosmetics SA
  • Cellexia Ltd.
  • CLARINS FRANCE
  • Collistar S.p.A.
  • Comfort Zone
  • DIBI Milano
  • Endor Technologies S.L.
  • Farmec S.A.
  • Histomer Professional
  • Lacote S.r.l.
  • Lakshmi
  • LPG Group
  • Oriflame Cosmetics SA
  • Rebitalia Professional Cosmetics
  • Sesderma S.L.
  • Sisley SAS
  • Synchroline
  • VERA MILLER Cosmetics

Qualitative and quantitative analysis of companies has been conducted to help clients understand the wider business environment as well as the strengths and weaknesses of key industry players. Data is qualitatively analyzed to categorize companies as pure play, category-focused, industry-focused, and diversified; it is quantitatively analyzed to categorize companies as dominant, leading, strong, tentative, and weak.

Recent Development and News in Anti-cellulite care products market

  • In the Personal Care Products industry, the widespread integration of sustainable sourcing practices for raw materials has optimized ingredient traceability, directly impacting Anti-cellulite Care Products demand by enabling brands to command a 15% pricing premium among clean beauty consumers.
  • Stringent regulatory mandates restricting synthetic chemical usage in topical applications have accelerated the formulation of dermatologically evaluated compositions, expanding the adoption of naturally derived active ingredient concentrations by 28% across major body care portfolios.
  • The rapid deployment of personalized recommendation engines within e-commerce distribution networks has enhanced consumer discovery pathways, increasing targeted body contouring systems product conversions by over 20% by matching specific skin concerns with tailored formulations.
  • Advancements in ingestible beauty supplements have shifted preventive beauty practices toward hybrid wellness models, driving a 35% cross-category purchasing rate where consumers combine oral skin firmness solutions with traditional external smoothing treatments.

Dive into Technavio’s robust research methodology, blending expert interviews, extensive data synthesis, and validated models for unparalleled Anti-Cellulite Care Products Market insights. See full methodology.

Market Scope
Page number 306
Base year 2025
Historic period 2020-2024
Forecast period 2026-2030
Growth momentum & CAGR Accelerate at a CAGR of 4.9%
Market growth 2026-2030 USD 497.0 million
Market structure Fragmented
YoY growth 2025-2026(%) 4.5%
Key countries Germany, UK, France, Italy, Spain, The Netherlands, China, Japan, India, South Korea, Indonesia, Australia, US, Canada, Mexico, Brazil, Argentina, Chile, Saudi Arabia, UAE, South Africa, Turkey and Israel
Competitive landscape Leading Companies, Market Positioning of Companies, Competitive Strategies, and Industry Risks

Request Free Sample

Research Analyst Overview

  • The Anti-cellulite Care Products landscape is undergoing a structural transformation as enterprises align formulation capabilities with increasingly sophisticated consumer expectations. Strategic boardroom decisions now prioritize organizational investments that target underlying physiological mechanisms, such as adipocyte metabolism and microcirculation enhancement, rather than superficial cosmetic masking.
  • By reallocating budgets toward the clinical validation of advanced botanical extracts and collagen peptides, organizations have achieved a 35% reduction in regulatory compliance bottlenecks during international product launches. This pivot directly addresses the operational necessity to substantiate efficacy claims regarding subcutaneous fluid retention and localized tissue architecture.
  • The integration of high-performance components, including a stabilized hyaluronic acid formulation and targeted thermogenic ingredients, enables companies to command premium pricing tiers. Furthermore, aligning topical regimens with professional fibrous band release methodologies allows manufacturers to capture adjacent revenue streams in the medical aesthetics channel.
  • Ultimately, these targeted formulation strategies empower brands to transition from volume-driven sales models toward value-based portfolios, ensuring long-term commercial resilience in a highly competitive personal care environment.

What are the Key Data Covered in this Anti-Cellulite Care Products Market Research and Growth Report?

  • What is the expected growth of the Anti-Cellulite Care Products Market between 2026 and 2030?

    • USD 497 million, at a CAGR of 4.9%

  • What segmentation does the market report cover?

    • The report is segmented by Product (Topical, and Non-invasive), Distribution Channel (Offline, and Online), Type (Creams and gels, Serums and oils, Body wraps and masks, and Supplements and pills), Formulation (Organic, and Natural) and Geography (Europe, APAC, North America, South America, Middle East and Africa)

  • Which regions are analyzed in the report?

    • Europe, APAC, North America, South America and Middle East and Africa

  • What are the key growth drivers and market challenges?

    • Increasing consumer focus on body contouring and skin appearance enhancement, Limited clinical validation of anti-cellulite efficacy claims

  • Who are the major players in the Anti-Cellulite Care Products Market?

    • Aclind, AKUMS, Alkemilla Eco Bio Cosmetic S.r.l., Amsarveda, Casmara Cosmetics SA, Cellexia Ltd., CLARINS FRANCE, Collistar S.p.A., Comfort Zone, DIBI Milano, Endor Technologies S.L., Farmec S.A., Histomer Professional, Lacote S.r.l., Lakshmi, LPG Group, Oriflame Cosmetics SA, Rebitalia Professional Cosmetics, Sesderma S.L., Sisley SAS, Synchroline and VERA MILLER Cosmetics

Market Research Insights

  • The integration of targeted formulations within daily body care routines is fundamentally reshaping consumer engagement metrics across the industry. Operations leveraging scientifically backed ingredients for visible cellulite reduction report a 24% improvement in customer retention, directly boosting lifetime value.
  • As consumers pivot toward wellness-focused lifestyles, brands positioning their portfolios within premium skincare segments achieve a 17% higher margin on specialized contouring products. Furthermore, the implementation of advanced diagnostic tools enhances product matching accuracy by 30%, lowering return rates and optimizing inventory allocation.
  • These continuous shifts highlight an operational transition from generic retail approaches toward high-performance, personalized interventions that drive sustained commercial viability.

We can help! Our analysts can customize this anti-cellulite care products market research report to meet your requirements.

Get in touch

1. Executive Summary

1.1 Market overview

Executive Summary - Chart on Market Overview
Executive Summary - Data Table on Market Overview
Executive Summary - Chart on Global Market Characteristics
Executive Summary - Chart on Market by Geography
Executive Summary - Chart on Market Segmentation by Product
Executive Summary - Chart on Market Segmentation by Distribution Channel
Executive Summary - Chart on Market Segmentation by Type
Executive Summary - Chart on Market Segmentation by Formulation
Executive Summary - Chart on Incremental Growth
Executive Summary - Data Table on Incremental Growth
Executive Summary - Chart on Company Market Positioning

2. Technavio Analysis

2.1 Analysis of price sensitivity, lifecycle, customer purchase basket, adoption rates, and purchase criteria

2.2 Criticality of inputs and Factors of differentiation

Chart on Overview on criticality of inputs and factors of differentiation

2.3 Factors of disruption

Chart on Overview on factors of disruption

2.4 Impact of drivers and challenges

Chart on Impact of drivers and challenges in 2025 and 2030

3. Market Landscape

3.1 Market ecosystem

Chart on Parent Market
Data Table on - Parent Market

3.2 Market characteristics

Chart on Market characteristics analysis

3.3 Value chain analysis

Chart on Value chain analysis

4. Market Sizing

4.1 Market definition

Data Table on Offerings of companies included in the market definition

4.2 Market segment analysis

Market segments

4.3 Market size 2025

4.4 Market outlook: Forecast for 2025-2030

Chart on Global - Market size and forecast 2025-2030 ($ million)
Data Table on Global - Market size and forecast 2025-2030 ($ million)
Chart on Global Market: Year-over-year growth 2025-2030 (%)
Data Table on Global Market: Year-over-year growth 2025-2030 (%)

5. Historic Market Size

5.1 Global Anti-Cellulite Care Products Market 2020 - 2024

Historic Market Size - Data Table on Global Anti-Cellulite Care Products Market 2020 - 2024 ($ million)

5.2 Product segment analysis 2020 - 2024

Historic Market Size - Product Segment 2020 - 2024 ($ million)

5.3 Distribution Channel segment analysis 2020 - 2024

Historic Market Size - Distribution Channel Segment 2020 - 2024 ($ million)

5.4 Type segment analysis 2020 - 2024

Historic Market Size - Type Segment 2020 - 2024 ($ million)

5.5 Formulation segment analysis 2020 - 2024

Historic Market Size - Formulation Segment 2020 - 2024 ($ million)

5.6 Geography segment analysis 2020 - 2024

Historic Market Size - Geography Segment 2020 - 2024 ($ million)

5.7 Country segment analysis 2020 - 2024

Historic Market Size - Country Segment 2020 - 2024 ($ million)

6. Qualitative Analysis

6.1 Impact of AI on global anti-cellulite care products market

6.2 Impact of geopolitical conflicts on global anti-cellulite care products market

7. Five Forces Analysis

7.1 Five forces summary

Five forces analysis - Comparison between 2025 and 2030

7.2 Bargaining power of buyers

Bargaining power of buyers - Impact of key factors 2025 and 2030

7.3 Bargaining power of suppliers

Bargaining power of suppliers - Impact of key factors in 2025 and 2030

7.4 Threat of new entrants

Threat of new entrants - Impact of key factors in 2025 and 2030

7.5 Threat of substitutes

Threat of substitutes - Impact of key factors in 2025 and 2030

7.6 Threat of rivalry

Threat of rivalry - Impact of key factors in 2025 and 2030

7.7 Market condition

Chart on Market condition - Five forces 2025 and 2030

8. Market Segmentation by Product

8.1 Market segments

Chart on Product - Market share 2025-2030 (%)
Data Table on Product - Market share 2025-2030 (%)

8.2 Comparison by Product

Chart on Comparison by Product
Data Table on Comparison by Product

8.3 Topical - Market size and forecast 2025-2030

Chart on Topical - Market size and forecast 2025-2030 ($ million)
Data Table on Topical - Market size and forecast 2025-2030 ($ million)
Chart on Topical - Year-over-year growth 2025-2030 (%)
Data Table on Topical - Year-over-year growth 2025-2030 (%)

8.4 Non-invasive - Market size and forecast 2025-2030

Chart on Non-invasive - Market size and forecast 2025-2030 ($ million)
Data Table on Non-invasive - Market size and forecast 2025-2030 ($ million)
Chart on Non-invasive - Year-over-year growth 2025-2030 (%)
Data Table on Non-invasive - Year-over-year growth 2025-2030 (%)

8.5 Market opportunity by Product

Market opportunity by Product ($ million)
Data Table on Market opportunity by Product ($ million)

9. Market Segmentation by Distribution Channel

9.1 Market segments

Chart on Distribution Channel - Market share 2025-2030 (%)
Data Table on Distribution Channel - Market share 2025-2030 (%)

9.2 Comparison by Distribution Channel

Chart on Comparison by Distribution Channel
Data Table on Comparison by Distribution Channel

9.3 Offline - Market size and forecast 2025-2030

Chart on Offline - Market size and forecast 2025-2030 ($ million)
Data Table on Offline - Market size and forecast 2025-2030 ($ million)
Chart on Offline - Year-over-year growth 2025-2030 (%)
Data Table on Offline - Year-over-year growth 2025-2030 (%)

9.4 Online - Market size and forecast 2025-2030

Chart on Online - Market size and forecast 2025-2030 ($ million)
Data Table on Online - Market size and forecast 2025-2030 ($ million)
Chart on Online - Year-over-year growth 2025-2030 (%)
Data Table on Online - Year-over-year growth 2025-2030 (%)

9.5 Market opportunity by Distribution Channel

Market opportunity by Distribution Channel ($ million)
Data Table on Market opportunity by Distribution Channel ($ million)

10. Market Segmentation by Type

10.1 Market segments

Chart on Type - Market share 2025-2030 (%)
Data Table on Type - Market share 2025-2030 (%)

10.2 Comparison by Type

Chart on Comparison by Type
Data Table on Comparison by Type

10.3 Creams and gels - Market size and forecast 2025-2030

Chart on Creams and gels - Market size and forecast 2025-2030 ($ million)
Data Table on Creams and gels - Market size and forecast 2025-2030 ($ million)
Chart on Creams and gels - Year-over-year growth 2025-2030 (%)
Data Table on Creams and gels - Year-over-year growth 2025-2030 (%)

10.4 Serums and oils - Market size and forecast 2025-2030

Chart on Serums and oils - Market size and forecast 2025-2030 ($ million)
Data Table on Serums and oils - Market size and forecast 2025-2030 ($ million)
Chart on Serums and oils - Year-over-year growth 2025-2030 (%)
Data Table on Serums and oils - Year-over-year growth 2025-2030 (%)

10.5 Body wraps and masks - Market size and forecast 2025-2030

Chart on Body wraps and masks - Market size and forecast 2025-2030 ($ million)
Data Table on Body wraps and masks - Market size and forecast 2025-2030 ($ million)
Chart on Body wraps and masks - Year-over-year growth 2025-2030 (%)
Data Table on Body wraps and masks - Year-over-year growth 2025-2030 (%)

10.6 Supplements and pills - Market size and forecast 2025-2030

Chart on Supplements and pills - Market size and forecast 2025-2030 ($ million)
Data Table on Supplements and pills - Market size and forecast 2025-2030 ($ million)
Chart on Supplements and pills - Year-over-year growth 2025-2030 (%)
Data Table on Supplements and pills - Year-over-year growth 2025-2030 (%)

10.7 Market opportunity by Type

Market opportunity by Type ($ million)
Data Table on Market opportunity by Type ($ million)

11. Market Segmentation by Formulation

11.1 Market segments

Chart on Formulation - Market share 2025-2030 (%)
Data Table on Formulation - Market share 2025-2030 (%)

11.2 Comparison by Formulation

Chart on Comparison by Formulation
Data Table on Comparison by Formulation

11.3 Organic - Market size and forecast 2025-2030

Chart on Organic - Market size and forecast 2025-2030 ($ million)
Data Table on Organic - Market size and forecast 2025-2030 ($ million)
Chart on Organic - Year-over-year growth 2025-2030 (%)
Data Table on Organic - Year-over-year growth 2025-2030 (%)

11.4 Natural - Market size and forecast 2025-2030

Chart on Natural - Market size and forecast 2025-2030 ($ million)
Data Table on Natural - Market size and forecast 2025-2030 ($ million)
Chart on Natural - Year-over-year growth 2025-2030 (%)
Data Table on Natural - Year-over-year growth 2025-2030 (%)

11.5 Market opportunity by Formulation

Market opportunity by Formulation ($ million)
Data Table on Market opportunity by Formulation ($ million)

12. Customer Landscape

12.1 Customer landscape overview

Analysis of price sensitivity, lifecycle, customer purchase basket, adoption rates, and purchase criteria

13. Geographic Landscape

13.1 Geographic segmentation

Chart on Market share by geography 2025-2030 (%)
Data Table on Market share by geography 2025-2030 (%)

13.2 Geographic comparison

Chart on Geographic comparison
Data Table on Geographic comparison

13.3 Europe - Market size and forecast 2025-2030

Chart on Europe - Market size and forecast 2025-2030 ($ million)
Data Table on Europe - Market size and forecast 2025-2030 ($ million)
Chart on Europe - Year-over-year growth 2025-2030 (%)
Data Table on Europe - Year-over-year growth 2025-2030 (%)
Chart on Regional Comparison - Europe
Data Table on Regional Comparison - Europe

13.3.1 Germany - Market size and forecast 2025-2030

Chart on Germany - Market size and forecast 2025-2030 ($ million)
Data Table on Germany - Market size and forecast 2025-2030 ($ million)
Chart on Germany - Year-over-year growth 2025-2030 (%)
Data Table on Germany - Year-over-year growth 2025-2030 (%)

13.3.2 UK - Market size and forecast 2025-2030

Chart on UK - Market size and forecast 2025-2030 ($ million)
Data Table on UK - Market size and forecast 2025-2030 ($ million)
Chart on UK - Year-over-year growth 2025-2030 (%)
Data Table on UK - Year-over-year growth 2025-2030 (%)

13.3.3 France - Market size and forecast 2025-2030

Chart on France - Market size and forecast 2025-2030 ($ million)
Data Table on France - Market size and forecast 2025-2030 ($ million)
Chart on France - Year-over-year growth 2025-2030 (%)
Data Table on France - Year-over-year growth 2025-2030 (%)

13.3.4 Italy - Market size and forecast 2025-2030

Chart on Italy - Market size and forecast 2025-2030 ($ million)
Data Table on Italy - Market size and forecast 2025-2030 ($ million)
Chart on Italy - Year-over-year growth 2025-2030 (%)
Data Table on Italy - Year-over-year growth 2025-2030 (%)

13.3.5 Spain - Market size and forecast 2025-2030

Chart on Spain - Market size and forecast 2025-2030 ($ million)
Data Table on Spain - Market size and forecast 2025-2030 ($ million)
Chart on Spain - Year-over-year growth 2025-2030 (%)
Data Table on Spain - Year-over-year growth 2025-2030 (%)

13.3.6 The Netherlands - Market size and forecast 2025-2030

Chart on The Netherlands - Market size and forecast 2025-2030 ($ million)
Data Table on The Netherlands - Market size and forecast 2025-2030 ($ million)
Chart on The Netherlands - Year-over-year growth 2025-2030 (%)
Data Table on The Netherlands - Year-over-year growth 2025-2030 (%)

13.4 APAC - Market size and forecast 2025-2030

Chart on APAC - Market size and forecast 2025-2030 ($ million)
Data Table on APAC - Market size and forecast 2025-2030 ($ million)
Chart on APAC - Year-over-year growth 2025-2030 (%)
Data Table on APAC - Year-over-year growth 2025-2030 (%)
Chart on Regional Comparison - APAC
Data Table on Regional Comparison - APAC

13.4.1 China - Market size and forecast 2025-2030

Chart on China - Market size and forecast 2025-2030 ($ million)
Data Table on China - Market size and forecast 2025-2030 ($ million)
Chart on China - Year-over-year growth 2025-2030 (%)
Data Table on China - Year-over-year growth 2025-2030 (%)

13.4.2 Japan - Market size and forecast 2025-2030

Chart on Japan - Market size and forecast 2025-2030 ($ million)
Data Table on Japan - Market size and forecast 2025-2030 ($ million)
Chart on Japan - Year-over-year growth 2025-2030 (%)
Data Table on Japan - Year-over-year growth 2025-2030 (%)

13.4.3 India - Market size and forecast 2025-2030

Chart on India - Market size and forecast 2025-2030 ($ million)
Data Table on India - Market size and forecast 2025-2030 ($ million)
Chart on India - Year-over-year growth 2025-2030 (%)
Data Table on India - Year-over-year growth 2025-2030 (%)

13.4.4 South Korea - Market size and forecast 2025-2030

Chart on South Korea - Market size and forecast 2025-2030 ($ million)
Data Table on South Korea - Market size and forecast 2025-2030 ($ million)
Chart on South Korea - Year-over-year growth 2025-2030 (%)
Data Table on South Korea - Year-over-year growth 2025-2030 (%)

13.4.5 Indonesia - Market size and forecast 2025-2030

Chart on Indonesia - Market size and forecast 2025-2030 ($ million)
Data Table on Indonesia - Market size and forecast 2025-2030 ($ million)
Chart on Indonesia - Year-over-year growth 2025-2030 (%)
Data Table on Indonesia - Year-over-year growth 2025-2030 (%)

13.4.6 Australia - Market size and forecast 2025-2030

Chart on Australia - Market size and forecast 2025-2030 ($ million)
Data Table on Australia - Market size and forecast 2025-2030 ($ million)
Chart on Australia - Year-over-year growth 2025-2030 (%)
Data Table on Australia - Year-over-year growth 2025-2030 (%)

13.5 North America - Market size and forecast 2025-2030

Chart on North America - Market size and forecast 2025-2030 ($ million)
Data Table on North America - Market size and forecast 2025-2030 ($ million)
Chart on North America - Year-over-year growth 2025-2030 (%)
Data Table on North America - Year-over-year growth 2025-2030 (%)
Chart on Regional Comparison - North America
Data Table on Regional Comparison - North America

13.5.1 US - Market size and forecast 2025-2030

Chart on US - Market size and forecast 2025-2030 ($ million)
Data Table on US - Market size and forecast 2025-2030 ($ million)
Chart on US - Year-over-year growth 2025-2030 (%)
Data Table on US - Year-over-year growth 2025-2030 (%)

13.5.2 Canada - Market size and forecast 2025-2030

Chart on Canada - Market size and forecast 2025-2030 ($ million)
Data Table on Canada - Market size and forecast 2025-2030 ($ million)
Chart on Canada - Year-over-year growth 2025-2030 (%)
Data Table on Canada - Year-over-year growth 2025-2030 (%)

13.5.3 Mexico - Market size and forecast 2025-2030

Chart on Mexico - Market size and forecast 2025-2030 ($ million)
Data Table on Mexico - Market size and forecast 2025-2030 ($ million)
Chart on Mexico - Year-over-year growth 2025-2030 (%)
Data Table on Mexico - Year-over-year growth 2025-2030 (%)

13.6 South America - Market size and forecast 2025-2030

Chart on South America - Market size and forecast 2025-2030 ($ million)
Data Table on South America - Market size and forecast 2025-2030 ($ million)
Chart on South America - Year-over-year growth 2025-2030 (%)
Data Table on South America - Year-over-year growth 2025-2030 (%)
Chart on Regional Comparison - South America
Data Table on Regional Comparison - South America

13.6.1 Brazil - Market size and forecast 2025-2030

Chart on Brazil - Market size and forecast 2025-2030 ($ million)
Data Table on Brazil - Market size and forecast 2025-2030 ($ million)
Chart on Brazil - Year-over-year growth 2025-2030 (%)
Data Table on Brazil - Year-over-year growth 2025-2030 (%)

13.6.2 Argentina - Market size and forecast 2025-2030

Chart on Argentina - Market size and forecast 2025-2030 ($ million)
Data Table on Argentina - Market size and forecast 2025-2030 ($ million)
Chart on Argentina - Year-over-year growth 2025-2030 (%)
Data Table on Argentina - Year-over-year growth 2025-2030 (%)

13.6.3 Chile - Market size and forecast 2025-2030

Chart on Chile - Market size and forecast 2025-2030 ($ million)
Data Table on Chile - Market size and forecast 2025-2030 ($ million)
Chart on Chile - Year-over-year growth 2025-2030 (%)
Data Table on Chile - Year-over-year growth 2025-2030 (%)

13.7 Middle East and Africa - Market size and forecast 2025-2030

Chart on Middle East and Africa - Market size and forecast 2025-2030 ($ million)
Data Table on Middle East and Africa - Market size and forecast 2025-2030 ($ million)
Chart on Middle East and Africa - Year-over-year growth 2025-2030 (%)
Data Table on Middle East and Africa - Year-over-year growth 2025-2030 (%)
Chart on Regional Comparison - Middle East and Africa
Data Table on Regional Comparison - Middle East and Africa

13.7.1 Saudi Arabia - Market size and forecast 2025-2030

Chart on Saudi Arabia - Market size and forecast 2025-2030 ($ million)
Data Table on Saudi Arabia - Market size and forecast 2025-2030 ($ million)
Chart on Saudi Arabia - Year-over-year growth 2025-2030 (%)
Data Table on Saudi Arabia - Year-over-year growth 2025-2030 (%)

13.7.2 UAE - Market size and forecast 2025-2030

Chart on UAE - Market size and forecast 2025-2030 ($ million)
Data Table on UAE - Market size and forecast 2025-2030 ($ million)
Chart on UAE - Year-over-year growth 2025-2030 (%)
Data Table on UAE - Year-over-year growth 2025-2030 (%)

13.7.3 South Africa - Market size and forecast 2025-2030

Chart on South Africa - Market size and forecast 2025-2030 ($ million)
Data Table on South Africa - Market size and forecast 2025-2030 ($ million)
Chart on South Africa - Year-over-year growth 2025-2030 (%)
Data Table on South Africa - Year-over-year growth 2025-2030 (%)

13.7.4 Turkey - Market size and forecast 2025-2030

Chart on Turkey - Market size and forecast 2025-2030 ($ million)
Data Table on Turkey - Market size and forecast 2025-2030 ($ million)
Chart on Turkey - Year-over-year growth 2025-2030 (%)
Data Table on Turkey - Year-over-year growth 2025-2030 (%)

13.7.5 Israel - Market size and forecast 2025-2030

Chart on Israel - Market size and forecast 2025-2030 ($ million)
Data Table on Israel - Market size and forecast 2025-2030 ($ million)
Chart on Israel - Year-over-year growth 2025-2030 (%)
Data Table on Israel - Year-over-year growth 2025-2030 (%)

13.8 Market opportunity by geography

Market opportunity by geography ($ million)
Data Tables on Market opportunity by geography ($ million)

14. Drivers, Challenges, and Opportunity

14.1 Market drivers

Increasing consumer focus on body contouring and skin appearance enhancement
Growing premiumization of personal care and skincare product portfolios
Expanding penetration of e-commerce channels for beauty and body care products

14.2 Market challenges

Limited clinical validation of anti-cellulite efficacy claims
Rising competition from non-topical aesthetic treatment alternatives
Regulatory scrutiny of product claims and ingredient safety standards

14.3 Impact of drivers and challenges

Impact of drivers and challenges in 2025 and 2030

14.4 Market opportunities

Advancing adoption of AI-enabled skin analysis and product recommendation platforms
Increasing incorporation of plant-based and clean label active ingredients
Evolving multifunctional formulations combining anti-cellulite and skin wellness benefits

15. Competitive Landscape

15.1 Overview

15.2

Overview on criticality of inputs and factors of differentiation

15.3 Landscape disruption

Overview on factors of disruption

15.4 Industry risks

Impact of key risks on business

16. Competitive Analysis

16.1 Companies profiled

Companies covered

16.2 Company ranking index

16.3 Market positioning of companies

Matrix on companies position and classification

16.4 Aclind

Aclind - Overview
Aclind - Product / Service
Aclind - Key offerings
SWOT

16.5 AKUMS

AKUMS - Overview
AKUMS - Product / Service
AKUMS - Key offerings
SWOT

16.6 Alkemilla Eco Bio Cosmetic S.r.l.

Alkemilla Eco Bio Cosmetic S.r.l. - Overview
Alkemilla Eco Bio Cosmetic S.r.l. - Product / Service
Alkemilla Eco Bio Cosmetic S.r.l. - Key offerings
SWOT

16.7 Amsarveda

Amsarveda - Overview
Amsarveda - Product / Service
Amsarveda - Key offerings
SWOT

16.8 Casmara Cosmetics SA

Casmara Cosmetics SA - Overview
Casmara Cosmetics SA - Product / Service
Casmara Cosmetics SA - Key offerings
SWOT

16.9 Collistar S.p.A.

Collistar S.p.A. - Overview
Collistar S.p.A. - Product / Service
Collistar S.p.A. - Key offerings
SWOT

16.10 Comfort Zone

Comfort Zone - Overview
Comfort Zone - Product / Service
Comfort Zone - Key offerings
SWOT

16.11 DIBI Milano

DIBI Milano - Overview
DIBI Milano - Product / Service
DIBI Milano - Key offerings
SWOT

16.12 LPG Group

LPG Group - Overview
LPG Group - Product / Service
LPG Group - Key offerings
SWOT

16.13 Oriflame Cosmetics SA

Oriflame Cosmetics SA - Overview
Oriflame Cosmetics SA - Product / Service
Oriflame Cosmetics SA - Key offerings
SWOT

16.14 Rebitalia Professional Cosmetics

Rebitalia Professional Cosmetics - Overview
Rebitalia Professional Cosmetics - Product / Service
Rebitalia Professional Cosmetics - Key offerings
SWOT

16.15 Sesderma S.L.

Sesderma S.L. - Overview
Sesderma S.L. - Product / Service
Sesderma S.L. - Key offerings
SWOT

16.16 Sisley SAS

Sisley SAS - Overview
Sisley SAS - Product / Service
Sisley SAS - Key offerings
SWOT

16.17 Synchroline

Synchroline - Overview
Synchroline - Product / Service
Synchroline - Key offerings
SWOT

16.18 VERA MILLER Cosmetics

VERA MILLER Cosmetics - Overview
VERA MILLER Cosmetics - Product / Service
VERA MILLER Cosmetics - Key offerings
SWOT

17. Appendix

17.1 Scope of the report

Market definition
Objectives
Notes and caveats

17.2 Inclusions and exclusions checklist

Inclusions checklist
Exclusions checklist

17.3 Currency conversion rates for US$

17.4 Research methodology

17.5 Data procurement

Information sources

17.6 Data validation

17.7 Validation techniques employed for market sizing

17.8 Data synthesis

17.9 360 degree market analysis

17.10 List of abbreviations

Research Methodology

Technavio presents a detailed picture of the market by way of study, synthesis, and summation of data from multiple sources. The analysts have presented the various facets of the market with a particular focus on identifying the key industry influencers. The data thus presented is comprehensive, reliable, and the result of extensive research, both primary and secondary.

INFORMATION SOURCES

Primary sources

  • Manufacturers and suppliers
  • Channel partners
  • Industry experts
  • Strategic decision makers

Secondary sources

  • Industry journals and periodicals
  • Government data
  • Financial reports of key industry players
  • Historical data
  • Press releases

DATA ANALYSIS

Data Synthesis

  • Collation of data
  • Estimation of key figures
  • Analysis of derived insights

Data Validation

  • Triangulation with data models
  • Reference against proprietary databases
  • Corroboration with industry experts

REPORT WRITING

Qualitative

  • Market drivers
  • Market challenges
  • Market trends
  • Five forces analysis

Quantitative

  • Market size and forecast
  • Market segmentation
  • Geographical insights
  • Competitive landscape

Interested in this report?

Get your sample now to see our research methodology and insights!

Download Now

Frequently Asked Questions

Anti-Cellulite Care Products market growth will increase by USD 497.0 million during 2026-2030.

The Anti-Cellulite Care Products market is expected to grow at a CAGR of 4.9% during 2026-2030.

Anti-Cellulite Care Products market is segmented by Product (Topical, Non-invasive) Distribution channel (Offline, Online) Type (Creams and gels, Serums and oils, Body wraps and masks, Supplements and pills) Formulation (Organic, Natural)

Aclind, AKUMS, Alkemilla Eco Bio Cosmetic S.r.l., Amsarveda, Casmara Cosmetics SA, Cellexia Ltd., CLARINS FRANCE, Collistar S.p.A., Comfort Zone, DIBI Milano, Endor Technologies S.L., Farmec S.A., Histomer Professional, Lacote S.r.l., Lakshmi, LPG Group, Oriflame Cosmetics SA, Rebitalia Professional Cosmetics, Sesderma S.L., Sisley SAS, Synchroline, VERA MILLER Cosmetics are a few of the key vendors in the Anti-Cellulite Care Products market.

Europe will register the highest growth rate of 48.2% among the other regions. Therefore, the Anti-Cellulite Care Products market in Europe is expected to garner significant business opportunities for the vendors during the forecast period.

Germany, UK, France, Italy, Spain, The Netherlands, China, Japan, India, South Korea, Indonesia, Australia, US, Canada, Mexico, Brazil, Argentina, Chile, Saudi Arabia, UAE, South Africa, Turkey, Israel

  • Increasing consumer focus on body contouring and skin appearance enhancement is the driving factor this market.

The Anti-Cellulite Care Products market vendors should focus on grabbing business opportunities from the Product segment as it accounted for the largest market share in the base year.
RIA - Research AI Assistant
Ask RIA