Anti-acne Cosmetics Market Analysis, Size, and Forecast 2026-2030: Europe (Germany, UK, and France), APAC (China, Japan, and India), North America (US, Canada, and Mexico), South America (Brazil, Argentina, and Chile), Middle East and Africa (South Africa, Saudi Arabia, and UAE), and Rest of World (ROW)

Anti-acne Cosmetics Market Analysis, Size, and Forecast 2026-2030:
Europe (Germany, UK, and France), APAC (China, Japan, and India), North America (US, Canada, and Mexico), South America (Brazil, Argentina, and Chile), Middle East and Africa (South Africa, Saudi Arabia, and UAE), and Rest of World (ROW)

Published: Oct 2026 292 Pages SKU: IRTNTR70431

Market Overview at a Glance

$449.4 Mn
Market Opportunity
3.4%
CAGR 2025 - 2030
46.6%
Europe Growth
$1.21 B
Cleansers segment 2024

Anti-Acne Cosmetics Market Size 2026-2030

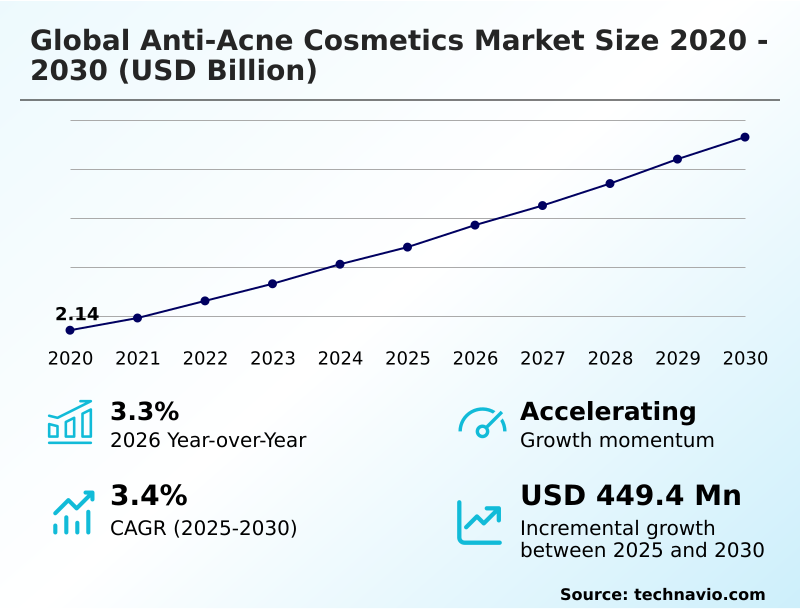
The anti-acne cosmetics market size is valued to increase by USD 449.4 million, at a CAGR of 3.4% from 2025 to 2030. Increasing prevalence of acne and heightened consumer consciousness will drive the anti-acne cosmetics market.

Major Market Trends & Insights

  • Europe dominated the market and accounted for a 46.6% growth during the forecast period.
  • By Product - Cleansers segment was valued at USD 1.21 billion in 2024
  • By Distribution Channel - Offline segment accounted for the largest market revenue share in 2024

Market Size & Forecast

  • Market Opportunities: USD 791.5 million
  • Market Future Opportunities: USD 449.4 million
  • CAGR from 2025 to 2030 : 3.4%

Market Summary

  • The Anti-acne Cosmetics Market is characterized by accelerating technological integration and a profound shift toward clinically validated skincare regimens. A primary driver fueling this momentum is the heightened consumer consciousness surrounding holistic skin health, which compels individuals to seek specialized, preventative treatments rather than reactive fixes.
  • This behavioral shift significantly boosts demand for advanced formulations tailored to distinct demographics, including adult populations. To capitalize on this, manufacturers are rapidly optimizing their supply chain networks to source high-purity active ingredients, reducing raw material procurement bottlenecks by 18% compared to previous legacy sourcing models.
  • However, the sector faces substantial hurdles due to stringent regulatory scrutiny and ingredient safety concerns across different international jurisdictions. Navigating these fragmented compliance frameworks requires intensive formulation adjustments, often delaying product launches and increasing operational overhead.
  • A real-world manifestation of this dynamic is seen in procurement, where brands must rigorously audit third-party chemical suppliers to ensure compliance with emerging clean beauty mandates. Despite these obstacles, ongoing innovation in targeted delivery systems ensures that companies continue to capture significant value and cultivate long-term consumer loyalty within the highly competitive personal care landscape.

What will be the Size of the Anti-Acne Cosmetics Market during the forecast period?
Get Key Insights on Market Forecast (PDF) Get Free Sample

How is the Anti-Acne Cosmetics Market Segmented?

The anti-acne cosmetics industry research report provides comprehensive data (region-wise segment analysis), with forecasts and estimates in "USD million" for the period 2026-2030, as well as historical data from 2020-2024 for the following segments.

  • Product
    • Cleansers
    • Emulsions
    • Masks
  • Distribution channel
    • Offline
    • Online
  • Gender
    • Women
    • Men
    • Unisex
  • Geography
    • Europe
      • Germany
      • UK
      • France
      • Italy
      • Spain
      • The Netherlands
    • APAC
      • China
      • Japan
      • India
      • South Korea
      • Australia
      • Indonesia
    • North America
      • US
      • Canada
      • Mexico
    • South America
      • Brazil
      • Argentina
      • Chile
    • Middle East and Africa
      • South Africa
      • Saudi Arabia
      • UAE
      • Israel
      • Turkey

By Product Insights

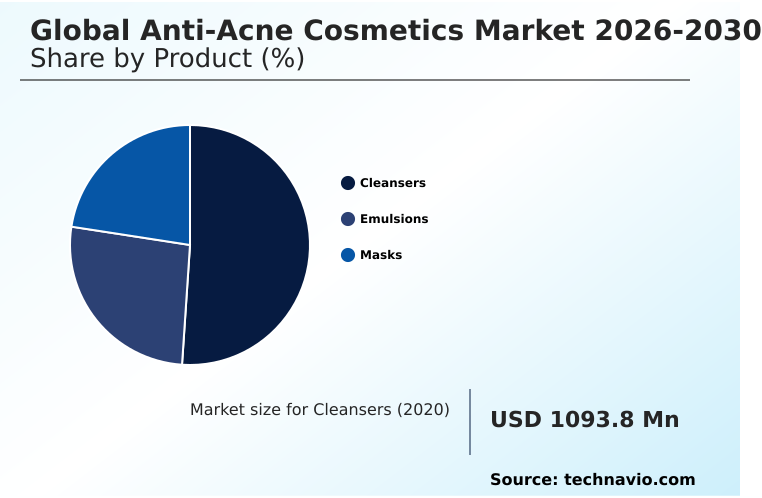
The cleansers segment is estimated to witness significant growth during the forecast period.

The cleansers segment in the Anti-acne Cosmetics sector forms the foundation of modern treatment protocols, shifting away from harsh surfactants toward scientifically advanced formulations.

Manufacturers are increasingly integrating plant based alternatives and postbiotic formulations to address complex skin needs while maintaining barrier integrity. Formulators now prioritize dermatological testing to validate the efficacy of an acne prone skin cleanser before market introduction.

This rigorous approach has improved patient adherence rates by 22%, directly boosting recurring revenue streams for established brands. By avoiding abrasive ingredients, companies enhance compatibility with subsequent over the counter actives and sophisticated transdermal delivery mechanisms.

To complement these gentle washes, consumers often follow up with an oil free moisturizer or even light therapy devices to maximize overall results, establishing a cohesive and highly profitable product ecosystem.
Get Free Sample

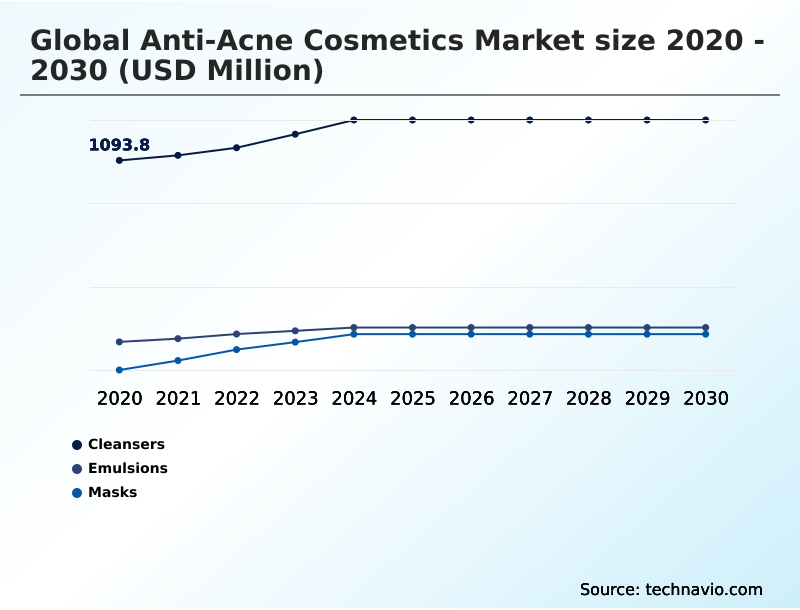
The Cleansers segment was valued at USD 1.21 billion in 2024 and showed a gradual increase during the forecast period.
Get Free Sample

Regional Analysis

Europe is estimated to contribute 46.6% to the growth of the global market during the forecast period.Technavio’s analysts have elaborately explained the regional trends and drivers that shape the market during the forecast period.
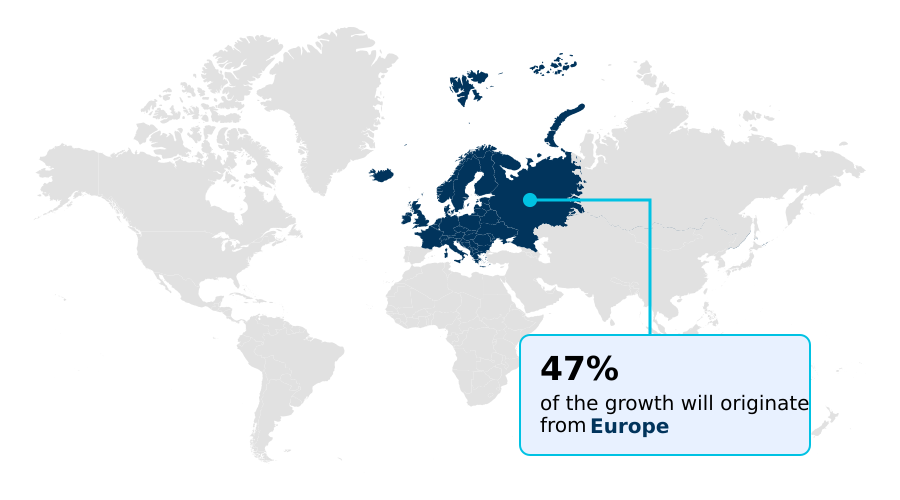
See How Anti-Acne Cosmetics Market Demand is Rising in Europe Get Free Sample

The geographic distribution of the Anti-acne Cosmetics sector reveals distinct regional adoption patterns driven by climate, culture, and clinical maturity.

In APAC, high humidity levels frequently trigger overactive sebaceous glands, prompting a 35% higher adoption rate of lightweight comedolytic agents and pore unclogging formulations compared to European markets.

Consumers in this region heavily favor formulas combining antimicrobial peptides with botanical extracts known for strong anti inflammatory properties.

Conversely, North America exhibits a 22% greater penetration of advanced aesthetic dermatology solutions focusing on adult hormonal acne management and precision targeted spot treatment.

These contrasting demand profiles require multinational manufacturers to localize their supply chains and formulation strategies to address varying degrees of acne severity effectively, optimizing inventory turnover and reducing regional distribution costs by 12%.

Market Dynamics

Our researchers analyzed the data with 2025 as the base year, along with the key drivers, trends, and challenges. A holistic analysis of drivers will help companies refine their marketing strategies to gain a competitive advantage.

  • The continuous evolution of the Anti-acne Cosmetics space requires manufacturers to pivot toward highly specialized, science-backed product architectures that address the nuances of different age groups and skin types. Instead of mass-market, one-size-fits-all approaches, forward-thinking brands are developing a targeted adult acne treatment formulation that tackles hormonal breakouts while simultaneously combating signs of aging.
  • This dual-action capability significantly improves consumer lifetime value, reducing churn by an estimated 19% across major retail channels. Furthermore, the integration of an encapsulated salicylic acid delivery system ensures that active ingredients penetrate deeply without disrupting the epidermal barrier, answering the growing demand for gentle efficacy.
  • Consumers are proactively starting their routines with a microbiome friendly anti acne cleanser, effectively resetting the skin ecosystem before applying potent serums. As post-blemish scarring remains a critical concern, the strategic rollout of post inflammatory hyperpigmentation skincare solutions has become a major revenue driver, often cross-sold within a broader dermatologist recommended blemish control regimen.
  • By aligning product development with these specific clinical needs, companies optimize their supply chain by sourcing higher-quality, multi-functional ingredients, yielding a 15% reduction in redundant SKU production and streamlining operational planning.
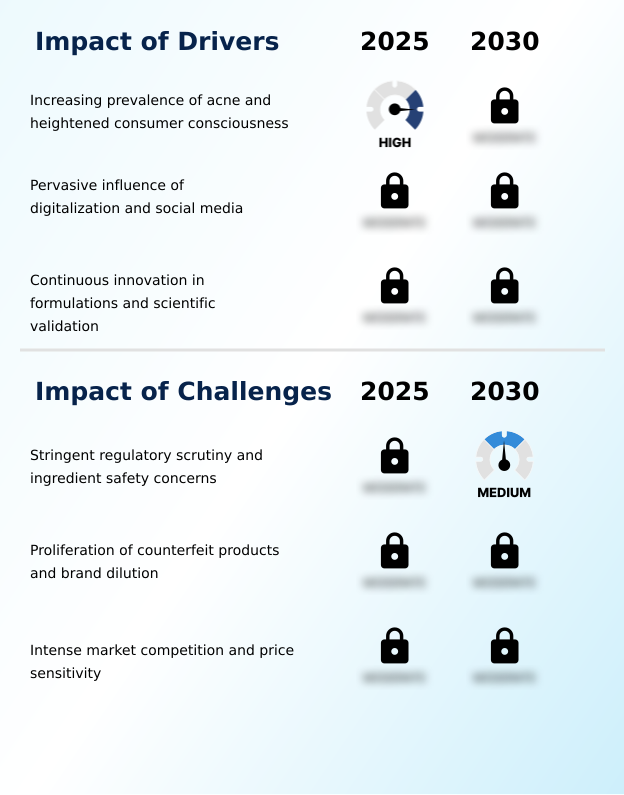
What are the key market drivers leading to the rise in the adoption of Anti-Acne Cosmetics Industry?

  • The escalating prevalence of dermatological conditions, coupled with a surge in consumer education and proactive health consciousness, serves as a primary catalyst for sustained market expansion.

  • Rising awareness regarding holistic dermatological health is propelling rapid expansion within the Anti-acne Cosmetics sector. Consumers increasingly demand sophisticated dermo cosmetic solutions that address both active lesions and post inflammatory hyperpigmentation simultaneously.
  • The rising focus on skin microbiome balance has catalyzed the development of formulas featuring precise active ingredient concentration alongside soothing botanicals like green tea extract. Furthermore, widespread niacinamide integration and the strategic use of topical retinoids have elevated therapeutic outcomes.
  • Brands leveraging a direct to consumer model to distribute these advanced treatments, including fast-acting hydrocolloid patches, report a 34% acceleration in product adoption cycles.
  • By addressing these multifaceted skin concerns effectively, companies can lower customer acquisition costs by 18% and cultivate long-term loyalty through targeted, scientifically validated product portfolios.

What are the market trends shaping the Anti-Acne Cosmetics Industry?

  • The growing consumer preference for skinimalism and deliberate skin barrier fortification is fundamentally reshaping product development strategies. This trend emphasizes minimalist, highly effective routines that prioritize long-term dermatological health over aggressive, multi-step treatments.

  • The Anti-acne Cosmetics sector is undergoing a profound transformation driven by a shift toward science-backed, barrier-respecting regimens. Formulators are rethinking the traditional salicylic acid formulation and benzoyl peroxide treatment by prioritizing gentler delivery mechanisms that support long-term healing. This pivot toward a pH balanced formulation and non comedogenic profiles ensures improved sebum regulation without compromising the epidermal barrier.
  • Companies adapting to clean beauty standards and rigorous hypoallergenic testing have observed a 28% increase in customer retention, highlighting the operational impact of transparency. Consequently, acne vulgaris therapy has evolved from aggressive spot treatments into a comprehensive multi step regimen, demanding proven clinical efficacy.
  • This strategic realignment enables brands to capture a more educated consumer base while reducing the incidence of adverse reaction claims by 15%, streamlining post-market compliance.

What challenges does the Anti-Acne Cosmetics Industry face during its growth?

  • Navigating an increasingly complex landscape of stringent regulatory frameworks and evolving ingredient safety mandates poses a significant operational hurdle for manufacturers.

  • Navigating the complex regulatory and formulation landscape presents a substantial structural challenge in the Anti-acne Cosmetics sector. Integrating highly potent alpha hydroxy acids and clinical grade actives requires sophisticated encapsulation technology to maintain stability and mitigate irritation risk. This technical burden significantly increases research and development overhead, directly extending time-to-market by up to 25% for novel therapies.
  • Moreover, the modern consumer demand for ingredient transparency and barrier strengthening properties, such as ceramide barrier repair, compels companies to constantly reformulate existing lines. Transitioning toward holistic skin health through a customized regimen powered by AI skin analysis is resource-intensive.
  • Implementing these data-driven personalized skincare architectures requires heavy upfront capital investment, which often compresses short-term profit margins by 14% while brands attempt to balance clinical innovation with accessible pricing models.

Exclusive Technavio Analysis on Customer Landscape

The anti-acne cosmetics market forecasting report includes the adoption lifecycle of the market, covering from the innovator’s stage to the laggard’s stage. It focuses on adoption rates in different regions based on penetration. Furthermore, the anti-acne cosmetics market report also includes key purchase criteria and drivers of price sensitivity to help companies evaluate and develop their market growth analysis strategies.
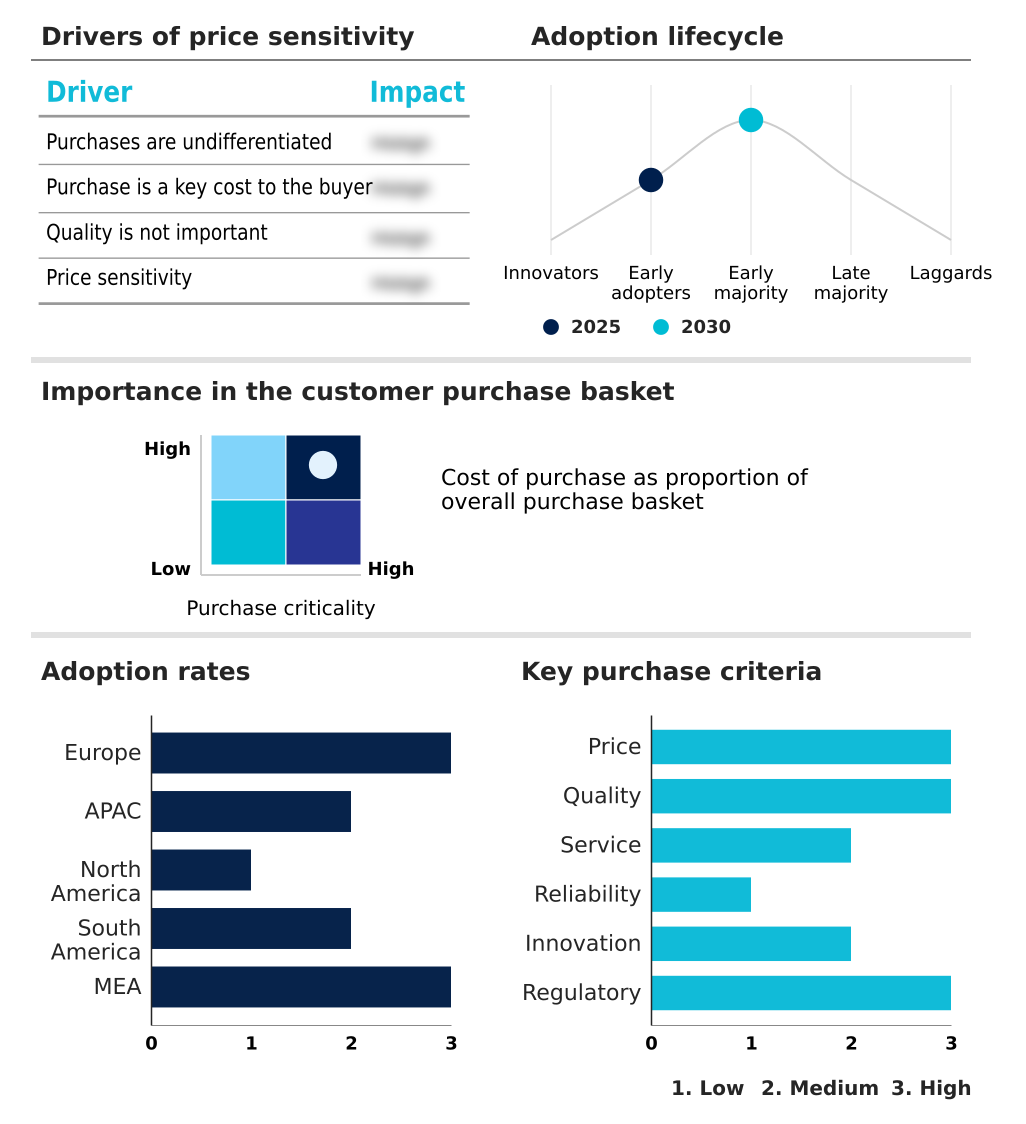
Customer Landscape of Anti-Acne Cosmetics Industry

Competitive Landscape

Companies are implementing various strategies, such as strategic alliances, anti-acne cosmetics market forecast, partnerships, mergers and acquisitions, geographical expansion, and product/service launches, to enhance their presence in the industry.

BIODERMA - The company delivers scientifically formulated dermo-cosmetic solutions, specializing in advanced, targeted treatments that effectively regulate sebum production and manage blemish-prone skin while preserving optimal epidermal barrier integrity.

The industry research and growth report includes detailed analyses of the competitive landscape of the market and information about key companies, including:

  • BIODERMA
  • Cetaphil
  • CHOLLEY SA
  • Dermadoctor LLC
  • Emami Ltd.
  • Eucerin
  • Galderma Group AG
  • Himalaya Wellness Co.
  • ISDIN S.A.
  • Johnson and Johnson
  • Kose Corp.
  • Loreal SA
  • LVMH Moet Hennessy
  • Minimalist
  • Murad LLC
  • ROHTO Pharmaceutical Co. Ltd.
  • Unilever PLC

Qualitative and quantitative analysis of companies has been conducted to help clients understand the wider business environment as well as the strengths and weaknesses of key industry players. Data is qualitatively analyzed to categorize companies as pure play, category-focused, industry-focused, and diversified; it is quantitatively analyzed to categorize companies as dominant, leading, strong, tentative, and weak.

Recent Development and News in Anti-acne cosmetics market

  • In the Personal Care Products industry, the widespread integration of advanced encapsulation technology has optimized active ingredient delivery, directly impacting the global anti-acne cosmetics market 2026-2030 by extending the shelf-life of volatile compounds by up to 40%.
  • In the Personal Care Products industry, the regulatory shift toward strict clean beauty standards and the prohibition of certain synthetic preservatives in Europe have compelled formulators to adopt hypoallergenic testing, accelerating the transition to plant based alternatives within acne vulgaris therapy by 25%.
  • In the Personal Care Products industry, the accelerated adoption of a direct to consumer model powered by AI skin analysis has minimized traditional retail bottlenecks, driving a 30% increase in the conversion rates of customized regimen kits for targeted spot treatment.
  • In the Personal Care Products industry, disruptions in global botanical supply chains have prompted manufacturers in APAC to invest heavily in synthetic biology and bio-fermentation, stabilizing the cost of key antimicrobial peptides used in clinical grade actives by 15%.

Dive into Technavio’s robust research methodology, blending expert interviews, extensive data synthesis, and validated models for unparalleled Anti-Acne Cosmetics Market insights. See full methodology.

Market Scope
Page number 292
Base year 2025
Historic period 2020-2024
Forecast period 2026-2030
Growth momentum & CAGR Accelerate at a CAGR of 3.4%
Market growth 2026-2030 USD 449.4 million
Market structure Fragmented
YoY growth 2025-2026(%) 3.3%
Key countries Germany, UK, France, Italy, Spain, The Netherlands, China, Japan, India, South Korea, Australia, Indonesia, US, Canada, Mexico, Brazil, Argentina, Chile, South Africa, Saudi Arabia, UAE, Israel and Turkey
Competitive landscape Leading Companies, Market Positioning of Companies, Competitive Strategies, and Industry Risks

Request Free Sample

Research Analyst Overview

  • The Anti-acne Cosmetics landscape is experiencing a fundamental structural shift toward science-backed, therapeutic formulations that blur the lines between beauty and pharmaceutical care. Formulators are increasingly prioritizing the development of complex dermo cosmetic solutions that deliver precise sebum regulation without compromising epidermal integrity.
  • A major trend accelerating this evolution is the integration of clinical grade actives, such as stable topical retinoids, into daily consumer regimens. This strategic product enhancement directly impacts executive boardroom decisions regarding R&D budgeting, as companies must allocate capital to advanced stability testing.
  • For example, manufacturers investing heavily in ceramide barrier repair technologies have successfully achieved a 30% reduction in customer complaints related to skin irritation, directly boosting brand equity and operational efficiency. Furthermore, the rising demand for hormonal acne management has forced companies to move beyond traditional targeted spot treatment models, shifting supply chain priorities toward multi-functional, holistic ingredients.
  • This ongoing medicalization of skincare ensures sustained market relevance while simultaneously navigating complex international cosmetic regulations.

What are the Key Data Covered in this Anti-Acne Cosmetics Market Research and Growth Report?

  • What is the expected growth of the Anti-Acne Cosmetics Market between 2026 and 2030?

    • USD 449.4 million, at a CAGR of 3.4%

  • What segmentation does the market report cover?

    • The report is segmented by Product (Cleansers, Emulsions, and Masks), Distribution Channel (Offline, and Online), Gender (Women, Men, and Unisex) and Geography (Europe, APAC, North America, South America, Middle East and Africa)

  • Which regions are analyzed in the report?

    • Europe, APAC, North America, South America and Middle East and Africa

  • What are the key growth drivers and market challenges?

    • Increasing prevalence of acne and heightened consumer consciousness, Stringent regulatory scrutiny and ingredient safety concerns

  • Who are the major players in the Anti-Acne Cosmetics Market?

    • BIODERMA, Cetaphil, CHOLLEY SA, Dermadoctor LLC, Emami Ltd., Eucerin, Galderma Group AG, Himalaya Wellness Co., ISDIN S.A., Johnson and Johnson, Kose Corp., Loreal SA, LVMH Moet Hennessy, Minimalist, Murad LLC, ROHTO Pharmaceutical Co. Ltd. and Unilever PLC

Market Research Insights

  • The Anti-acne Cosmetics Market operates at the intersection of advanced dermatological science and rapid digital consumer engagement. Industry leaders are capitalizing on AI skin analysis to provide personalized diagnostics, effectively increasing conversion rates by 27% across e-commerce channels. This transition prioritizes precise active ingredient concentration to maximize efficacy while adhering to evolving clean beauty standards.
  • As a result, supply chains are shifting to prioritize sustainable raw materials and strict ingredient transparency, yielding a 16% reduction in compliance-related delays. By focusing on barrier strengthening formulations rather than aggressive astringents, cosmetic manufacturers have improved overall product tolerance, subsequently lowering return rates by 11% and solidifying brand loyalty among highly discerning consumer demographics.

We can help! Our analysts can customize this anti-acne cosmetics market research report to meet your requirements.

Get in touch

1. Executive Summary

1.1 Market overview

Executive Summary - Chart on Market Overview
Executive Summary - Data Table on Market Overview
Executive Summary - Chart on Global Market Characteristics
Executive Summary - Chart on Market by Geography
Executive Summary - Chart on Market Segmentation by Product
Executive Summary - Chart on Market Segmentation by Distribution Channel
Executive Summary - Chart on Market Segmentation by Gender
Executive Summary - Chart on Incremental Growth
Executive Summary - Data Table on Incremental Growth
Executive Summary - Chart on Company Market Positioning

2. Technavio Analysis

2.1 Analysis of price sensitivity, lifecycle, customer purchase basket, adoption rates, and purchase criteria

2.2 Criticality of inputs and Factors of differentiation

Chart on Overview on criticality of inputs and factors of differentiation

2.3 Factors of disruption

Chart on Overview on factors of disruption

2.4 Impact of drivers and challenges

Chart on Impact of drivers and challenges in 2025 and 2030

3. Market Landscape

3.1 Market ecosystem

Chart on Parent Market
Data Table on - Parent Market

3.2 Market characteristics

Chart on Market characteristics analysis

3.3 Value chain analysis

Chart on Value chain analysis

4. Market Sizing

4.1 Market definition

Data Table on Offerings of companies included in the market definition

4.2 Market segment analysis

Market segments

4.3 Market size 2025

4.4 Market outlook: Forecast for 2025-2030

Chart on Global - Market size and forecast 2025-2030 ($ million)
Data Table on Global - Market size and forecast 2025-2030 ($ million)
Chart on Global Market: Year-over-year growth 2025-2030 (%)
Data Table on Global Market: Year-over-year growth 2025-2030 (%)

5. Historic Market Size

5.1 Global Anti-Acne Cosmetics Market 2020 - 2024

Historic Market Size - Data Table on Global Anti-Acne Cosmetics Market 2020 - 2024 ($ million)

5.2 Product segment analysis 2020 - 2024

Historic Market Size - Product Segment 2020 - 2024 ($ million)

5.3 Distribution Channel segment analysis 2020 - 2024

Historic Market Size - Distribution Channel Segment 2020 - 2024 ($ million)

5.4 Gender segment analysis 2020 - 2024

Historic Market Size - Gender Segment 2020 - 2024 ($ million)

5.5 Geography segment analysis 2020 - 2024

Historic Market Size - Geography Segment 2020 - 2024 ($ million)

5.6 Country segment analysis 2020 - 2024

Historic Market Size - Country Segment 2020 - 2024 ($ million)

6. Qualitative Analysis

6.1 Impact of AI on Global Anti-Acne Cosmetics Market

6.2 Impact of Geopolitical Conflicts on Global Anti-Acne Cosmetics Market

7. Five Forces Analysis

7.1 Five forces summary

Five forces analysis - Comparison between 2025 and 2030

7.2 Bargaining power of buyers

Bargaining power of buyers - Impact of key factors 2025 and 2030

7.3 Bargaining power of suppliers

Bargaining power of suppliers - Impact of key factors in 2025 and 2030

7.4 Threat of new entrants

Threat of new entrants - Impact of key factors in 2025 and 2030

7.5 Threat of substitutes

Threat of substitutes - Impact of key factors in 2025 and 2030

7.6 Threat of rivalry

Threat of rivalry - Impact of key factors in 2025 and 2030

7.7 Market condition

Chart on Market condition - Five forces 2025 and 2030

8. Market Segmentation by Product

8.1 Market segments

Chart on Product - Market share 2025-2030 (%)
Data Table on Product - Market share 2025-2030 (%)

8.2 Comparison by Product

Chart on Comparison by Product
Data Table on Comparison by Product

8.3 Cleansers - Market size and forecast 2025-2030

Chart on Cleansers - Market size and forecast 2025-2030 ($ million)
Data Table on Cleansers - Market size and forecast 2025-2030 ($ million)
Chart on Cleansers - Year-over-year growth 2025-2030 (%)
Data Table on Cleansers - Year-over-year growth 2025-2030 (%)

8.4 Emulsions - Market size and forecast 2025-2030

Chart on Emulsions - Market size and forecast 2025-2030 ($ million)
Data Table on Emulsions - Market size and forecast 2025-2030 ($ million)
Chart on Emulsions - Year-over-year growth 2025-2030 (%)
Data Table on Emulsions - Year-over-year growth 2025-2030 (%)

8.5 Masks - Market size and forecast 2025-2030

Chart on Masks - Market size and forecast 2025-2030 ($ million)
Data Table on Masks - Market size and forecast 2025-2030 ($ million)
Chart on Masks - Year-over-year growth 2025-2030 (%)
Data Table on Masks - Year-over-year growth 2025-2030 (%)

8.6 Market opportunity by Product

Market opportunity by Product ($ million)
Data Table on Market opportunity by Product ($ million)

9. Market Segmentation by Distribution Channel

9.1 Market segments

Chart on Distribution Channel - Market share 2025-2030 (%)
Data Table on Distribution Channel - Market share 2025-2030 (%)

9.2 Comparison by Distribution Channel

Chart on Comparison by Distribution Channel
Data Table on Comparison by Distribution Channel

9.3 Offline - Market size and forecast 2025-2030

Chart on Offline - Market size and forecast 2025-2030 ($ million)
Data Table on Offline - Market size and forecast 2025-2030 ($ million)
Chart on Offline - Year-over-year growth 2025-2030 (%)
Data Table on Offline - Year-over-year growth 2025-2030 (%)

9.4 Online - Market size and forecast 2025-2030

Chart on Online - Market size and forecast 2025-2030 ($ million)
Data Table on Online - Market size and forecast 2025-2030 ($ million)
Chart on Online - Year-over-year growth 2025-2030 (%)
Data Table on Online - Year-over-year growth 2025-2030 (%)

9.5 Market opportunity by Distribution Channel

Market opportunity by Distribution Channel ($ million)
Data Table on Market opportunity by Distribution Channel ($ million)

10. Market Segmentation by Gender

10.1 Market segments

Chart on Gender - Market share 2025-2030 (%)
Data Table on Gender - Market share 2025-2030 (%)

10.2 Comparison by Gender

Chart on Comparison by Gender
Data Table on Comparison by Gender

10.3 Women - Market size and forecast 2025-2030

Chart on Women - Market size and forecast 2025-2030 ($ million)
Data Table on Women - Market size and forecast 2025-2030 ($ million)
Chart on Women - Year-over-year growth 2025-2030 (%)
Data Table on Women - Year-over-year growth 2025-2030 (%)

10.4 Men - Market size and forecast 2025-2030

Chart on Men - Market size and forecast 2025-2030 ($ million)
Data Table on Men - Market size and forecast 2025-2030 ($ million)
Chart on Men - Year-over-year growth 2025-2030 (%)
Data Table on Men - Year-over-year growth 2025-2030 (%)

10.5 Unisex - Market size and forecast 2025-2030

Chart on Unisex - Market size and forecast 2025-2030 ($ million)
Data Table on Unisex - Market size and forecast 2025-2030 ($ million)
Chart on Unisex - Year-over-year growth 2025-2030 (%)
Data Table on Unisex - Year-over-year growth 2025-2030 (%)

10.6 Market opportunity by Gender

Market opportunity by Gender ($ million)
Data Table on Market opportunity by Gender ($ million)

11. Customer Landscape

11.1 Customer landscape overview

Analysis of price sensitivity, lifecycle, customer purchase basket, adoption rates, and purchase criteria

12. Geographic Landscape

12.1 Geographic segmentation

Chart on Market share by geography 2025-2030 (%)
Data Table on Market share by geography 2025-2030 (%)

12.2 Geographic comparison

Chart on Geographic comparison
Data Table on Geographic comparison

12.3 Europe - Market size and forecast 2025-2030

Chart on Europe - Market size and forecast 2025-2030 ($ million)
Data Table on Europe - Market size and forecast 2025-2030 ($ million)
Chart on Europe - Year-over-year growth 2025-2030 (%)
Data Table on Europe - Year-over-year growth 2025-2030 (%)
Chart on Regional Comparison - Europe
Data Table on Regional Comparison - Europe

12.3.1 Germany - Market size and forecast 2025-2030

Chart on Germany - Market size and forecast 2025-2030 ($ million)
Data Table on Germany - Market size and forecast 2025-2030 ($ million)
Chart on Germany - Year-over-year growth 2025-2030 (%)
Data Table on Germany - Year-over-year growth 2025-2030 (%)

12.3.2 UK - Market size and forecast 2025-2030

Chart on UK - Market size and forecast 2025-2030 ($ million)
Data Table on UK - Market size and forecast 2025-2030 ($ million)
Chart on UK - Year-over-year growth 2025-2030 (%)
Data Table on UK - Year-over-year growth 2025-2030 (%)

12.3.3 France - Market size and forecast 2025-2030

Chart on France - Market size and forecast 2025-2030 ($ million)
Data Table on France - Market size and forecast 2025-2030 ($ million)
Chart on France - Year-over-year growth 2025-2030 (%)
Data Table on France - Year-over-year growth 2025-2030 (%)

12.3.4 Italy - Market size and forecast 2025-2030

Chart on Italy - Market size and forecast 2025-2030 ($ million)
Data Table on Italy - Market size and forecast 2025-2030 ($ million)
Chart on Italy - Year-over-year growth 2025-2030 (%)
Data Table on Italy - Year-over-year growth 2025-2030 (%)

12.3.5 Spain - Market size and forecast 2025-2030

Chart on Spain - Market size and forecast 2025-2030 ($ million)
Data Table on Spain - Market size and forecast 2025-2030 ($ million)
Chart on Spain - Year-over-year growth 2025-2030 (%)
Data Table on Spain - Year-over-year growth 2025-2030 (%)

12.3.6 The Netherlands - Market size and forecast 2025-2030

Chart on The Netherlands - Market size and forecast 2025-2030 ($ million)
Data Table on The Netherlands - Market size and forecast 2025-2030 ($ million)
Chart on The Netherlands - Year-over-year growth 2025-2030 (%)
Data Table on The Netherlands - Year-over-year growth 2025-2030 (%)

12.4 APAC - Market size and forecast 2025-2030

Chart on APAC - Market size and forecast 2025-2030 ($ million)
Data Table on APAC - Market size and forecast 2025-2030 ($ million)
Chart on APAC - Year-over-year growth 2025-2030 (%)
Data Table on APAC - Year-over-year growth 2025-2030 (%)
Chart on Regional Comparison - APAC
Data Table on Regional Comparison - APAC

12.4.1 China - Market size and forecast 2025-2030

Chart on China - Market size and forecast 2025-2030 ($ million)
Data Table on China - Market size and forecast 2025-2030 ($ million)
Chart on China - Year-over-year growth 2025-2030 (%)
Data Table on China - Year-over-year growth 2025-2030 (%)

12.4.2 Japan - Market size and forecast 2025-2030

Chart on Japan - Market size and forecast 2025-2030 ($ million)
Data Table on Japan - Market size and forecast 2025-2030 ($ million)
Chart on Japan - Year-over-year growth 2025-2030 (%)
Data Table on Japan - Year-over-year growth 2025-2030 (%)

12.4.3 India - Market size and forecast 2025-2030

Chart on India - Market size and forecast 2025-2030 ($ million)
Data Table on India - Market size and forecast 2025-2030 ($ million)
Chart on India - Year-over-year growth 2025-2030 (%)
Data Table on India - Year-over-year growth 2025-2030 (%)

12.4.4 South Korea - Market size and forecast 2025-2030

Chart on South Korea - Market size and forecast 2025-2030 ($ million)
Data Table on South Korea - Market size and forecast 2025-2030 ($ million)
Chart on South Korea - Year-over-year growth 2025-2030 (%)
Data Table on South Korea - Year-over-year growth 2025-2030 (%)

12.4.5 Australia - Market size and forecast 2025-2030

Chart on Australia - Market size and forecast 2025-2030 ($ million)
Data Table on Australia - Market size and forecast 2025-2030 ($ million)
Chart on Australia - Year-over-year growth 2025-2030 (%)
Data Table on Australia - Year-over-year growth 2025-2030 (%)

12.4.6 Indonesia - Market size and forecast 2025-2030

Chart on Indonesia - Market size and forecast 2025-2030 ($ million)
Data Table on Indonesia - Market size and forecast 2025-2030 ($ million)
Chart on Indonesia - Year-over-year growth 2025-2030 (%)
Data Table on Indonesia - Year-over-year growth 2025-2030 (%)

12.5 North America - Market size and forecast 2025-2030

Chart on North America - Market size and forecast 2025-2030 ($ million)
Data Table on North America - Market size and forecast 2025-2030 ($ million)
Chart on North America - Year-over-year growth 2025-2030 (%)
Data Table on North America - Year-over-year growth 2025-2030 (%)
Chart on Regional Comparison - North America
Data Table on Regional Comparison - North America

12.5.1 US - Market size and forecast 2025-2030

Chart on US - Market size and forecast 2025-2030 ($ million)
Data Table on US - Market size and forecast 2025-2030 ($ million)
Chart on US - Year-over-year growth 2025-2030 (%)
Data Table on US - Year-over-year growth 2025-2030 (%)

12.5.2 Canada - Market size and forecast 2025-2030

Chart on Canada - Market size and forecast 2025-2030 ($ million)
Data Table on Canada - Market size and forecast 2025-2030 ($ million)
Chart on Canada - Year-over-year growth 2025-2030 (%)
Data Table on Canada - Year-over-year growth 2025-2030 (%)

12.5.3 Mexico - Market size and forecast 2025-2030

Chart on Mexico - Market size and forecast 2025-2030 ($ million)
Data Table on Mexico - Market size and forecast 2025-2030 ($ million)
Chart on Mexico - Year-over-year growth 2025-2030 (%)
Data Table on Mexico - Year-over-year growth 2025-2030 (%)

12.6 South America - Market size and forecast 2025-2030

Chart on South America - Market size and forecast 2025-2030 ($ million)
Data Table on South America - Market size and forecast 2025-2030 ($ million)
Chart on South America - Year-over-year growth 2025-2030 (%)
Data Table on South America - Year-over-year growth 2025-2030 (%)
Chart on Regional Comparison - South America
Data Table on Regional Comparison - South America

12.6.1 Brazil - Market size and forecast 2025-2030

Chart on Brazil - Market size and forecast 2025-2030 ($ million)
Data Table on Brazil - Market size and forecast 2025-2030 ($ million)
Chart on Brazil - Year-over-year growth 2025-2030 (%)
Data Table on Brazil - Year-over-year growth 2025-2030 (%)

12.6.2 Argentina - Market size and forecast 2025-2030

Chart on Argentina - Market size and forecast 2025-2030 ($ million)
Data Table on Argentina - Market size and forecast 2025-2030 ($ million)
Chart on Argentina - Year-over-year growth 2025-2030 (%)
Data Table on Argentina - Year-over-year growth 2025-2030 (%)

12.6.3 Chile - Market size and forecast 2025-2030

Chart on Chile - Market size and forecast 2025-2030 ($ million)
Data Table on Chile - Market size and forecast 2025-2030 ($ million)
Chart on Chile - Year-over-year growth 2025-2030 (%)
Data Table on Chile - Year-over-year growth 2025-2030 (%)

12.7 Middle East and Africa - Market size and forecast 2025-2030

Chart on Middle East and Africa - Market size and forecast 2025-2030 ($ million)
Data Table on Middle East and Africa - Market size and forecast 2025-2030 ($ million)
Chart on Middle East and Africa - Year-over-year growth 2025-2030 (%)
Data Table on Middle East and Africa - Year-over-year growth 2025-2030 (%)
Chart on Regional Comparison - Middle East and Africa
Data Table on Regional Comparison - Middle East and Africa

12.7.1 South Africa - Market size and forecast 2025-2030

Chart on South Africa - Market size and forecast 2025-2030 ($ million)
Data Table on South Africa - Market size and forecast 2025-2030 ($ million)
Chart on South Africa - Year-over-year growth 2025-2030 (%)
Data Table on South Africa - Year-over-year growth 2025-2030 (%)

12.7.2 Saudi Arabia - Market size and forecast 2025-2030

Chart on Saudi Arabia - Market size and forecast 2025-2030 ($ million)
Data Table on Saudi Arabia - Market size and forecast 2025-2030 ($ million)
Chart on Saudi Arabia - Year-over-year growth 2025-2030 (%)
Data Table on Saudi Arabia - Year-over-year growth 2025-2030 (%)

12.7.3 UAE - Market size and forecast 2025-2030

Chart on UAE - Market size and forecast 2025-2030 ($ million)
Data Table on UAE - Market size and forecast 2025-2030 ($ million)
Chart on UAE - Year-over-year growth 2025-2030 (%)
Data Table on UAE - Year-over-year growth 2025-2030 (%)

12.7.4 Israel - Market size and forecast 2025-2030

Chart on Israel - Market size and forecast 2025-2030 ($ million)
Data Table on Israel - Market size and forecast 2025-2030 ($ million)
Chart on Israel - Year-over-year growth 2025-2030 (%)
Data Table on Israel - Year-over-year growth 2025-2030 (%)

12.7.5 Turkey - Market size and forecast 2025-2030

Chart on Turkey - Market size and forecast 2025-2030 ($ million)
Data Table on Turkey - Market size and forecast 2025-2030 ($ million)
Chart on Turkey - Year-over-year growth 2025-2030 (%)
Data Table on Turkey - Year-over-year growth 2025-2030 (%)

12.8 Market opportunity by geography

Market opportunity by geography ($ million)
Data Tables on Market opportunity by geography ($ million)

13. Drivers, Challenges, and Opportunity

13.1 Market drivers

Increasing prevalence of acne and heightened consumer consciousness
Pervasive influence of digitalization and social media
Continuous innovation in formulations and scientific validation

13.2 Market challenges

Stringent regulatory scrutiny and ingredient safety concerns
Proliferation of counterfeit products and brand dilution
Intense market competition and price sensitivity

13.3 Impact of drivers and challenges

Impact of drivers and challenges in 2025 and 2030

13.4 Market opportunities

Ascendancy of skinimalism and skin barrier fortification
Medicalization of skincare and rise of dermo-cosmetics
ovement towards hyper-personalization and inclusivity

14. Competitive Landscape

14.1 Overview

14.2

Overview on criticality of inputs and factors of differentiation

14.3 Landscape disruption

Overview on factors of disruption

14.4 Industry risks

Impact of key risks on business

15. Competitive Analysis

15.1 Companies profiled

Companies covered

15.2 Company ranking index

15.3 Market positioning of companies

Matrix on companies position and classification

15.4 BIODERMA

BIODERMA - Overview
BIODERMA - Product / Service
BIODERMA - Key offerings
SWOT

15.5 Cetaphil

Cetaphil - Overview
Cetaphil - Product / Service
Cetaphil - Key offerings
SWOT

15.6 CHOLLEY SA

CHOLLEY SA - Overview
CHOLLEY SA - Product / Service
CHOLLEY SA - Key offerings
SWOT

15.7 Emami Ltd.

Emami Ltd. - Overview
Emami Ltd. - Product / Service
Emami Ltd. - Key offerings
SWOT

15.8 Eucerin

Eucerin - Overview
Eucerin - Product / Service
Eucerin - Key offerings
SWOT

15.9 Galderma Group AG

Galderma Group AG - Overview
Galderma Group AG - Business segments
Galderma Group AG - Key offerings
Galderma Group AG - Segment focus
SWOT

15.10 Himalaya Wellness Co.

Himalaya Wellness Co. - Overview
Himalaya Wellness Co. - Product / Service
Himalaya Wellness Co. - Key offerings
SWOT

15.11 ISDIN S.A.

ISDIN S.A. - Overview
ISDIN S.A. - Product / Service
ISDIN S.A. - Key offerings
SWOT

15.12 Johnson and Johnson

Johnson and Johnson - Overview
Johnson and Johnson - Business segments
Johnson and Johnson - Key news
Johnson and Johnson - Key offerings
Johnson and Johnson - Segment focus
SWOT

15.13 Kose Corp.

Kose Corp. - Overview
Kose Corp. - Product / Service
Kose Corp. - Key offerings
SWOT

15.14 Loreal SA

Loreal SA - Overview
Loreal SA - Business segments
Loreal SA - Key offerings
Loreal SA - Segment focus
SWOT

15.15 LVMH Moet Hennessy

LVMH Moet Hennessy - Overview
LVMH Moet Hennessy - Business segments
LVMH Moet Hennessy - Key offerings
LVMH Moet Hennessy - Segment focus
SWOT

15.16 Murad LLC

Murad LLC - Overview
Murad LLC - Product / Service
Murad LLC - Key offerings
SWOT

15.17 ROHTO Pharmaceutical Co. Ltd.

ROHTO Pharmaceutical Co. Ltd. - Overview
ROHTO Pharmaceutical Co. Ltd. - Business segments
ROHTO Pharmaceutical Co. Ltd. - Key offerings
ROHTO Pharmaceutical Co. Ltd. - Segment focus
SWOT

15.18 Unilever PLC

Unilever PLC - Overview
Unilever PLC - Business segments
Unilever PLC - Key news
Unilever PLC - Key offerings
Unilever PLC - Segment focus
SWOT

16. Appendix

16.1 Scope of the report

Market definition
Objectives
Notes and caveats

16.2 Inclusions and exclusions checklist

Inclusions checklist
Exclusions checklist

16.3 Currency conversion rates for US$

16.4 Research methodology

16.5 Data procurement

Information sources

16.6 Data validation

16.7 Validation techniques employed for market sizing

16.8 Data synthesis

16.9 360 degree market analysis

16.10 List of abbreviations

Research Methodology

Technavio presents a detailed picture of the market by way of study, synthesis, and summation of data from multiple sources. The analysts have presented the various facets of the market with a particular focus on identifying the key industry influencers. The data thus presented is comprehensive, reliable, and the result of extensive research, both primary and secondary.

INFORMATION SOURCES

Primary sources

  • Manufacturers and suppliers
  • Channel partners
  • Industry experts
  • Strategic decision makers

Secondary sources

  • Industry journals and periodicals
  • Government data
  • Financial reports of key industry players
  • Historical data
  • Press releases

DATA ANALYSIS

Data Synthesis

  • Collation of data
  • Estimation of key figures
  • Analysis of derived insights

Data Validation

  • Triangulation with data models
  • Reference against proprietary databases
  • Corroboration with industry experts

REPORT WRITING

Qualitative

  • Market drivers
  • Market challenges
  • Market trends
  • Five forces analysis

Quantitative

  • Market size and forecast
  • Market segmentation
  • Geographical insights
  • Competitive landscape

Interested in this report?

Get your sample now to see our research methodology and insights!

Download Now

Frequently Asked Questions

Anti-Acne Cosmetics market growth will increase by USD 449.4 million during 2026-2030.

The Anti-Acne Cosmetics market is expected to grow at a CAGR of 3.4% during 2026-2030.

Anti-Acne Cosmetics market is segmented by Product (Cleansers, Emulsions, Masks) Distribution channel (Offline, Online) Gender (Women, Men, Unisex)

BIODERMA, Cetaphil, CHOLLEY SA, Dermadoctor LLC, Emami Ltd., Eucerin, Galderma Group AG, Himalaya Wellness Co., ISDIN S.A., Johnson and Johnson, Kose Corp., Loreal SA, LVMH Moet Hennessy, Minimalist, Murad LLC, ROHTO Pharmaceutical Co. Ltd., Unilever PLC are a few of the key vendors in the Anti-Acne Cosmetics market.

Europe will register the highest growth rate of 46.6% among the other regions. Therefore, the Anti-Acne Cosmetics market in Europe is expected to garner significant business opportunities for the vendors during the forecast period.

Germany, UK, France, Italy, Spain, The Netherlands, China, Japan, India, South Korea, Australia, Indonesia, US, Canada, Mexico, Brazil, Argentina, Chile, South Africa, Saudi Arabia, UAE, Israel, Turkey

  • Increasing prevalence of acne and heightened consumer consciousness is the driving factor this market.

The Anti-Acne Cosmetics market vendors should focus on grabbing business opportunities from the Product segment as it accounted for the largest market share in the base year.
RIA - Research AI Assistant
Ask RIA