Aluminium Profiles Market Analysis, Size, and Forecast 2026-2030: APAC (China, India, and Japan), Europe (Germany, Italy, and UK), North America (US, Canada, and Mexico), South America (Brazil, Argentina, and Chile), Middle East and Africa (UAE, Saudi Arabia, and South Africa), and Rest of World (ROW)

Aluminium Profiles Market Analysis, Size, and Forecast 2026-2030:
APAC (China, India, and Japan), Europe (Germany, Italy, and UK), North America (US, Canada, and Mexico), South America (Brazil, Argentina, and Chile), Middle East and Africa (UAE, Saudi Arabia, and South Africa), and Rest of World (ROW)

Published: May 2026 307 Pages SKU: IRTNTR81406

Market Overview at a Glance

$30.76 B
Market Opportunity
8.3%
CAGR 2025 - 2030
54.6%
APAC Growth
$24.70 B
Hollow profiles segment 2024

Aluminium Profiles Market Size and Growth Forecast 2026-2030

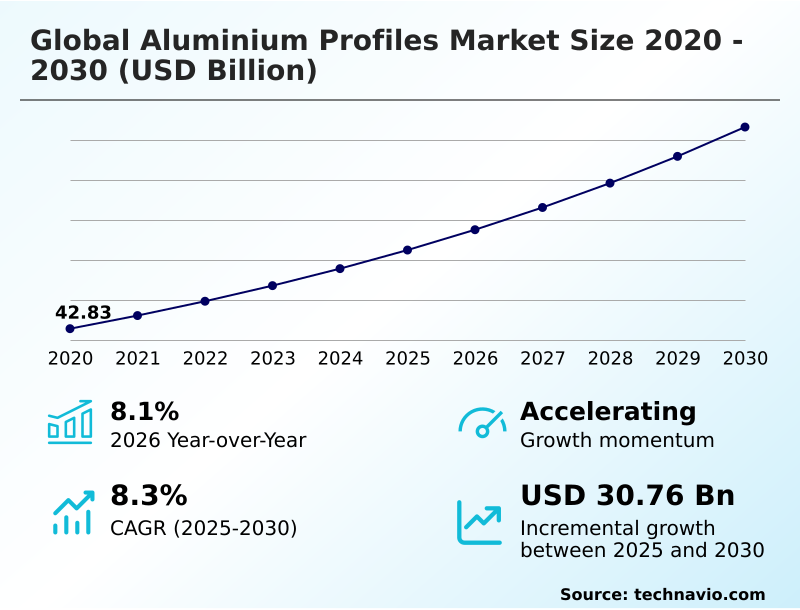
The Aluminium Profiles Market size was valued at USD 62.49 billion in 2025 growing at a CAGR of 8.3% during the forecast period 2026-2030.

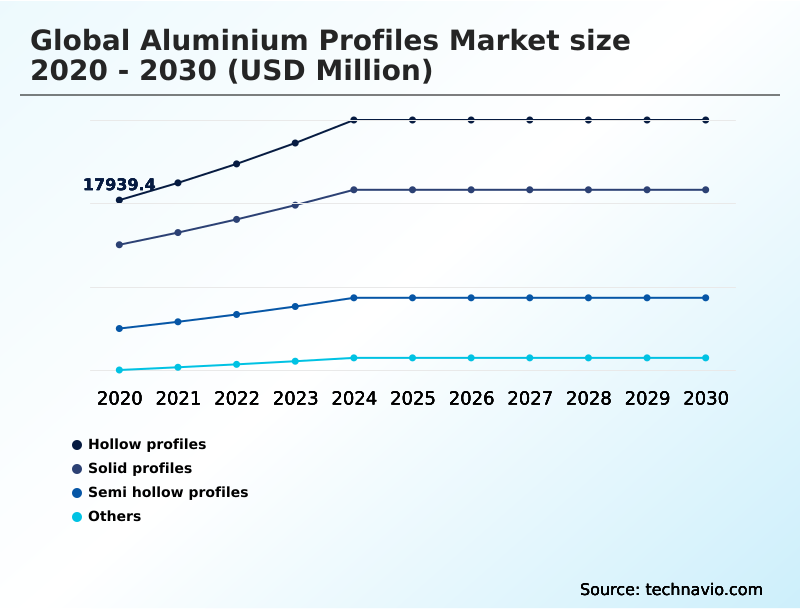
APAC accounts for 54.6% of incremental growth during the forecast period. The Hollow profiles segment by Product Type was valued at USD 24.70 billion in 2024, while the Building and construction segment holds the largest revenue share by End-user.

The market is projected to grow by USD 50.41 billion from 2020 to 2030, with USD 30.76 billion of the growth expected during the forecast period of 2025 to 2030.

Get Key Insights on Market Forecast (PDF) Request Free Sample

Aluminium Profiles Market Overview

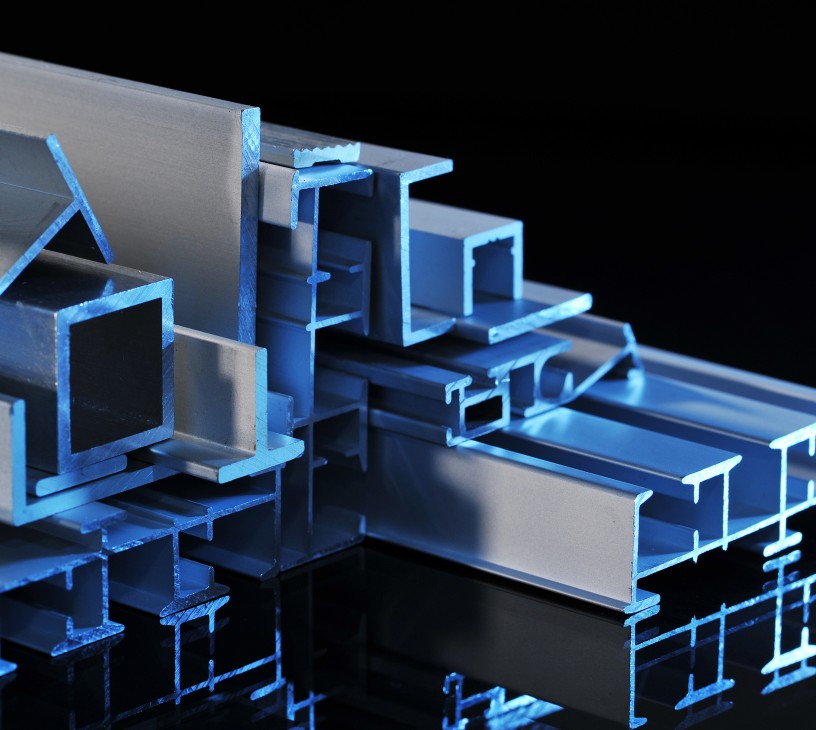
The aluminium profiles market is navigating a complex environment defined by the twin pressures of industrial efficiency and decarbonization. Demand is strong, particularly from the automotive sector's shift to vehicle electrification, where lightweighting is essential for extending battery range and performance. In a typical automotive assembly plant, the adoption of advanced joining techniques like friction stir welding enables the integration of extruded aluminium chassis components into multi-material architectures, reducing vehicle mass without compromising crashworthiness. Concurrently, the building and construction sector, which commands a majority share of consumption, increasingly specifies aluminium for curtain walls and window frames in projects targeting LEED certification. However, the energy-intensive nature of the extrusion process and primary smelting creates significant exposure to fluctuating energy costs. This dynamic is accelerating the industry's pivot toward a circular economy, with a focus on sourcing post-consumer scrap and secondary aluminium to mitigate cost volatility and reduce the carbon footprint associated with manufacturing aluminium alloy billets.

Drivers, Trends, and Challenges in the Aluminium Profiles Market

Strategic decision-making in the aluminium profiles market is increasingly dictated by the convergence of technological innovation and regulatory pressure. The push for decarbonization, codified by measures like the EU's Carbon Border Adjustment Mechanism, is forcing a systemic re-evaluation of supply chains and production methods.

This impacts everything from the supply chain risks in bauxite and alumina to the intricacies of carbon accounting for green aluminium production. In response, leading firms are leveraging advancements in extrusion die simulation software to optimize the production of complex components like hollow profiles for automotive battery cooling, reducing trial-and-error costs and material waste.

The aerospace sector continues to drive demand for high-performance 7000 series alloys for aerospace structures, where fatigue resistance is non-negotiable. Similarly, architects are specifying thermal break profiles for curtain wall systems and increasingly demand anodized finishes for architectural corrosion resistance, particularly in harsh environments.

The shift toward a circular economy is not just a trend but a competitive necessity, with a focus on using recycled aluminium in building construction. This pivot is supported by technologies such as X-ray fluorescence for scrap sorting.

The industrial sector benefits from T-slot profiles for modular factory automation, while innovations in friction stir welding for multi-material joints open new applications. As energy costs remain a key factor, the fact that secondary production uses approximately 95% less energy than primary smelting provides a compelling economic and environmental case for expanding circular economy models in aluminium extrusion.

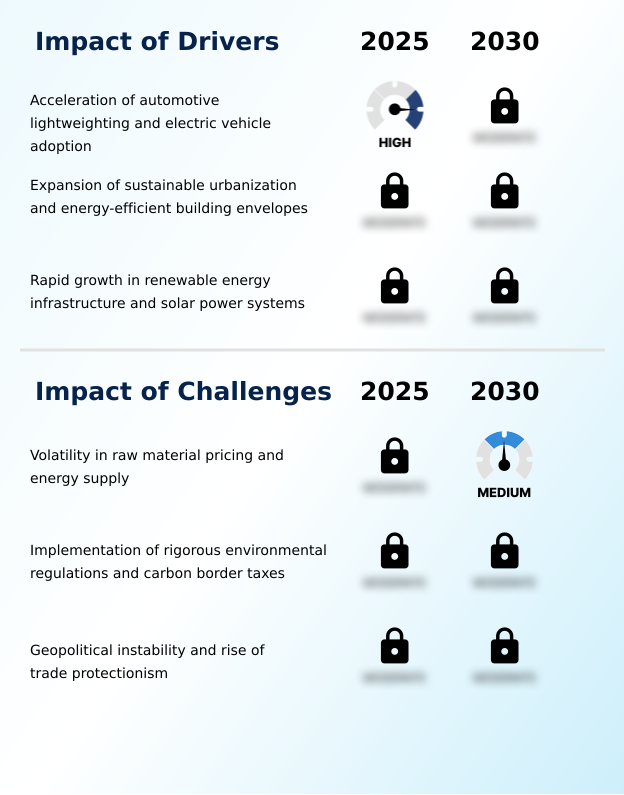
Primary Growth Driver: The acceleration of automotive lightweighting and electric vehicle adoption is a key driver, increasing demand for high-strength, low-weight aluminium profiles.

Demand is being fueled by three core pillars: automotive lightweighting, sustainable construction, and the expansion of renewable energy infrastructure.

In the automotive sector, the transition to vehicle electrification makes the high strength-to-weight ratio of aluminium profiles critical for manufacturing battery enclosures and chassis components that maximize range.

The building and construction sector, which constitutes the largest end-user segment, is driven by global urbanization and stringent energy efficiency regulations, spurring demand for profiles with thermal breaks for curtain walls and window frames.

Lastly, the global build-out of solar power relies heavily on the corrosion resistance and durability of aluminium profiles for solar panel mounting systems, creating a consistent and growing demand pipeline tied to clean energy targets.

Emerging Market Trend: The integration of AI and advanced automation in extrusion facilities is an upcoming trend. This digitalization optimizes production efficiency and minimizes material waste.

The market is advancing on two primary fronts: digitalization and material science. Within extrusion facilities, the adoption of Industry 4.0 principles is accelerating, with digital twins being used to simulate the extrusion process for complex hollow profiles before committing to physical production. This reduces scrap and shortens lead times.

Concurrently, a significant trend is the development of advanced alloy chemistry, moving beyond standard 6000 series alloys to customized 7000 series and aluminium-scandium variants for high-stress applications in aerospace and defense. This is complemented by a market-wide pivot toward a circular economy, where manufacturers are investing in technologies to process post-consumer scrap into high-quality secondary aluminium.

This move addresses sustainability demands and mitigates exposure to volatile primary aluminium prices, underpinning the market's 8.1% year-over-year growth.

Key Industry Challenge: Volatility in raw material pricing and energy supply, critical inputs for the energy-intensive smelting process, presents a key challenge affecting industry growth and profitability.

The industry faces a triad of interconnected challenges that threaten profitability and supply chain stability. First, extreme volatility in raw material and energy prices, with electricity accounting for up to 40% of smelting costs, creates significant margin pressure and complicates long-term planning.

Second, an increasingly stringent regulatory environment, exemplified by Europe's Carbon Border Adjustment Mechanism, imposes significant compliance costs and administrative burdens related to carbon accounting and material traceability. This requires substantial capital investment in green aluminium production and advanced recycling technologies.

Finally, geopolitical instability and trade protectionism, including anti-dumping duties and tariffs, disrupt global trade flows, leading to regional price disparities and forcing manufacturers to constantly re-evaluate their supply chain strategies to mitigate risks.

Explore Full Market Dynamics Analysis Request Free Sample

Aluminium Profiles Market Segmentation

The aluminium profiles industry research report provides comprehensive data including region-wise segment analysis, with forecasts and analysis for the period 2026-2030, as well as historical data from 2020-2024 for the following segments.

Market Segment by Product type
  • Hollow profiles
  • Solid profiles
  • Semi hollow profiles
  • Others
Market Segment by End-user
  • Building and construction
  • Automotive and transportation
  • Electrical and electronics
  • Industrial
  • Others
Market Segment by Type
  • Mill finished
  • Anodized
  • Others
Market Segment by Geography
APAC
China, India, Japan, South Korea, Australia, Indonesia
Europe
Germany, Italy, UK, France, Spain
North America
US, Canada, Mexico
South America
Brazil, Argentina, Chile
Middle East and Africa
UAE, Saudi Arabia, South Africa, Egypt, Turkey

Product Type Segment Analysis

The hollow profiles segment is estimated to witness significant growth during the forecast period.

Hollow profiles, defined by one or more enclosed voids, are manufactured using complex porthole dies to achieve a high moment of inertia with minimal material.

This lightweighting characteristic is critical in applications requiring an advanced strength-to-weight ratio, such as in automotive and aerospace manufacturing.

Their design, which can integrate functions like thermal breaks or fluid channels, makes them invaluable for energy-efficient building envelopes and thermal management systems.

The extrusion process for these components demands significant technical expertise to manage the metal flow and maintain structural integrity.

This segment's importance is underscored by its contribution, accounting for over 43% of the market, driven by the escalating need for high-performance, multifunctional components in advanced engineering sectors.

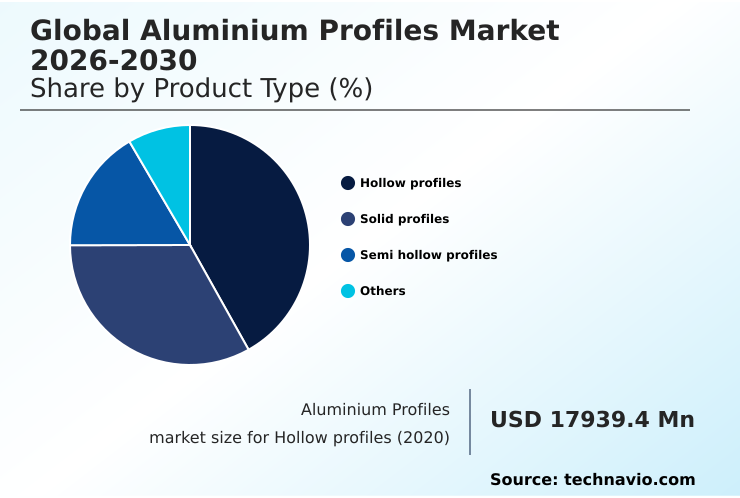
The Hollow profiles segment was valued at USD 24.70 billion in 2024 and showed a gradual increase during the forecast period.

Aluminium Profiles Market by Region: APAC Leads with 54.6% Growth Share

APAC is estimated to contribute 54.6% to the growth of the global market during the forecast period.

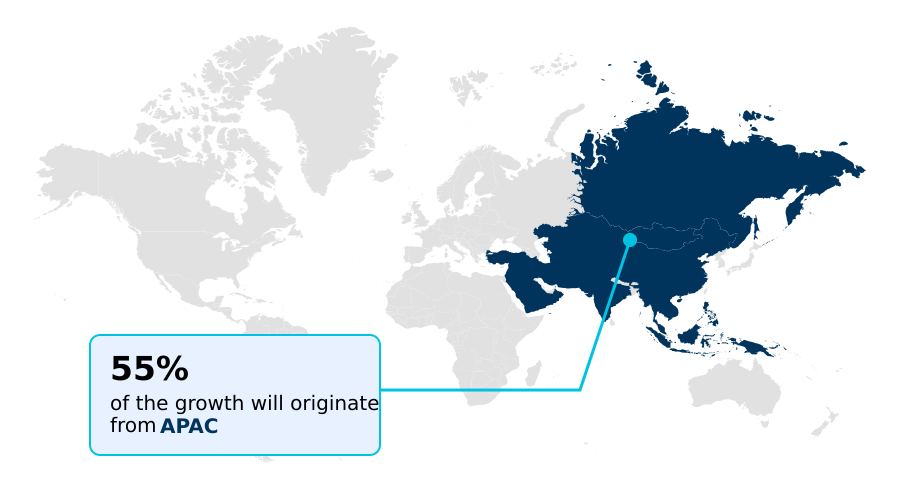
The geographic landscape is dominated by APAC, which is set to contribute over 54% of the market's growth, fueled by massive renewable energy infrastructure projects and rapid urbanization in China and India.

Government-led initiatives in these countries are promoting prefabricated construction and the development of high-speed rail, creating sustained demand for architectural extrusion and structural framing.

In this region, manufacturers are quickly adopting digital twins and automated handling systems to enhance production efficiency and meet stringent quality standards for both domestic consumption and export.

European and North American markets, while more mature, are focused on high-value applications, including aerospace components and advanced thermal management systems, where superior dimensional tolerances and complex cross-sectional geometry are critical.

Compliance with frameworks like the Carbon Border Adjustment Mechanism is a key strategic consideration for all regions trading with Europe.

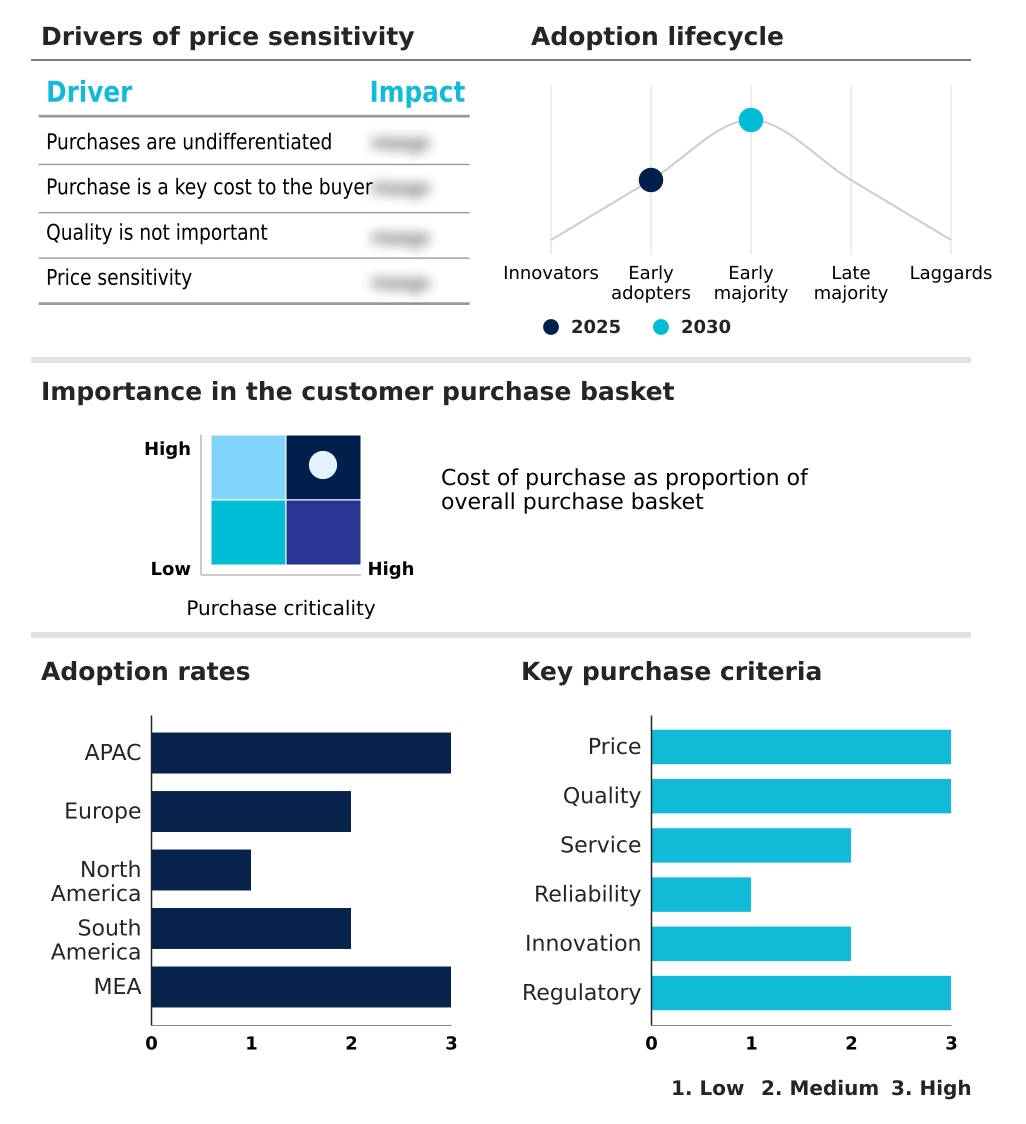
Customer Landscape Analysis for the Aluminium Profiles Market

The aluminium profiles market forecasting report includes the adoption lifecycle of the market, covering from the innovator’s stage to the laggard’s stage. It focuses on adoption rates in different regions based on penetration. Furthermore, the aluminium profiles market report also includes key purchase criteria and drivers of price sensitivity to help companies evaluate and develop their market growth analysis strategies.

Competitive Landscape of the Aluminium Profiles Market

Companies are implementing various strategies, such as strategic alliances, partnerships, mergers and acquisitions, geographical expansion, and product/service launches, to enhance their presence in the aluminium profiles market industry.

Alumil S.A. - Delivering specialized aluminium profiles, from standard architectural extrusions to customized thermal break and industrial sections, engineered for diverse applications.

The industry research and growth report includes detailed analyses of the competitive landscape of the market and information about key companies, including:

  • Alumil S.A.
  • AluPure
  • Arconic Corp.
  • Bonnell Aluminum Inc.
  • Capral Ltd.
  • Constellium SE
  • Exlabesa
  • Hindalco Industries
  • Impol Group
  • Kaiser Aluminum Corp.
  • Metra S.p.A.
  • Minalex Corp
  • Norsk Hydro ASA
  • Oldcastle BuildingEnvelope
  • Pennex Aluminum Co LLC
  • Reynaers Aluminium NV
  • Schuco International KG
  • Taber Extrusions LLC
  • Western Extrusions Corp.
  • Xingfa Aluminium Holdings Ltd.

Qualitative and quantitative analysis of companies has been conducted to help clients understand the wider business environment as well as the strengths and weaknesses of key industry players. Data is qualitatively analyzed to categorize companies as pure play, category-focused, industry-focused, and diversified; it is quantitatively analyzed to categorize companies as dominant, leading, strong, tentative, and weak.

Recent Developments in the Aluminium Profiles Market

  • In May 2025, Tesla Inc. expanded production at its Texas Gigafactory to include a new extrusion wing for monolithic aluminium side-rail profiles for next-generation passenger vehicles.
  • In April 2025, SMS Group introduced a specialized software suite for real-time monitoring of aluminium extrusion presses, using machine learning to predict die wear and optimize energy consumption.
  • In August 2025, the European Space Agency finalized testing of a new aluminium-scandium extruded profile for satellite structural frames to improve thermal stability and reduce launch payload mass.
  • In October 2s025, Companhia Brasileira de Aluminio launched a circularity program in South America, integrating post-consumer scrap into primary extrusion billets for a new line of low-carbon building profiles.

Research Analyst Overview: Aluminium Profiles Market

Boardroom-level decisions are now centered on balancing high capital expenditures for technological upgrades against the long-term competitive advantages of sustainability and operational efficiency. The integration of digital twins and automated extrusion press controls is no longer a luxury but a necessity for achieving the tight dimensional tolerances required by the automotive and aerospace sectors.

With the building and construction segment commanding over half the market, compliance with green building standards like LEED is a primary driver for specifying profiles with integrated thermal breaks and high-recycled content. This pivot toward a circular economy is compelling investments in sophisticated sorting technologies for post-consumer scrap to produce high-quality secondary aluminium.

The market's 8.1% year-over-year growth is not just a measure of volume but of a fundamental shift toward higher-value products, including specialized 6000 and 7000 series alloys. Firms that master the complexities of the extrusion process for these advanced materials, while navigating volatile energy costs and stringent environmental product declarations, will be best positioned to capture this growth.

Dive into Technavio’s robust research methodology, blending expert interviews, extensive data synthesis, and validated models for unparalleled Aluminium Profiles Market insights. See full methodology.

Request Free Sample

Market Scope
Page number 307
Base year 2025
Historic period 2020-2024
Forecast period 2026-2030
Growth momentum & CAGR Accelerate at a CAGR of 8.3%
Market growth 2026-2030 USD 30757.3 million
Market structure Fragmented
YoY growth 2025-2026(%) 8.1%
Key countries China, India, Japan, South Korea, Australia, Indonesia, Germany, Italy, UK, France, Spain, Russia, US, Canada, Mexico, Brazil, Argentina, Chile, UAE, Saudi Arabia, South Africa, Egypt and Turkey
Competitive landscape Leading Companies, Market Positioning of Companies, Competitive Strategies, and Industry Risks

Aluminium Profiles Market: Key Questions Answered in This Report

  • What is the expected growth of the Aluminium Profiles Market between 2026 and 2030?

    • The Aluminium Profiles Market is expected to grow by USD 30.76 billion during 2026-2030, registering a CAGR of 8.3%. Year-over-year growth in 2026 is estimated at 8.1%%. This acceleration is shaped by acceleration of automotive lightweighting and electric vehicle adoption, which is intensifying demand across multiple end-use verticals covered in the report.

  • What segmentation does the market report cover?

    • The report is segmented by Product Type (Hollow profiles, Solid profiles, Semi hollow profiles, and Others), End-user (Building and construction, Automotive and transportation, Electrical and electronics, Industrial, and Others), Type (Mill finished, Anodized, and Others) and Geography (APAC, Europe, North America, South America, Middle East and Africa). Among these, the Hollow profiles segment is estimated to witness significant growth during the forecast period, driven by rising adoption across key application areas. Each segment includes detailed qualitative and quantitative analysis, along with historical data from 2020-2024 and forecasts through 2030 with year-over-year growth rates.

  • Which regions are analyzed in the report?

    • The report covers APAC, Europe, North America, South America and Middle East and Africa. APAC is estimated to contribute 54.6% to market growth during the forecast period. Country-level analysis includes China, India, Japan, South Korea, Australia, Indonesia, Germany, Italy, UK, France, Spain, Russia, US, Canada, Mexico, Brazil, Argentina, Chile, UAE, Saudi Arabia, South Africa, Egypt and Turkey, with dedicated market size tables and year-over-year growth for each.

  • What are the key growth drivers and market challenges?

    • The primary driver is acceleration of automotive lightweighting and electric vehicle adoption, which is accelerating investment and industry demand. The main challenge is volatility in raw material pricing and energy supply, creating operational barriers for key market participants. The report quantifies the impact of each driver and challenge across 2026 and 2030 with comparative analysis.

  • Who are the major players in the Aluminium Profiles Market?

    • Key vendors include Alumil S.A., AluPure, Arconic Corp., Bonnell Aluminum Inc., Capral Ltd., Constellium SE, Exlabesa, Hindalco Industries, Impol Group, Kaiser Aluminum Corp., Metra S.p.A., Minalex Corp, Norsk Hydro ASA, Oldcastle BuildingEnvelope, Pennex Aluminum Co LLC, Reynaers Aluminium NV, Schuco International KG, Taber Extrusions LLC, Western Extrusions Corp. and Xingfa Aluminium Holdings Ltd.. The report provides qualitative and quantitative analysis categorizing companies as dominant, leading, strong, tentative, and weak based on their market positioning. Company profiles include business segment analysis, SWOT assessment, key offerings, and recent strategic developments.

Aluminium Profiles Market Research Insights

Market dynamics are shaped by a push-pull between performance requirements and sustainability mandates. The growing demand for green aluminium, driven by regulations such as Europe's Sustainable Structures Act, compels manufacturers to provide detailed environmental product declarations and ensure material traceability throughout the supply chain.

This is particularly relevant as the automotive and transportation segment, with a growth rate outpacing some traditional sectors, increasingly requires low-carbon primary metal for electric vehicle battery enclosures. The market is responding with innovations in advanced alloy chemistry and an emphasis on modular framing systems that allow for design flexibility.

Simultaneously, the need for robust thermal management systems in electronics and high-power applications maintains steady demand for profiles with superior thermal conductivity, ensuring the material's relevance across a diverse industrial base.

We can help! Our analysts can customize this aluminium profiles market research report to meet your requirements.

Get in touch

1. Executive Summary

1.1 Market overview

Executive Summary - Chart on Market Overview
Executive Summary - Data Table on Market Overview
Executive Summary - Chart on Global Market Characteristics
Executive Summary - Chart on Market by Geography
Executive Summary - Chart on Market Segmentation by Product Type
Executive Summary - Chart on Market Segmentation by End-user
Executive Summary - Chart on Market Segmentation by Type
Executive Summary - Chart on Incremental Growth
Executive Summary - Data Table on Incremental Growth
Executive Summary - Chart on Company Market Positioning

2. Technavio Analysis

2.1 Analysis of price sensitivity, lifecycle, customer purchase basket, adoption rates, and purchase criteria

2.2 Criticality of inputs and Factors of differentiation

Chart on Overview on criticality of inputs and factors of differentiation

2.3 Factors of disruption

Chart on Overview on factors of disruption

2.4 Impact of drivers and challenges

Chart on Impact of drivers and challenges in 2025 and 2030

3. Market Landscape

3.1 Market ecosystem

Chart on Parent Market
Data Table on - Parent Market

3.2 Market characteristics

Chart on Market characteristics analysis

3.3 Value chain analysis

Chart on Value chain analysis

4. Market Sizing

4.1 Market definition

Data Table on Offerings of companies included in the market definition

4.2 Market segment analysis

Market segments

4.3 Market size 2025

4.4 Market outlook: Forecast for 2025-2030

Chart on Global - Market size and forecast 2025-2030 ($ million)
Data Table on Global - Market size and forecast 2025-2030 ($ million)
Chart on Global Market: Year-over-year growth 2025-2030 (%)
Data Table on Global Market: Year-over-year growth 2025-2030 (%)

5. Historic Market Size

5.1 Global Aluminium Profiles Market 2020 - 2024

Historic Market Size - Data Table on Global Aluminium Profiles Market 2020 - 2024 ($ million)

5.2 Product Type segment analysis 2020 - 2024

Historic Market Size - Product Type Segment 2020 - 2024 ($ million)

5.3 End-user segment analysis 2020 - 2024

Historic Market Size - End-user Segment 2020 - 2024 ($ million)

5.4 Type segment analysis 2020 - 2024

Historic Market Size - Type Segment 2020 - 2024 ($ million)

5.5 Geography segment analysis 2020 - 2024

Historic Market Size - Geography Segment 2020 - 2024 ($ million)

5.6 Country segment analysis 2020 - 2024

Historic Market Size - Country Segment 2020 - 2024 ($ million)

6. Qualitative Analysis

6.1 The AI impact on Global Aluminium Profiles Market

6.2 Impact of geopolitical conflicts on Global Aluminium Profiles Market

7. Five Forces Analysis

7.1 Five forces summary

Five forces analysis - Comparison between 2025 and 2030

7.2 Bargaining power of buyers

Bargaining power of buyers - Impact of key factors 2025 and 2030

7.3 Bargaining power of suppliers

Bargaining power of suppliers - Impact of key factors in 2025 and 2030

7.4 Threat of new entrants

Threat of new entrants - Impact of key factors in 2025 and 2030

7.5 Threat of substitutes

Threat of substitutes - Impact of key factors in 2025 and 2030

7.6 Threat of rivalry

Threat of rivalry - Impact of key factors in 2025 and 2030

7.7 Market condition

Chart on Market condition - Five forces 2025 and 2030

8. Market Segmentation by Product Type

8.1 Market segments

Chart on Product Type - Market share 2025-2030 (%)
Data Table on Product Type - Market share 2025-2030 (%)

8.2 Comparison by Product Type

Chart on Comparison by Product Type
Data Table on Comparison by Product Type

8.3 Hollow profiles - Market size and forecast 2025-2030

Chart on Hollow profiles - Market size and forecast 2025-2030 ($ million)
Data Table on Hollow profiles - Market size and forecast 2025-2030 ($ million)
Chart on Hollow profiles - Year-over-year growth 2025-2030 (%)
Data Table on Hollow profiles - Year-over-year growth 2025-2030 (%)

8.4 Solid profiles - Market size and forecast 2025-2030

Chart on Solid profiles - Market size and forecast 2025-2030 ($ million)
Data Table on Solid profiles - Market size and forecast 2025-2030 ($ million)
Chart on Solid profiles - Year-over-year growth 2025-2030 (%)
Data Table on Solid profiles - Year-over-year growth 2025-2030 (%)

8.5 Semi hollow profiles - Market size and forecast 2025-2030

Chart on Semi hollow profiles - Market size and forecast 2025-2030 ($ million)
Data Table on Semi hollow profiles - Market size and forecast 2025-2030 ($ million)
Chart on Semi hollow profiles - Year-over-year growth 2025-2030 (%)
Data Table on Semi hollow profiles - Year-over-year growth 2025-2030 (%)

8.6 Others - Market size and forecast 2025-2030

Chart on Others - Market size and forecast 2025-2030 ($ million)
Data Table on Others - Market size and forecast 2025-2030 ($ million)
Chart on Others - Year-over-year growth 2025-2030 (%)
Data Table on Others - Year-over-year growth 2025-2030 (%)

8.7 Market opportunity by Product Type

Market opportunity by Product Type ($ million)
Data Table on Market opportunity by Product Type ($ million)

9. Market Segmentation by End-user

9.1 Market segments

Chart on End-user - Market share 2025-2030 (%)
Data Table on End-user - Market share 2025-2030 (%)

9.2 Comparison by End-user

Chart on Comparison by End-user
Data Table on Comparison by End-user

9.3 Building and construction - Market size and forecast 2025-2030

Chart on Building and construction - Market size and forecast 2025-2030 ($ million)
Data Table on Building and construction - Market size and forecast 2025-2030 ($ million)
Chart on Building and construction - Year-over-year growth 2025-2030 (%)
Data Table on Building and construction - Year-over-year growth 2025-2030 (%)

9.4 Automotive and transportation - Market size and forecast 2025-2030

Chart on Automotive and transportation - Market size and forecast 2025-2030 ($ million)
Data Table on Automotive and transportation - Market size and forecast 2025-2030 ($ million)
Chart on Automotive and transportation - Year-over-year growth 2025-2030 (%)
Data Table on Automotive and transportation - Year-over-year growth 2025-2030 (%)

9.5 Electrical and electronics - Market size and forecast 2025-2030

Chart on Electrical and electronics - Market size and forecast 2025-2030 ($ million)
Data Table on Electrical and electronics - Market size and forecast 2025-2030 ($ million)
Chart on Electrical and electronics - Year-over-year growth 2025-2030 (%)
Data Table on Electrical and electronics - Year-over-year growth 2025-2030 (%)

9.6 Industrial - Market size and forecast 2025-2030

Chart on Industrial - Market size and forecast 2025-2030 ($ million)
Data Table on Industrial - Market size and forecast 2025-2030 ($ million)
Chart on Industrial - Year-over-year growth 2025-2030 (%)
Data Table on Industrial - Year-over-year growth 2025-2030 (%)

9.7 Others - Market size and forecast 2025-2030

Chart on Others - Market size and forecast 2025-2030 ($ million)
Data Table on Others - Market size and forecast 2025-2030 ($ million)
Chart on Others - Year-over-year growth 2025-2030 (%)
Data Table on Others - Year-over-year growth 2025-2030 (%)

9.8 Market opportunity by End-user

Market opportunity by End-user ($ million)
Data Table on Market opportunity by End-user ($ million)

10. Market Segmentation by Type

10.1 Market segments

Chart on Type - Market share 2025-2030 (%)
Data Table on Type - Market share 2025-2030 (%)

10.2 Comparison by Type

Chart on Comparison by Type
Data Table on Comparison by Type

10.3 Mill finished - Market size and forecast 2025-2030

Chart on Mill finished - Market size and forecast 2025-2030 ($ million)
Data Table on Mill finished - Market size and forecast 2025-2030 ($ million)
Chart on Mill finished - Year-over-year growth 2025-2030 (%)
Data Table on Mill finished - Year-over-year growth 2025-2030 (%)

10.4 Anodized - Market size and forecast 2025-2030

Chart on Anodized - Market size and forecast 2025-2030 ($ million)
Data Table on Anodized - Market size and forecast 2025-2030 ($ million)
Chart on Anodized - Year-over-year growth 2025-2030 (%)
Data Table on Anodized - Year-over-year growth 2025-2030 (%)

10.5 Others - Market size and forecast 2025-2030

Chart on Others - Market size and forecast 2025-2030 ($ million)
Data Table on Others - Market size and forecast 2025-2030 ($ million)
Chart on Others - Year-over-year growth 2025-2030 (%)
Data Table on Others - Year-over-year growth 2025-2030 (%)

10.6 Market opportunity by Type

Market opportunity by Type ($ million)
Data Table on Market opportunity by Type ($ million)

11. Customer Landscape

11.1 Customer landscape overview

Analysis of price sensitivity, lifecycle, customer purchase basket, adoption rates, and purchase criteria

12. Geographic Landscape

12.1 Geographic segmentation

Chart on Market share by geography 2025-2030 (%)
Data Table on Market share by geography 2025-2030 (%)

12.2 Geographic comparison

Chart on Geographic comparison
Data Table on Geographic comparison

12.3 APAC - Market size and forecast 2025-2030

Chart on APAC - Market size and forecast 2025-2030 ($ million)
Data Table on APAC - Market size and forecast 2025-2030 ($ million)
Chart on APAC - Year-over-year growth 2025-2030 (%)
Data Table on APAC - Year-over-year growth 2025-2030 (%)
Chart on Regional Comparison - APAC
Data Table on Regional Comparison - APAC

12.3.1 China - Market size and forecast 2025-2030

Chart on China - Market size and forecast 2025-2030 ($ million)
Data Table on China - Market size and forecast 2025-2030 ($ million)
Chart on China - Year-over-year growth 2025-2030 (%)
Data Table on China - Year-over-year growth 2025-2030 (%)

12.3.2 India - Market size and forecast 2025-2030

Chart on India - Market size and forecast 2025-2030 ($ million)
Data Table on India - Market size and forecast 2025-2030 ($ million)
Chart on India - Year-over-year growth 2025-2030 (%)
Data Table on India - Year-over-year growth 2025-2030 (%)

12.3.3 Japan - Market size and forecast 2025-2030

Chart on Japan - Market size and forecast 2025-2030 ($ million)
Data Table on Japan - Market size and forecast 2025-2030 ($ million)
Chart on Japan - Year-over-year growth 2025-2030 (%)
Data Table on Japan - Year-over-year growth 2025-2030 (%)

12.3.4 South Korea - Market size and forecast 2025-2030

Chart on South Korea - Market size and forecast 2025-2030 ($ million)
Data Table on South Korea - Market size and forecast 2025-2030 ($ million)
Chart on South Korea - Year-over-year growth 2025-2030 (%)
Data Table on South Korea - Year-over-year growth 2025-2030 (%)

12.3.5 Australia - Market size and forecast 2025-2030

Chart on Australia - Market size and forecast 2025-2030 ($ million)
Data Table on Australia - Market size and forecast 2025-2030 ($ million)
Chart on Australia - Year-over-year growth 2025-2030 (%)
Data Table on Australia - Year-over-year growth 2025-2030 (%)

12.3.6 Indonesia - Market size and forecast 2025-2030

Chart on Indonesia - Market size and forecast 2025-2030 ($ million)
Data Table on Indonesia - Market size and forecast 2025-2030 ($ million)
Chart on Indonesia - Year-over-year growth 2025-2030 (%)
Data Table on Indonesia - Year-over-year growth 2025-2030 (%)

12.4 Europe - Market size and forecast 2025-2030

Chart on Europe - Market size and forecast 2025-2030 ($ million)
Data Table on Europe - Market size and forecast 2025-2030 ($ million)
Chart on Europe - Year-over-year growth 2025-2030 (%)
Data Table on Europe - Year-over-year growth 2025-2030 (%)
Chart on Regional Comparison - Europe
Data Table on Regional Comparison - Europe

12.4.1 Germany - Market size and forecast 2025-2030

Chart on Germany - Market size and forecast 2025-2030 ($ million)
Data Table on Germany - Market size and forecast 2025-2030 ($ million)
Chart on Germany - Year-over-year growth 2025-2030 (%)
Data Table on Germany - Year-over-year growth 2025-2030 (%)

12.4.2 Italy - Market size and forecast 2025-2030

Chart on Italy - Market size and forecast 2025-2030 ($ million)
Data Table on Italy - Market size and forecast 2025-2030 ($ million)
Chart on Italy - Year-over-year growth 2025-2030 (%)
Data Table on Italy - Year-over-year growth 2025-2030 (%)

12.4.3 UK - Market size and forecast 2025-2030

Chart on UK - Market size and forecast 2025-2030 ($ million)
Data Table on UK - Market size and forecast 2025-2030 ($ million)
Chart on UK - Year-over-year growth 2025-2030 (%)
Data Table on UK - Year-over-year growth 2025-2030 (%)

12.4.4 France - Market size and forecast 2025-2030

Chart on France - Market size and forecast 2025-2030 ($ million)
Data Table on France - Market size and forecast 2025-2030 ($ million)
Chart on France - Year-over-year growth 2025-2030 (%)
Data Table on France - Year-over-year growth 2025-2030 (%)

12.4.5 Spain - Market size and forecast 2025-2030

Chart on Spain - Market size and forecast 2025-2030 ($ million)
Data Table on Spain - Market size and forecast 2025-2030 ($ million)
Chart on Spain - Year-over-year growth 2025-2030 (%)
Data Table on Spain - Year-over-year growth 2025-2030 (%)

12.4.6 Russia - Market size and forecast 2025-2030

Chart on Russia - Market size and forecast 2025-2030 ($ million)
Data Table on Russia - Market size and forecast 2025-2030 ($ million)
Chart on Russia - Year-over-year growth 2025-2030 (%)
Data Table on Russia - Year-over-year growth 2025-2030 (%)

12.5 North America - Market size and forecast 2025-2030

Chart on North America - Market size and forecast 2025-2030 ($ million)
Data Table on North America - Market size and forecast 2025-2030 ($ million)
Chart on North America - Year-over-year growth 2025-2030 (%)
Data Table on North America - Year-over-year growth 2025-2030 (%)
Chart on Regional Comparison - North America
Data Table on Regional Comparison - North America

12.5.1 US - Market size and forecast 2025-2030

Chart on US - Market size and forecast 2025-2030 ($ million)
Data Table on US - Market size and forecast 2025-2030 ($ million)
Chart on US - Year-over-year growth 2025-2030 (%)
Data Table on US - Year-over-year growth 2025-2030 (%)

12.5.2 Canada - Market size and forecast 2025-2030

Chart on Canada - Market size and forecast 2025-2030 ($ million)
Data Table on Canada - Market size and forecast 2025-2030 ($ million)
Chart on Canada - Year-over-year growth 2025-2030 (%)
Data Table on Canada - Year-over-year growth 2025-2030 (%)

12.5.3 Mexico - Market size and forecast 2025-2030

Chart on Mexico - Market size and forecast 2025-2030 ($ million)
Data Table on Mexico - Market size and forecast 2025-2030 ($ million)
Chart on Mexico - Year-over-year growth 2025-2030 (%)
Data Table on Mexico - Year-over-year growth 2025-2030 (%)

12.6 South America - Market size and forecast 2025-2030

Chart on South America - Market size and forecast 2025-2030 ($ million)
Data Table on South America - Market size and forecast 2025-2030 ($ million)
Chart on South America - Year-over-year growth 2025-2030 (%)
Data Table on South America - Year-over-year growth 2025-2030 (%)
Chart on Regional Comparison - South America
Data Table on Regional Comparison - South America

12.6.1 Brazil - Market size and forecast 2025-2030

Chart on Brazil - Market size and forecast 2025-2030 ($ million)
Data Table on Brazil - Market size and forecast 2025-2030 ($ million)
Chart on Brazil - Year-over-year growth 2025-2030 (%)
Data Table on Brazil - Year-over-year growth 2025-2030 (%)

12.6.2 Argentina - Market size and forecast 2025-2030

Chart on Argentina - Market size and forecast 2025-2030 ($ million)
Data Table on Argentina - Market size and forecast 2025-2030 ($ million)
Chart on Argentina - Year-over-year growth 2025-2030 (%)
Data Table on Argentina - Year-over-year growth 2025-2030 (%)

12.6.3 Chile - Market size and forecast 2025-2030

Chart on Chile - Market size and forecast 2025-2030 ($ million)
Data Table on Chile - Market size and forecast 2025-2030 ($ million)
Chart on Chile - Year-over-year growth 2025-2030 (%)
Data Table on Chile - Year-over-year growth 2025-2030 (%)

12.7 Middle East and Africa - Market size and forecast 2025-2030

Chart on Middle East and Africa - Market size and forecast 2025-2030 ($ million)
Data Table on Middle East and Africa - Market size and forecast 2025-2030 ($ million)
Chart on Middle East and Africa - Year-over-year growth 2025-2030 (%)
Data Table on Middle East and Africa - Year-over-year growth 2025-2030 (%)
Chart on Regional Comparison - Middle East and Africa
Data Table on Regional Comparison - Middle East and Africa

12.7.1 UAE - Market size and forecast 2025-2030

Chart on UAE - Market size and forecast 2025-2030 ($ million)
Data Table on UAE - Market size and forecast 2025-2030 ($ million)
Chart on UAE - Year-over-year growth 2025-2030 (%)
Data Table on UAE - Year-over-year growth 2025-2030 (%)

12.7.2 Saudi Arabia - Market size and forecast 2025-2030

Chart on Saudi Arabia - Market size and forecast 2025-2030 ($ million)
Data Table on Saudi Arabia - Market size and forecast 2025-2030 ($ million)
Chart on Saudi Arabia - Year-over-year growth 2025-2030 (%)
Data Table on Saudi Arabia - Year-over-year growth 2025-2030 (%)

12.7.3 South Africa - Market size and forecast 2025-2030

Chart on South Africa - Market size and forecast 2025-2030 ($ million)
Data Table on South Africa - Market size and forecast 2025-2030 ($ million)
Chart on South Africa - Year-over-year growth 2025-2030 (%)
Data Table on South Africa - Year-over-year growth 2025-2030 (%)

12.7.4 Egypt - Market size and forecast 2025-2030

Chart on Egypt - Market size and forecast 2025-2030 ($ million)
Data Table on Egypt - Market size and forecast 2025-2030 ($ million)
Chart on Egypt - Year-over-year growth 2025-2030 (%)
Data Table on Egypt - Year-over-year growth 2025-2030 (%)

12.7.5 Turkey - Market size and forecast 2025-2030

Chart on Turkey - Market size and forecast 2025-2030 ($ million)
Data Table on Turkey - Market size and forecast 2025-2030 ($ million)
Chart on Turkey - Year-over-year growth 2025-2030 (%)
Data Table on Turkey - Year-over-year growth 2025-2030 (%)

12.8 Market opportunity by geography

Market opportunity by geography ($ million)
Data Tables on Market opportunity by geography ($ million)

13. Drivers, Challenges, and Opportunity

13.1 Market drivers

Acceleration of automotive lightweighting and electric vehicle adoption
Expansion of sustainable urbanization and energy-efficient building envelopes
Rapid growth in renewable energy infrastructure and solar power systems

13.2 Market challenges

Volatility in raw material pricing and energy supply
Implementation of rigorous environmental regulations and carbon border taxes
Geopolitical instability and rise of trade protectionism

13.3 Impact of drivers and challenges

Impact of drivers and challenges in 2025 and 2030

13.4 Market opportunities

Integration of AI and advanced automation in extrusion facilities
Advancement in high-performance alloy chemistry for specialized engineering
Pivot toward circular economy models and low-carbon secondary aluminium production

14. Competitive Landscape

14.1 Overview

14.2

Overview on criticality of inputs and factors of differentiation

14.3 Landscape disruption

Overview on factors of disruption

14.4 Industry risks

Impact of key risks on business

15. Competitive Analysis

15.1 Companies profiled

Companies covered

15.2 Company ranking index

15.3 Market positioning of companies

Matrix on companies position and classification

15.4 Alumil S.A.

Alumil S.A. - Overview
Alumil S.A. - Product / Service
Alumil S.A. - Key offerings
SWOT

15.5 AluPure

AluPure - Overview
AluPure - Product / Service
AluPure - Key offerings
SWOT

15.6 Arconic Corp.

Arconic Corp. - Overview
Arconic Corp. - Product / Service
Arconic Corp. - Key offerings
SWOT

15.7 Bonnell Aluminum Inc.

Bonnell Aluminum Inc. - Overview
Bonnell Aluminum Inc. - Product / Service
Bonnell Aluminum Inc. - Key offerings
SWOT

15.8 Capral Ltd.

Capral Ltd. - Overview
Capral Ltd. - Product / Service
Capral Ltd. - Key offerings
SWOT

15.9 Constellium SE

Constellium SE - Overview
Constellium SE - Business segments
Constellium SE - Key offerings
Constellium SE - Segment focus
SWOT

15.10 Exlabesa

Exlabesa - Overview
Exlabesa - Product / Service
Exlabesa - Key offerings
SWOT

15.11 Hindalco Industries

Hindalco Industries - Overview
Hindalco Industries - Business segments
Hindalco Industries - Key offerings
Hindalco Industries - Segment focus
SWOT

15.12 Impol Group

Impol Group - Overview
Impol Group - Product / Service
Impol Group - Key offerings
SWOT

15.13 Kaiser Aluminum Corp.

Kaiser Aluminum Corp. - Overview
Kaiser Aluminum Corp. - Product / Service
Kaiser Aluminum Corp. - Key offerings
SWOT

15.14 Metra S.p.A.

Metra S.p.A. - Overview
Metra S.p.A. - Product / Service
Metra S.p.A. - Key offerings
SWOT

15.15 Minalex Corp

Minalex Corp - Overview
Minalex Corp - Product / Service
Minalex Corp - Key offerings
SWOT

15.16 Norsk Hydro ASA

Norsk Hydro ASA - Overview
Norsk Hydro ASA - Business segments
Norsk Hydro ASA - Key news
Norsk Hydro ASA - Key offerings
Norsk Hydro ASA - Segment focus
SWOT

15.17 Oldcastle BuildingEnvelope

Oldcastle BuildingEnvelope - Overview
Oldcastle BuildingEnvelope - Product / Service
Oldcastle BuildingEnvelope - Key offerings
SWOT

15.18 Pennex Aluminum Co LLC

Pennex Aluminum Co LLC - Overview
Pennex Aluminum Co LLC - Product / Service
Pennex Aluminum Co LLC - Key offerings
SWOT

16. Appendix

16.1 Scope of the report

Market definition
Objectives
Notes and caveats

16.2 Inclusions and exclusions checklist

Inclusions checklist
Exclusions checklist

16.3 Currency conversion rates for US$

16.4 Research methodology

16.5 Data procurement

Information sources

16.6 Data validation

16.7 Validation techniques employed for market sizing

16.8 Data synthesis

16.9 360 degree market analysis

16.10 List of abbreviations

Research Methodology

Technavio presents a detailed picture of the market by way of study, synthesis, and summation of data from multiple sources. The analysts have presented the various facets of the market with a particular focus on identifying the key industry influencers. The data thus presented is comprehensive, reliable, and the result of extensive research, both primary and secondary.

INFORMATION SOURCES

Primary sources

  • Manufacturers and suppliers
  • Channel partners
  • Industry experts
  • Strategic decision makers

Secondary sources

  • Industry journals and periodicals
  • Government data
  • Financial reports of key industry players
  • Historical data
  • Press releases

DATA ANALYSIS

Data Synthesis

  • Collation of data
  • Estimation of key figures
  • Analysis of derived insights

Data Validation

  • Triangulation with data models
  • Reference against proprietary databases
  • Corroboration with industry experts

REPORT WRITING

Qualitative

  • Market drivers
  • Market challenges
  • Market trends
  • Five forces analysis

Quantitative

  • Market size and forecast
  • Market segmentation
  • Geographical insights
  • Competitive landscape

Interested in this report?

Get your sample now to see our research methodology and insights!

Download Now

Frequently Asked Questions

Aluminium Profiles market growth will increase by USD 30757.3 million during 2026-2030.

The Aluminium Profiles market is expected to grow at a CAGR of 8.3% during 2026-2030.

Aluminium Profiles market is segmented by Product type (Hollow profiles, Solid profiles, Semi hollow profiles, Others) End-user (Building and construction, Automotive and transportation, Electrical and electronics, Industrial, Others) Type (Mill finished, Anodized, Others)

Alumil S.A., AluPure, Arconic Corp., Bonnell Aluminum Inc., Capral Ltd., Constellium SE, Exlabesa, Hindalco Industries, Impol Group, Kaiser Aluminum Corp., Metra S.p.A., Minalex Corp, Norsk Hydro ASA, Oldcastle BuildingEnvelope, Pennex Aluminum Co LLC, Reynaers Aluminium NV, Schuco International KG, Taber Extrusions LLC, Western Extrusions Corp., Xingfa Aluminium Holdings Ltd. are a few of the key vendors in the Aluminium Profiles market.

APAC will register the highest growth rate of 54.6% among the other regions. Therefore, the Aluminium Profiles market in APAC is expected to garner significant business opportunities for the vendors during the forecast period.

China, India, Japan, South Korea, Australia, Indonesia, Germany, Italy, UK, France, Spain, Russia, US, Canada, Mexico, Brazil, Argentina, Chile, UAE, Saudi Arabia, South Africa, Egypt, Turkey

  • Acceleration of automotive lightweighting and electric vehicle adoption is the driving factor this market.

The Aluminium Profiles market vendors should focus on grabbing business opportunities from the Product type segment as it accounted for the largest market share in the base year.
RIA - Research AI Assistant
Ask RIA